Yannis Pierrakis and Liam Collins
April 2013
BANKING ON
EACH OTHER
Peer–to–Peer lending to business:
evidence from funding circle
About Nesta
nesta is the uK’s innovation foundation. An independent charity, we
help people and organisations bring great ideas to life. We do this by
providing investments and grants and mobilising research, networks
and skills.
nesta operating company is a registered charity in england and Wales with company number 7706036 and charity number 1144091. registered as a charity in scotland number sc042833. registered office: 1 Plough Place, london, ec4A 1de
ExECuTIvE summARY
As banks retrench in the wake of the financial crisis, small businesses have found it increasingly hard to access the finance they need to grow. But there is some cause for optimism. New providers of business finance are stepping into the space left by banks, and are devising innovative business models, often taking advantage of new technologies and different sources of capital. One such model that has grown rapidly in recent years is peer–to–peer financing.
this report seeks to cast some light on the emerging field of peer–to–peer lending to businesses, using a large set of data collected through funding circle, the largest peer– to–peer business lending site in the uK. funding circle has facilitated approximately £100 million in loans to over 1,700 companies to date (as of April 2013).
this report looks at the characteristics of both funding circle’s borrowers and lenders, which enables the examination of the decision to seek or lend money through the peer– to–peer sites or ‘platforms’. it is the first attempt to analyse the peer–to–peer lending to businesses model using proprietary data from funding circle. using survey data from 630 investors and 89 companies the research identified that:
Lenders and their activity
• A typical lender is male, highly educated and relatively wealthy with a science, business or finance degree. He has around £80,000 in savings and investments and belongs to the top 20 per cent in terms of net financial wealth.
• the average lender has lent a total of £8,000 across loans to 67 companies, through funding circle. the average amount that individuals have lent to each company is £157 and the median £50. funding circle data suggests many lenders build strong portfolios of companies by lending to at least 100 companies.
• the expectation of making a financial return is the main motivation behind individuals’ decision to lend money to companies while the interest offered, risk rating and the financial track record of the company were deemed the most important factors in lender’s decisions. in contrast the market potential of the company is not of great importance to half of the survey respondents.
• seventy–five per cent of lenders surveyed expect to increase the amount they lend through funding circle in the coming year. should the model continue to gain traction with potential lenders, up to £12.3 billion worth of business lending could be facilitated through the peer–to–peer model per annum.
The businesses borrowing
• the average size of the loan raised by the surveyed companies is £35,000 (£50,000 for all companies that raised finance through funding circle) and the average number of people that lent money to each company is 418.
• the average interest rate of the loans provided to the sampled companies was 8.02 per cent.1 this is slightly lower than the interest rate for all businesses on funding circle
(which currently stands at 8.7 per cent). sixty per cent of the companies in the sample attempted to secure a bank loan before approaching funding circle. seventy–seven per cent of the surveyed companies are likely or very likely to approach funding circle
first in the future, if further external finance is needed. even if banks offer a borrowing facility similar to funding circle in the future, only 27 per cent of the surveyed
companies would approach banks first.
• funding circle’s speed and that it is not a bank seem to be the most important benefits for companies seeking external finance through the funding circle.
• thirty–two per cent of surveyed companies responded that without funding circle, it is likely or very likely that they wouldn’t have received external finance.
CONTENTs
1 INTROduCTION 7
1.1 THE fINANCIAL CRIsIs ANd BusINEss LENdING 7
1.2 THE RIsE Of THE fINANCE PLATfORms:
CROwdfuNdING ANd PEER-TO-PEER LENdING 10
1.2.1 Crowdfunding 10
1.2.2 Peer-to-peer lending 11
1.2.3 Technology and the growth in online finance 12
2 PEER-TO-PEER LENdERs 14
2.1 LENdERs TENd TO BE wEALTHY, wELL-EduCATEd ANd fROm THE sOuTH EAsT 14 2.2 LENdERs ACHIEvE HIGH LEvELs Of dIvERsIfICATION ANd mANY usE
THE AuTOBId TOOL 18
2.3 LENdERs ExPECT TO LENd mORE IN THE fuTuRE 20 2.4 INTEREsT RATE ANd RIsK RATING mOsT ImPORTANT fACTORs
fOR LENdERs 22
3 BORROwERs TENd TO BE EsTABLIsHEd BusINEssEs, ExPORTERs
ANd sEEKING fINANCE fOR wORKING CAPITAL OR ExPANsION 25
3.1 BORROwERs RECEIvE fuNds fROm A LARGE NumBER Of LENdERs 28 3.2 BORROwERs vALuEd THE sPEEd AT wHICH fuNdING wAs dELIvEREd
ANd dO NOT PLAN TO RETuRN TO BANKs fOR fuNdING IN THE fuTuRE 33
4 CONCLusION 38
5 APPENdIx 39
5.1 mETHOdOLOGY 39
5.2 ExAmINING THE dRIvERs Of THE AmOuNT LENT BY INdIvIduALs 39
6 ENdNOTEs 42
BANKING ON
EACH OTHER
Peer–to–Peer lending to business:
evidence from funding circle
fIGuREs
figure 1: Trends in lending to uK businesses 7
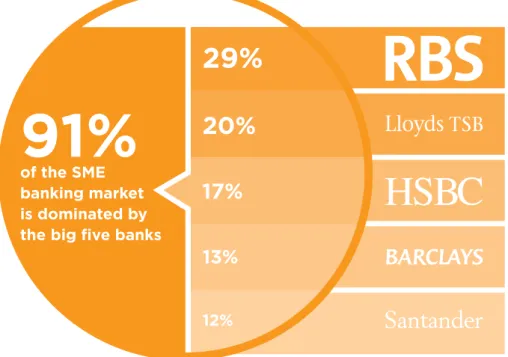
figure 2: Concentration of smE lending market in the uK 9
figure 3: Geographical location of borrowers 14
figure 4: Lenders’ highest level of qualification 15
figure 5: Lenders’ field of qualification 15
figure 6: Personal characteristics of lenders 16
figure 7: Investment practices 18
figure 8: secondary market activity 19
figure 9: Predictions of future lending activity 20
figure 10: How important are the following factors in your decision to lend money on funding Circle? 22
figure 11: How important are the following factors in your decision to lend money to a particular company? 23
figure 12: Businesses’ export activity 26
figure 13: The main reason(s) for raising external capital 26
figure 14: Companies’ regional distribution 27
figure 15: Average amount of loans raised 28
figure 16: Number of lenders to each company 29
figure 17: Companies’ risk rating 30
figure 18: Number of loans by risk rating 30
figure 19: Loan repayment and failure rate 31
figure 20: Reasons for the bank application not being completed 33
figure 21: Reasons for not attempting to secure a loan from a bank 34
figure 22: Benefits and drawbacks of borrowing through funding Circle 35
figure 23: what were the results of securing finance for your business? 36
figure 24: future borrowing behaviour 37
TABLEs
table 1: unsuccessful loan applications by smEs (as a total of total loan applications) 8
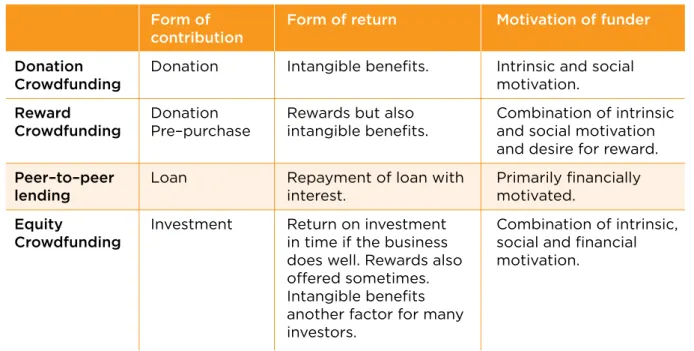
table 2: A typology of crowdfunding models 11
table 3: P2P lenders and business angel investors 17
table 4: Characteristics of the companies 25
table 5: Business loan characteristics 28
table 6: Bad debt by risk rating 32
table 7: Companies’ borrowing activity 32
1 INTROduCTION
1.1 THE fINANCIAL CRIsIs ANd BusINEss LENdING
the 2008 financial crisis and ensuing recession brought into stark focus the frailty of the financial system in the uK, and in particular its reliance on a few large banks that became ‘too big to fail’. the negative impact of the crisis was felt throughout the economy and especially by small businesses seeking finance from the banking sector. As a result, lending to small and medium–sized enterprises has fallen dramatically since the beginning of the financial crisis.
figure 1: Trends in lending to uK businesses
source: bank of england – trends in lending, April 2012
While lower demand for finance by businesses has contributed to some extent to this fall, many businesses and commentators pin much of the blame on the ability and willingness of the banking sector to lend. the impact of the crisis has been felt by businesses of all sizes, but smes were left particularly vulnerable as their size prevented them from accessing alternative sources of finance such as bond markets. the breedon review on boosting finance options for business, estimates that the finance gap for all businesses could be from £84 billion to £191 billion over the next five years.2
20
15 25 30
10
5
0
-5
-10
-15 Percentage changes on a year earlier
PNFCs (Private Non–financial Corporations) All SMEs Small businesses
2004 2005 2006 200
7
2008 2009 20
10
this contraction in loan provision has been caused both by the current pressures on incumbent lenders but also by issues related to the structure of the financial system highlighted in the aftermath of the crisis. on the former, regulation, both domestic and international, has led to banks restricting their flow of lending. capital adequacy rules have tightened considerably including higher capital ratios and new specific rules on risk weightings on sme loans and overdrafts.5 rejection
rates from banks have also consequently undergone a significant increase. As seen in table 1, the proportion of unsuccessful loan applications by smes has dramatically increased between 2007 and 2010 in all european countries, with the exception of sweden and germany. in the uK, there has been a 271 per cent increase in the unsuccessful loan applications between 2007 and 2010.
table 1: unsuccessful loan applications by smEs (as a percentage of total loan applications)
concerns regarding the concentration in the market for sme loans provision have also arisen in the wake of the crash. sme lending is particularly concentrated with just five providers supplying over 90 per cent of the lending.the dominance of these suppliers in the market and the lack of alternatives was highlighted by the public bailouts some banks required to keep them solvent.
the uK government has taken a variety of steps to address the issue of restricted lending, including Project merlin, an agreement between government and the banks which led to £190 billion of new loans from four of the major banks to businesses in 2011.6 in addition,
the national loan guarantee scheme was established with the aim to deliver more than £20 billion in lending to smes from the banks.7 in August last year, the government
announced the funding for lending scheme which aimed to ensure £80 billion of lending was completed to uK households and businesses.
as little as bank lending is involved today in SME financing. It is going to continue to shrink, very fast, over the next six to eight years.”
xavier Rolet, CEO, London stock Exchange3
British lenders are struggling to bolster capital to asset ratios; one way to do this is by cutting assets, including loans”.
The Economist 12 Jan 20134
‘‘
‘‘
2007 2010 difference (%)
Ireland 1 26.6 +2560%
Greece 0.7 10.8 +1443%
denmark 3.7 18.5 +400%
spain 3 13.2 +340%
Italy 1.2 4.9 +308%
uK 5.6 20.8 +271%
france 2 7 +250%
Netherlands 6.8 22.5 +231%
Germany 6.7 8.2 +22%
sweden 8.7 6.1 –30%
figure 2: Concentration of smE lending market in the uK
source: research now, mintel, 2011
While the majority of these measures are aimed at facilitating increased lending by
incumbent lenders, efforts are also being made to increase diversity in the lending market. the business bank8 aims to use £1 billion of government money to supply £10 billion in
loans to businesses and the business finance Partnership9 will co–invest £1.2 billion into
new sources of finance, primarily managed funds that will lend to businesses.
of the £1.2 billion supplied by the business finance Partnership, £100 million was set aside to support more disruptive models of finance provision. these models include online marketplaces, supply chain finance and mezzanine finance. one of the businesses to receive this money, £20 million from the pool, is the online peer–to–peer marketplace funding circle, which allows individuals to lend small amounts to businesses through its online platform.10 the model is part of a growing number of online marketplaces facilitating
the direct funding of large projects by individuals through aggregating small amounts. this type of investing is usually referred to by one of two terms that emerged in parallel, ‘crowdfunding’ or ‘peer–to–peer finance’.
BOx 1: ABOuT fuNdING CIRCLE
funding circle was founded in August 2010 and and was the first company in the world to allow individuals to lend to companies. to date it has facilitated the provision of approximately £100 million in loans to uK businesses. businesses with a minimum of £100,000 turnover and two or more years of accounts filed with companies House, can approach funding circle for the opportunity to borrow between £5,000 and £1 million from its crowd of members. currently there are more than 40,000 people registered and funding circle is facilitating £10 million of lending every month.
once a loan application meets funding circle’s criteria, it is reviewed by funding circle’s credit Assessment team. businesses that pass this stage are assigned a risk rating based
91%
of the SME banking market is dominated by the big five banks29%
20%
17%
13%
12%on funding circle’s risk model that uses information from a number of sources including credit–rating agency experian and is posted onto the site. each loan request has its own dedicated page where potential lenders can see the financial details of the business and why they are seeking finance.
lenders can then bid for small pieces or ‘loan parts’ of the overall amount being sought, indicating how much they would like to lend and what interest rate they would like to receive. the borrower can choose to accept the loan once the target is reached or leave it live for a maximum of seven or 14 days – depending on the size of the loan; the benefit of the latter being that the more time it is online, the more likely those parts of the loan with a high interest rate will be undercut by other lenders.
All loans, require security in the form of personal guarantees and larger loans require asset or property security (non–residential). funding circle charge fees to businesses ranging from 2–4 per cent depending on the loan amount. they also offer an asset– purchase option for a 5 per cent fee, using said asset as a guarantee. lenders are charged an annual servicing fee of 1 per cent.
funding circle also enables loan parts to be sold between lenders to provide liquidity. on average loan parts take about two days to be sold. Participants can sell loan parts either for a premium or at a discount and are charged a fee of 0.25 per cent.
1.2 THE RIsE Of THE fINANCE PLATfORms: CROwdfuNdING ANd PEER–TO–PEER LENdING
1.2.1 Crowdfunding
online crowdfunding,11 a relatively new form of financing for projects, people and
businesses has recently received considerable attention. the model, which allows many people to contribute small amounts in the hope of achieving a combined total that meets or surpasses a predetermined funding target, has its roots in the creative industries where it was successfully pioneered in the financing of albums and concerts. crowdfunding sites or ‘platforms’ sprung up that facilitated the sourcing of capital from large numbers of people for one–off projects. from its beginning funding music, the model expanded into the creative industries more broadly and into product design and development helped by the growth of large platforms such as Kickstarter and indiegogo. in recent years, the model has been adapted further to fund projects with a specifically social aim and also into the financing of businesses. Previous nesta reports12 provide detailed descriptions of the basic
principles and characteristics of crowdfunding as well as the many areas it operates in. they also describe a number of distinct models under the umbrella term of crowdfunding such as: donation crowdfunding, crowdfunded equity investing and crowdfunded lending. one important distinction between these models is the motives of the people that provide funding. As table 2 illustrates, this varies from the donation model where the aim is purely philanthropic to some who fund through the lending model who do so solely to attain a financial return.
table 2: A typology of crowdfunding models
1.2.2 Peer–to–peer lending
While similar to crowdfunding, peer–to–peer lending is very distinct. the term peer–to–peer lending has its origins in the facilitation of unsecured personal lending between individuals (i.e. loans are made to an individual rather than a company and borrowers do not provide collateral as a protection to the lender against default)13 via online sites such as Zopa,14
lending club15 and Prosper.16 there has been explosive growth in peer–to–peer personal
lending across the world in the last decade, driven by the many–to–many communication paradigm, and various reports have looked at several aspects of this model such as the borrowers and lenders characteristics, motivations and strategies.17
A relatively new application of the peer–to–peer lending model allows the crowd (individual lenders) to lend money to companies (instead of individuals) seeking debt finance. the platform facilitating the funding serves as an intermediary between the individual lender and the company seeking a loan. in most cases, the loan is an agreement between the borrower and the lender and not with the intermediary.
form of form of return motivation of funder contribution
donation donation intangible benefits. intrinsic and social
Crowdfunding motivation.
Reward donation rewards but also combination of intrinsic
Crowdfunding Pre–purchase intangible benefits. and social motivation
and desire for reward.
Peer–to–peer loan repayment of loan with Primarily financially
lending interest. motivated.
Equity investment return on investment combination of intrinsic,
Crowdfunding in time if the business social and financial
does well. rewards also motivation.
offered sometimes.
intangible benefits
another factor for many investors.
BOx 2: OTHER PEER–TO–PEER BusINEss LENdING PROvIdERs
funding circle is the largest but not the only player in the market for peer–to–peer business lending in the uK.
thincats operates as an investment club for experienced investors seeking to lend directly to uK businesses. launched in 2011, it uses a similar auction model to decide on interest rates and has achieved an average interest rate of over 10 per cent for lenders. lenders, who are required to lend a minimum of £1,000 per loan, are not charged any fees with businesses charged 1.5 per cent of the loan amount. to date thincats has lent around £20 million across 110 loans.
Another recipient of money from the business finance Partnership scheme is peer–to– peer lender Zopa. Zopa, who up to now have been focusing on personal lending were
the first peer–to–peer lender in the uK established in 2005. to date they have facilitated in over £270 million in lending and looking forward will be directing more of this towards sole trader loans up to £15,000.
1.2.3 Technology and the growth in online finance
According to crowdsourcing.org, in 2012, $2.7 billion was raised from the crowd (crowdfunding and peer–to–peer lending), mostly in the us, to finance over a million projects, ranging from start–ups18 to community projects,19 and from games20 to scientific
research.21 Peer–to–peer finance has been no exception with sites like Zopa, Prosper and
funding circle growing rapidly in recent years. While the recent global recession has played a part, advancements in technology are a significant driver of the recent growth of this type of model.
the proliferation of internet use and growth in social media has enabled those seeking finance to reach more people with greater ease and at far less cost. the ability to securely transfer money online allows those seeking to back a project or business to safely contribute funds. And the increase in the quality and volume of data available on individuals and businesses finances allow for the creation of accurate credit scores, which allow lenders to set suitable interest rates on the finance they offer. All of these have been catalysts for the recent growth of innovative forms of finance such as peer–to–peer.
the peer–to–peer business lending model is largely undiscovered by academics. there is some emerging literature on peer–to–peer lending between individuals but lending from people to businesses has received considerably less attention. therefore, this report is an explanatory and descriptive analysis which investigates questions related to the personal and behavioural characteristics of individuals and companies and aims to bring to light insights on this recent phenomenon.
the contribution of this research is twofold. first, it investigates the peer–to–peer lending model and provides insights on participant and investment characteristics. second, it examines the motivation behind the decisions made by both lenders and borrowers. As a result, for the first time we are able to understand what type of people and companies use peer–to–peer lending platforms and the main reasons behind their decisions to use them. more specifically, the research aims to:
• examine the origins of peer–to–peer lending and how the model operates.
• Profile those who lend and borrow through the model.
• examine the motivations behind individuals and businesses participation in peer–to– peer finance.
THE sTudY sAmPLE
the data collected for this study included responses to a survey from 630 different lenders who lent £4,143,000 through 34,700 individual loans (transactions), and from 89 individual companies, all of whom are members of the funding circle platform that collectively borrowed £2 million from lenders
Total
Number of lenders 630
Total amount lent by these lenders £4.1m
Number of individual loans made by these lenders 34,700
Number of companies 89
2 PEER–TO–PEER LENdERs
2.1 LENdERs TENd TO BE wEALTHY, wELL–EduCATEd ANd fROm THE sOuTH EAsT
there was considerable variation in the wealth, education and experience of those lenders that responded to the survey. their approach to lending through the model also varied with respect to the amounts lent and the businesses they lent to. below are some of the key findings from the lenders survey.
raising funding through crowd models has the potential to mitigate many of the distance effects found in traditional fundraising efforts (Agrawal et al., 2010).22 in the case of peer–
to–peer business lending, the majority of the peer–to–peer lenders are located in london and south east england (figure 3).
figure 3: Geographical location of lenders
North West England Northern
Ireland
Scotland
South West England
Wales
West Midlands
Yorkshire and the Humber
East Midlands
East of England
London
South East England North
East England
less than 10% Percentage of sample
10 - 20% more than 20%
twenty–two per cent of the surveyed lenders live in london and a similar proportion lives in the south east; 12.5 per cent of the lenders live in south West england.
figure 4: Lenders’ highest level of qualification
six per cent of the lenders surveyed have a Phd and 5 per cent have an mbA degree (figure 4). one quarter of lenders have another form of postgraduate qualification and around the same proportion hold a professional qualification. looking at the field of qualification, engineering, accountancy, business and it were the most common responses (figure 5).
figure 5: Lenders’ field of qualification
*A number of borrowers have very specific qualifications could not be assigned to any of the fields above
MBA Other PhD
Post Graduate
Professional Qualification Secondary
Undergraduate
5% 3%
6%
25%
23% 14%
24%
Business IT Accountancy Engineering
Computer Science Education Mathematics Economics Finance Electronics Management Law Biology Physics History Science Environmental Management Chemistry
Number of people
60 20
figure 6: Personal characteristics of lenders
figure 6 shows that the average lender is around 50 years old and male (83 per cent of all lenders that took part in the survey were males). forty-eight per cent have more than ten years’ experience working with large corporates and 38 per cent have more than ten years’ experience working with smes.
Half of them have not founded any new business, however, several lenders had founded more than one company. thirty per cent of them have experience in accessing external capital for businesses and 9 per cent of them identified themselves as business angel investors. Also, around 90 per cent of the surveyed lenders have invested money in bonds and shares.
15
10
5
0
Age of respondents
Business experience of lenders Percentage of
respondents
Gender of lenders
Male Female
80 60
20 40
17%
83%
Percentage of lenders with more than 10 years experience working within large companies Percentage of lenders with more than 10 years of experience working with SMEs
Percentage of lenders with investments such as bonds, shares etc.
Percentage of lenders that are business angel Percentage of lender with experience in accessing capital
100
40 60 80
0 20
48.2% 38.1%
88% 9%
in general, it appears that peer–to–peer business lenders are sophisticated individuals, highly–educated with investments in other assets. unfortunately, there is no data currently available on the characteristics of participants in crowdfunding and therefore an empirical comparison between peer–to–peer business lenders and crowdfunding contributors is not possible. However, anecdotal evidence suggests that crowdfunders (those donating or seeking a non–financial return from their contributions) are from more varied backgrounds and unlikely to have as much financial or investment experience. in contrast, peer–to–peer lenders seem to share several personal characteristics with business angels (table 3).
table 3: P2P lenders and business angel investors
P2P Lenders Business Angels median mean median mean
Age 51 50 53 52
Percentage male 85 93
Years with large 11 to 15 13 15
company
ventures founded 0 1 2.5 3.4
Number of companies 35 67 6 9
lent to/invested in
Percentage of their wealth 3 9 10 11
invested directly
Amount of money invested £2,000 £7,983 £220,000 £1,312,200
in total by each investor
Investment size £50 £157 £25,000 £42,000
(per investment)
2.2 LENdERs ACHIEvE HIGH LEvELs Of dIvERsIfICATION ANd mANY usE THE AuTOBId TOOL
figure 7 summarises investment characteristics. survey responders were asked questions related to their investment strategies such as number and size of loans made through funding circle.
figure 7: Investment practices
Percentage of lenders that use autobid function
Pr
oportion
of lenders
Yes No
45% 55%
Amount lent in total through FC(£) Amount of money lent by individual lenders 45%
40% 35% 30% 25% 20% 15% 10% 5% 0%
>3001 2001-3000
<1000 1001-2000
42%
10%
6%
41%
Financial w
ealth
Percentage of lenders Percentage of financial wealth lent through FC
>30%
10.1%-30%
5.1%-10%
2%-5%
<2%
the data shows that the respondents of the survey (only those that have made one or more investments) have lent on average £7,983 across loans to 67 companies. However, there is large heterogeneity between individual lenders which is evident from the median values. the median amount of money that individuals lent was £2,000 over loans to a median of 35 companies.
funding circle also provides an Autobid24 option for lenders. the lender sets the average
interest rate they require, the level of diversification they want and the risk bands the loans they are willing to fund must be in. the Autobid tool then bids on loan parts that meet these criteria and add successful bids to the lenders portfolio. the benefit of this is that those looking to lend to a large number of businesses can do so without having to go through them one–by–one. lenders in the sample made on average 35% of their loans via Autobid, however, there are several lenders (23.6 per cent of the sample) that lend all their money via Autobid (approximately 50 per cent according to funding circle’s data). the large proportion of loans made with Autobid underlines the disconnect between lending and engagement with the company and that lenders do not need to have significant investment expertise.
the total amount of capital that individuals have on average invested through funding circle as a proportion of their total financial wealth (savings and investment) is 9 per cent (similar to business angels who tend to invest around 10 per cent of their wealth into ventures).25 the total amount of savings and investment of the average lender is £340,000
(and the median £80,000). twenty–one per cent of lenders have lent money to one or more companies outside funding circle (to an average of 7.8 companies and a median of two). the average amount of money they have lent to these companies is £27,750 while the median is £10,000.
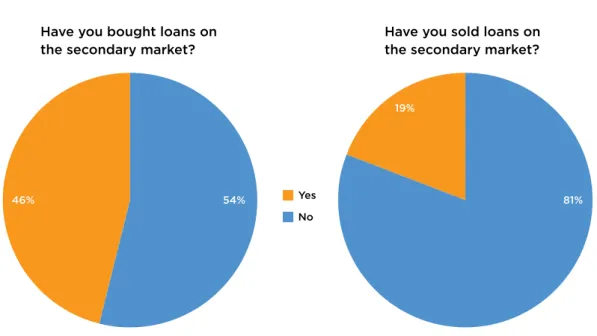
figure 8: secondary market activity
Almost half of the lenders have bought loan parts on the secondary market while almost one in five has sold loans through it (figure 8). the secondary market provides liquidity and it is an important aspect of the peer–to–peer lending which allows lenders to access their capital and any interest they have made before the end of the terms of the loan.
Yes
Have you bought loans on the secondary market?
Have you sold loans on the secondary market?
No
54% 81% 19%
the average time that a lender spends doing research on an individual business before bidding is 15 minutes. this illustrates that peer–to–peer lending is very different from business angel investing where potential investors dedicate significant time for due diligence and research before they decide to invest (a typical business angel spends 20 hours on due diligence before investing in a company).26 only one–quarter of the surveyed
lenders have used the Q&A facility, again confirming that most lenders rely instead on the risk rating assigned to individual loans by funding circle.
2.3 LENdERs ExPECT TO LENd mORE IN THE fuTuRE
figure 9: Predictions of future lending activity
figure 9 shows that 75 per cent of surveyed lenders expect that they will increase their lending through funding circle in the coming year. Peer–to–peer business lending is still in its infancy but has in recent years displayed the potential to become a valuable source of finance for uK smes. to give some indication of the potential size of this market in the future, the predictions current users made have been combined with financial wealth statistics from the ons in order to extrapolate what would happen if more people participated in peer–to–peer lending.
funding circle lenders were asked what percentage range (e.g. 5–10 per cent) of their savings and investments they envisaged lending through funding circle in the future. taking the average of the lower values in these ranges (e.g. the 5 from the above example) gives a figure of just over 13 per cent.
160
140
120
100
80
60
40
20
0 Number of respondents
Yes No
75% 25%
Les
s than 5% 5%-10%
10%-15%
15%-20% 20%-30%
30%-40% 40%-50%
50%-75% 75%+
Do you expect to increase the amount you lend through Funding Circle in the coming year
Looking ahead, what percentage of your portfolio could be made up of your Funding Circle investments?
As previously shown, the majority of participants on funding circle come from a wealthy subsection of population with the typical (median) respondent reporting total savings and investments of £80,000. given the willingness of this section of the population to engage with the model, there is scope for more lenders of similar wealth to divert some of their financial wealth towards smes. the ons wealth and assets survey 2008–2010 estimates that the median net financial wealth of the richest 10 per cent of the population is £123,200. if just 50 per cent of these were to lend 13 per cent of their financial wealth27
through peer–to–peer platforms, it could facilitate £37 billion in sme lending. given an average loan maturity of three years this would provide £12.3 billion in lending28 to uK
businesses per annum. However, it is worth noting that given the amortising nature of loans the overall net amount of lending would be higher.
the domination of the current user base by quite wealthy lenders is probably due to the newness of the model and those without a lot of financial experience lacking the confidence to participate. However, as this market grows and starts demonstrating returns over a longer period of time the wider public will become more likely to lend through it. there is also the potential for institutional investors such as pension funds or endowments to invest capital though peer–to–peer lending. expanding into these new sources of finance will significantly increase the amount of money that could be lent to businesses through the model.
If just 50 per cent of this 10 percent were to lend 13 per cent
of their financial wealth through Funding Circle this would amount
to £37bn in lending The median investor on
Funding Circle has a financial wealth of £8O,000.
Ten per cent of the UK population have a financial
wealth well exceeding this amount.
Current lenders on Funding Circle predict that at least 13 per cent of their financial
wealth could be lent to business in the future
through P2P.
£12.3bn in lending per annum
With an average loan
maturity of approximately three years this could deliver...
2.4 INTEREsT RATE ANd RIsK RATING ARE THE mOsT ImPORTANT fACTORs fOR LENdERs
in crowdfunding, the motivation of funders varies significantly, depending on the nature of the crowdfunding model. in many cases non–financial motivation is the main driver of an individual’s decision to fund a project or business. this can be due to a number of factors, for example the project may be delivering a social benefit that the funder wishes to support, the project may be developing a product that is of interest or the entrepreneur themselves may be in some way connected to the funder. in their study on investors in crowdfunded projects ordanini et al., (2011)29 conclude that there are three main factors
that can be seen as the motivating factors for investors:
• A feeling of being at least partly responsible for the success of others’ initiatives (desire for patronage).
• striving to be part of a communal social initiative (desire for social participation).
• seeking a payoff from monetary contributions (desire for investment).
van Wingerden and ryan (2011)30 suggest that individuals engage in the activity
of crowdfunding for intrinsic reasons, mimicking a relationship also existing in the neighbouring fields of crowdsourcing. While in many cases, non–financial motives is the main driver behind people’s decision to invest or donate money, where peer–to–peer lending differs from crowdfunding, the results show that financial return is the main motivation behind individuals’ decision to lend money to companies (figure 10).
figure 10: How important are the following factors in your decision to lend money on funding Circle? 100% 90% 80% 70% 60% 50% 40% 30% 10% 20% 0% Inter est r
ate offer ed Security Risk r ating given b
y FC
Busines s model Grea t pr oduct/ servic e Management team The c ompan
y is popular with other lenders
Unimportant Of little importance
Important Neutral Very important
interest rate offered was the stronger motivation for the survey respondents. figure 10 illustrates the results of the survey responses to the question on ‘how different factors influence the decision to lend money’. ninety–five per cent of all surveyed lenders
responded that the interest rate is important or very important. this finding reconfirms that peer–to–peer lenders are mainly interested in financial returns made.
the second most important factor for lenders, was the security offered by the company (88 per cent). not surprisingly, lenders want to feel that their money is secure. this is also reflected by the importance of the risk rating which is given by the funding circle, which is ranked third by the survey respondents (80 per cent).
characteristics associated with the product or service offered by the company, its business model and the management team are important to only half of the surveyed lenders. this is obviously linked to the large volume of small transactions associated with the peer–to– peer lending model, as lenders look to attain significant levels of diversification across a portfolio of loan parts.
one may argue that the decision of lenders to invest may be influenced by the popularity of the firm with other investors. in the case of peer–to–peer lending however, it appears that the popularity of the company amongst other lenders is important or very important to only one–quarter of the surveyed lenders. Potential lenders are generally not influenced by the popularity of the company with other lenders except indirectly where the bidding process drives down the interest on popular loans.
figure 11: How important are the following factors in your decision to lend money to a particular company? 100% 90% 80% 70% 60% 50% 40% 30% 10% 20% 0% Financial tr ack rec ord Cus tomer and mark et pot ential Personal e xpertise
in the indus try tha t the c ompan y oper ates
Region in which the compan
y is based
Personal kno wledge of the c ompan y Family r elationship
or friendship with amember of the compan
y
Unimportant Of little importance
Important Neutral Very important
figure 11 shows that 81 per cent of survey respondents consider the financial track record of the company as an important or very important factor. similarly to the previous figure, customer and market potential is not of great importance to half of the survey responders. iyer et al., 2009 suggests that the peer–to–peer markets may have participants who are skilled at judging particular aspects of the borrower that banks are unable to gauge, for example, a lender who works in the sector where the borrower proposes an entrepreneurial business idea may better assess the viability of the proposal. in the business angels31
community, personal expertise in the industry the company operates is of great important to business angels. However, as figure 11 shows, only 21 per cent of surveyed peer–to–peer lenders consider personal expertise as an important factor in their decision to lend money to a company. other factors such as ‘region in which the company is based’, ‘personal knowledge of the company’ and ‘family relationship’ are by and large irrelevant to the vast majority of the surveyed lenders.
3 BORROwERs TENd TO BE EsTABLIsHEd
BusINEssEs, ExPORTERs ANd sEEKING
fINANCE fOR wORKING CAPITAL OR
ExPANsION
this section of the report examines the characteristics of companies that borrowed money through the funding circle marketplace or are preparing to do so. eighty–nine companies took part in the survey, all of whom are members of funding circle and 57 of whom have already received a loan.
table 4: Characteristics of the companies
table 4 shows that borrowers are established businesses with an average age of 11 years and a median of eight. surveyed companies’ turnover on average is in addition such companies with £906,000 with a median of £400,000. the companies have raised an average of £222,235 of external finance in their lifetime (£50,000 the median value). surveyed companies that received a loan through funding circle, employed on average 11 people at the time of applying for the loan, significantly more than the average of three for the entire sme population.32 At the time of the survey, such companies employed on
average 13 people, an average increase in employment of 27 per cent since receiving finance.
variable Obs mean median min max
Year of company 78 2001 2004 1970 2011
incorporation
How many members of 55 11 6 0 100
staff did you employ at the time of applying for the loan?
How many members of 55 13 8 0 150
staff do you employ now?
Increase employment (actual) 57 1.93 1 –4 50
Growth in of employment 53 27 14 –50 300
increase (%)
what is your company’s 69 905,557 400,000 300 10m
turnover (last available)? (£)
How much external finance 82 222,345 50,000 0 5000000
have you raised in the lifetime of the firm? (£)
figure 12: Businesses’ export activity
As figure 12 indicates 42 per cent of the companies surveyed export their products and services. this is considerably greater than the proportion of the overall sme population that export, just 23 per cent.33
figure 13: The main reason(s) for raising external capital
figure 13 shows that 36 per cent of companies raised external capital for expansion purposes and a similar proportion of them (35 per cent) for working capital. Around one– fifth of them raised the capital for asset purchases while just 8 per cent for r&d–related expenses.
Yes No
42% 58%
Does your business export its product or service?
Working capital Expansion Asset purchase R&D
8%
35%
36% 21%
businesses came from a wide range of sectors with ‘Professional and business
support’ featuring the most, followed by ‘manufacturing and engineering’, and ‘it and telecommunications’.
figure 14: Companies’ regional distribution
North West England Northern
Ireland
Scotland
South West England
Wales
West Midlands
Yorkshire and the Humber
East Midlands
East of England
London
South East England North
East England
less than 10% Percentage of sample
10 - 20% more than 20%
A large proportion of the borrowers are also concentrated in london (28 per cent) and the south east (12 per cent). this broadly reflects the location spread of the general business population in the uK, as cumulatively, london and the south east are home to 34 per cent of all uK businesses.34
3.1 BORROwERs RECEIvE fuNds fROm A LARGE NumBER Of LENdERs
companies in the sample borrowed on average £35,000. However, there is a lot of variation across amounts raised, with the minimum amount being £5,000 and the maximum
£75,000. over 50 per cent of the companies raised less than £30,000. the companies in the sample borrowed less than the average for all businesses on funding circle which is about £50,000.
table 5: Business loan characteristics
figure 15: Average amount of loans raised
40%
30%
20%
10%
0%
100000 80000
0 20000 40000 60000
What is the amount that you raised through Funding Circle in total (£)? Percentage
variable Obs mean min max
Loan amount received (£) 57 35,078 5000 75000
Number of lenders 56 418 72 872
monthly payment (£) 57 1295.81 189.1 4372.96
Interest rate (%) 56 8.02 6.53 10
max interest accepted (%) 57 8.49 6.7 10.6
min interest accepted (%) 57 5.50 4 8.8
the average number of people that lent money to each company is 418. As figure 16 indicates, the majority of companies raised money from 200–600 people
figure 16: Number of lenders to each company
25%
20%
15%
10%
5%
0%
800
0 200 400 600
Percentage
Interest rate
the average interest rate charged to the sampled companies was 8.02 per cent.35 this is
slightly lower than the overall average interest rate on the site (which currently stands at 8.7 per cent, excluding fees).36 the minimum interest accepted was 4 per cent and the
maximum 10.6 per cent. funding circle’s main competitors are high street banks which can offer similar interest rates to companies.37
Risks and defaults rate
As explained earlier, all businesses are credit checked before being allowed on to funding circle’s marketplace and each loan is assigned a credit risk band based on the businesses’ credit score. following are the risk bands for the surveyed sample of businesses. these broadly correspond to the population of business loans that have been financed through funding circle. All information on the performance of funding circles’ loan book is available on their website.
30% 21%
32%
17% 12%
31% 33%
24%
Loans originated – Study sample Loans originated – FC total to date
A+ (Very low risk) A (Low risk) B (Below average risk) C (Average risk) Funding Circle risk rating
figure 17: Companies’ risk rating
Half of the companies in our sample are rated as A+ (very low risk) or A (low risk) and only 17 per cent of the surveyed sample received c (average risk). the sample slightly over represents low–risk businesses compared to the funding circle population.
figure 18: Number of loans by risk rating
1600 1400 1200 2000 1800
1000 800 600 400 200 0
Loans origina
ted Loans
outs
tanding On time
A+ (Very low risk) A (Low risk) B (Below average risk) C (Average risk) Funding Circle risk rating
figure 18 provides some statistics for all loans facilitated by the funding circle marketplace; 1,79338 loans have been originated so far and 95 per cent of them are
outstanding (funding circle started operation in 2010 and as a result most loans are not yet matured). forty–three per cent of originated loans were made to companies with low (A) or very low (A+) risk.
based on the data provided by funding circle (accessible to all registered members), a small proportion of loans are late (1.8 per cent of loans are late for a period less than 30 days and 1.2 per cent for a period more than 30 days). only 2.3 per cent of loans are described as bad debt while 0.7 per cent as recoveries.39 it is worth noting that looking at
the actual values of the loans (instead of the number of loans) these percentages are lower.
figure 19: Loan repayment and failure rate
120
100
80
60
40
20
0
Fully r epaid
loans La
te <30 da
ys Late
>=30 da
ys Late
>=90 da ys
Rec overies
Bad debt
A+ (Very low risk) A (Low risk) B (Below average risk) C (Average risk) Funding Circle risk rating
the existence of defaults does highlight the necessity for having a diversified portfolio of loans and why such high levels of diversification are seen for some lenders (an average of 67 loans). funding circle calculates that all lenders who have lent to at least 100 businesses with a maxium exposure of 1 per cent per loan have experienced positive returns (as of march 2013). to assist lenders calculate the level of diversification they need, funding circle provides estimates for the percentage of lifetime ‘bad debt’ for businesses in each risk category (table 9).
table 6: Bad debt by risk rating
Proportion that had attained more than one loan Proportion providing personal guarantee
Proportion that had raised money from family and friends
Proportion that had received external finance from another web–based provider Proportion that attempted to secure a bank loan prior to approaching funding Circle Proportion of debt raised in the financial year 2010–2011 this amount represents
11% 89% 31% 3% 60% 70%
table 7: Companies’ borrowing activity
external finance raised through the funding circle represented 70 per cent of all debt raised by the companies in the sample during 2010–2011. As expected’ the majority of businesses had originated just a single loan through the funding circle thus far.
% A+ (very A (Low risk) B (Below C (Average Total low risk) average risk) risk)
Current bad debt % 0.5% 1.6% 2.2% 0.9% 1.4%
Estimated lifetime 1.1% 2.7% 4.1% 5.8% 3.6%
3.2 BORROwERs vALuEd THE sPEEd AT wHICH fuNdING wAs dELIvEREd ANd dO NOT PLAN TO RETuRN TO BANKs fOR fuNdING IN THE fuTuRE
sixty per cent of the companies in the sample attempted to secure a bank loan before approaching funding circle (table 7). those companies were asked to identify the reasons for the bank applications not being completed.
figure 20: Reasons for the bank application not being completed
*respondents could select more than one option
thirty per cent of those companies thought that the process took too long. twenty–six per cent lacked the required collateral, while 22 per cent said attaining bank finance was too expensive. eight per cent of them were rejected because they reached their upper lending limited and only 4 per cent were rejected due to poor credit history. individual responses from companies included: “bank not interested”, “amount too small”,“the bank failed to give any understandable reason”, “bank would not give a decision”, “what was available was not enough to cover what we needed”, “ banks do not like my industry”, “the whole process was complicated”.
others who had not attempted to secure finance from a bank prior to approaching funding circle gave their reasons for not doing so.
35% 30% 25%
20% 15% 10% 5% 0%
Proc ess tak
es
too long
Lack of colla
teral
Too e xpensiv
e
Reached the upper lending limit
Poor cr edit history
figure 21: Reasons for not attempting to secure a loan from a bank
* respondents could select more than one option
forty per cent of companies in the sample did not attempt to secure a loan from the banking sector. thirty–eight per cent of them did not apply for a bank loan because they believed that the process takes too long, 22 per cent found bank loans too expensive, 19 per cent did not like the hidden fees and a similar proportion thought that they would not be successful. other responses included: “do not like the bank’s changing attitude to lending”, “prefer not to expose all activity to my bank”, “personal guarantee would be required but not offered”, “liked the Funding Circle concept”, “unhelpful bank”, “I have access to bank finance; this is additional back–up”.
40%
35%
30%
25%
20%
15%
10%
5%
0%
Proc ess tak
es too long
Too e xpensiv
e
Hidden f ees
I didn't thinkI would be suc
ces sful
figure 22: Benefits and drawbacks of borrowing through funding Circle
* respondents could select more than one option
surveyed companies were asked to identify the main benefits of borrowing money through funding circle. figure 22 illustrates that the two most popular responses were ‘speed of securing finance’ (58 per cent) which is consistent with the earlier finding that some borrowers found that banks processes takes too long, and that funding circle was ‘not my bank’ (54 per cent).
‘dealing with multiple lenders’ is the most commonly identified drawback of sourcing capital from funding circle (with 18 per cent) followed by the ‘making financial details public for funding circle members’ (17 per cent). other responses include: “personal guarantee”, “not much really, the interest rate is probably higher than I could have secured through my bank but the FC process is considerably more straightforward”, “length of repayment term”.
Not my bank
Platform ease of use Speed of securing finance
70 60
20
0 10 30 40 50
Cost Making financial details public for FC members
Dealing with questions from lenders Dealing with multiple lenders that you do not have an ongoing relationship with
What do you think is the main drawback of borrowing through Funding Circle? What do you think is the main benefit of bortowing through Funding Circle?
Other Interest rates
Clarity of terms
Other
58% 54% 36%
34% 29% 6%
18% 17% 15% 14% 13%
figure 23: what were the results of securing finance for your business?
* respondents could select more than one option
not surprisingly, for 74 per cent of the surveyed companies the secured loan resulted in ‘improved cashflow’. the purchase of equipment and increases in employment was also the result of the secured loan for 33 per cent of the surveyed companies. other responses include: “gave our growth a boost”, “increased sales”, “conducted valuable research”, “ability to expend and open two new outlets”, “commercial confidence “, “secured larger premises”, “completed new product development”, “invested in new projects”, “funded an overseas business mission”.
80%
70%
60%
50%
40%
30%
20%
10%
0%
Incr eased
emplo yment Impr
oved cashflo w
Incr eased overseasgrowth Pur
chased equipment
Other
figure 24: future borrowing behaviour
thirty–two per cent of surveyed companies responded that without funding circle it is likely or very likely that they wouldn’t have received the finance they needed while 37 per cent of them did not know. interestingly, 77 per cent of the surveyed companies are likely or very likely to approach funding circle first in the future, if further external finance is needed. even if banks offer a similar facility, only 27 per cent of the surveyed companies said they would approach them first in the future.
100%
70% 80% 90%
60% 50% 40% 30% 20% 10% 0%
How likely are you to approach Funding Circle first
in the future if further external finance is needed?
How likely are you to approach banks first in the future if
further external finance is needed?
If you approach banks first in the
future and are unsuccessful, how
likely are you to then approach Funding Circle?
How likely are you to approach banks before you approach
Funding Circle if banks offer a similar
online facility?
Very likely Likely Unlikely Very unlikely Don't know
How likely is that without Funding Circle you wouldn't
have received external finance?
4 CONCLusION
overall, the study revealed specific characteristics of both peer–to–peer lenders and borrowers. lenders tend to be educated, wealthy individuals and unlike participants in other forms of crowdsourced finance, their decision to lend money through funding circle is mainly driven by the potential for financial gains.
businesses receiving finance through the funding circle are established smes, many of whom are exporters and are in need of capital to either expand or to fund their operations. the primary reason for approaching funding circle over banks seems to be frustration with the drawn–out loan application processes of the latter rather than their inability to access credit from them.
it is still too early to say whether peer–to–peer lending to businesses will be sustainable over time (for example the default rates are still a projection). However, there are several factors that indicate it has the potential to be an important source of funding for uK businesses. first, 77 per cent of the surveyed companies are likely or very likely to approach funding circle first in the future if further external finance is needed and the majority of these would approach funding circle before approaching their bank. even if banks offer a similar facility to funding circle, only 27 per cent of the surveyed companies said they would approach banks first.
from the lenders’ perspective as long as the return (after fees) remains healthy compared to alternatives, such as bank savings rates and investment returns people will keep lending. over 75 per cent of lenders stated their willingness to increase the amount of money that they lend through the funding circle in the next 12 months. rough estimates suggest that up to £12.3 billion could be potentially lent to uK smes through peer–to–peer platforms per annum. it is not clear yet whether the model is more successful in particular industry segments than others.
Although peer–to–peer business lending has facilitated loans in the uK worth around £120 million so far,40 this is still a very small amount relative to the money lent every year by the
banking sector. it is unlikely, particularly in the short or medium term that such platforms would grow to the point of being seen as significant competitors to high street banks. However, such models can be seen as complementary to the existing sources of funds and an important part of the financial architecture in the uK.
5 APPENdIx
5.1 mETHOdOLOGY
funding circle included the survey invitation to its monthly newsletter on June 2012. these individuals and companies have voluntarily registered on the funding circle marketplace. the questionnaire was also sent out via personalised emails to members. in addition to the survey results, funding circle provided financial information for companies that took part in the survey. this data was then matched with the survey responses from the companies. it is important to note that it was not possible to match (at the loan level) the responses from the lenders with those from the borrowers. this is mainly due the fact that lenders lent to several companies and the survey responses from both lenders and lenders are based on their overall activity and not on individual loans. the survey does not capture data at the loan level but at the lenders’ and borrowers’ aggregated level. therefore it is not possible to perform analysis based on individual loans as the unit of analysis (for example, how likely it is that funding circle loans provide lenders with supernormal profits which would have required information on the maturity of each loan, when they were issued, the coupon, and whether they’ve defaulted). finally, aggregated data on loan characteristics have been provided by funding circle (accessible to all registered members).
5.2 ExAmINING THE dRIvERs Of THE AmOuNT LENT BY INdIvIduALs
to understand what may affect the size of the amount that individuals lend to companies, a multivariate regression analysis has been performed. the dependent variable is simply the amount of money invested by each individual.
table 8: Investment practices analysis
82.63*** 75.20*** 78.31*** 78.61*** 78.57*** 77.69*** 77.19*** 76.68*** 79.20*** 73.84*** 73.82*** (6.936) (6.778) (7.042) (7.143) (7.037) (7.032) (7.028) (7.190) (7.528) (7.780) (7.798)
2,521*** 2,326*** 2,234*** 2,329*** 2,395*** 2,428*** 2,611*** 2,649*** 2,782*** 2,815*** 2,780*** (350.4) (351.8) (368.1) (382.6) (380.8) (384.0) (397.5) (403.5) (409.9) (408.9) (415.7)
0.0853*** 0.0812*** 0.0820*** 0.0917*** 0.0841*** 0.0847*** 0.0835*** 0.0927*** 0.0889*** 0.0896*** (0.0280) (0.0289) (0.0291) (0.0286) (0.0287) (0.0287) (0.0289) (0.0291) (0.0290) (0.0291)
139.1 27.25 –3.847 –2.645 –30.57 –27.75 –28.57 –17.50 –12.54 (258.2) (285.4) (296.4) (296.3) (297.8) (302.4) (305.7) (304.7) (306.3)
–287.3 –354.6 –352.6 –303.9 –316.2 –339.5 –298.7 –294.7 (288.2) (285.2) (284.6) (285.4) (289.4) (294.1) (293.6) (294.4)
–2,171 –3,109* –3,098* –3,065* –3,453** –3,324** –3,441**
(1,604) (1,642) (1,649) (1,670) (1,692) (1,689) (1,709)
5,805** 5,926** 5,886** 5,672** 5,766** 5,758**
(2,366) (2,364) (2,381) (2,391) (2,383) (2,388)
–3,833* –3,980* –4,056* –3,694* –3,652*
(2,078) (2,115) (2,153) (2,150) (2,169)
–433.4 –239.9 215.4 373.9
(1,359) (1,408) (1,419) (1,455)
683.7 –179.1 –228.2
(1,435) (1,480) (1,486)
4,839** 4,774**
(1,898) (1,907)
871.9 (1,697) –25,133*** –23,093*** –22,688*** –22,063*** –21,982*** –22,488*** –21,261*** –21,225*** –22,856*** –24,114*** –24,019*** (3,867) (3,850) (3,975) (4,157) (4,141) (4,165) (4,215) (4,303) (4,457) (4,468) (4,504) 481 460 445 435 427 424 423 418 406 403 402 0.326 0.331 0.337 0.336 0.356 0.366 0.371 0.372 0.388 0.398 0.398
Total amount lent Total amount lent Total amount lent Total amount lent Total amount lent Total amount lent Total amount lent Total amount lent Total amount lent Total amount lent Total amount lent Number of companies you have lent money to through fC Total assets invested (log) in alternative assets Amount lent to companies outside fC Years of experience working in smEs Years of experience working in large companies Experience in accessing external capital (binary) Business angel (binary) Investments in Bonds and shares (binary)
Autobid (binary)
Loans bought from the secondary market (binary) Loans sold on the secondary market (binary)
use the Q&A facilities (binary) Constant Observations R–squared standard errors in parentheses *** p<0.01, ** p<0.05, * p<0.1
table 8 column (1) shows regression coefficients for the total amount of money lent through funding circle to the total number of loans made by each individual and the natural log of assets invested to other assets. both coefficients are positive and significant at a 1 per cent level. controlling for the number of companies lent to means that all other coefficients can be interpreted regarding the impact they have on the amount lent per company, rather than the amount lent overall. column (2) presents the same regressors but this time controlling for amounts lent to companies outside funding circle. the results remain positive and significant suggesting a strong and expected relationship between personal wealth and loan size to companies through funding circle.
When controlling for professional experience, column (3) and (4), such coefficients do not significantly change. column (6) shows a negative and significant coefficient for the variable ‘experience in assessing external capital’ (once controlling for whether lenders are business angels) and a positive and significant coefficient for the variable business angel, suggesting that people with experience in accessing external capital make smaller loans compared to those with no such experience. lenders that are also business angels are more likely to make bigger loans than those that are not.
there is also some evidence to suggest that people with investments in bonds and shares are likely to make bigger loans to companies compared with those without (column 7). column (8) suggests that lenders that used the secondary market to sell their loans have made bigger loans to companies compared with those that did not use it. the same does not apply to lenders that use the secondary market to buy loans. this provides some evidence to the argument that some lenders agree to lend money at a competitive interest rate and then sell this loan in the secondary market at a higher interest rate in order to benefit from the difference in the interest.