BRIEFING
P
APER
Spending where it should count
AUTHORS:
DATE:
March 2012
VERSION:
1
WORKSTREAM:
Global trends
DISASTER
RISK REDUCTION
CONTENTS
Introduction 1
Top humanitarian recipients: aid and disaster 3
Financing for disaster risk reduction 10
Disaster risk reduction financing in context 15 The inadaquacy and inequity of disaster risk reduction financing 23 Conclusion: Spending where it should count 30 Postscript: Disaster risk reduction in the context of conflict 31
Data and guides 33
Endnotes and references 35
Acknowledgements 36
INTRODUCTION
The humanitarian system is under considerable strain. Needs are increasing, and commodity prices remain at near-record highs. There is pressure on donors either to reduce their humanitarian expenditures or at the very least, more than before, to justify the value in each dollar spent. This is in a context of mega-disasters on an almost unheard of scale and continual expenditures of vast sums in complex emergencies. There are considerable concerns about whether or not the current trend of year on year increases in humanitarian funding can be sustained.
Disaster risk reduction (DRR) is seen by many as a means not only to reduce this continued pressure on humanitarian expenditures but also to protect development investments made by both the international community and national governments – and, of course, to reduce the effects that disasters have on families, communities and countries.
These effects, and the scale of the damage caused by natural disasters, cannot be underestimated. Over the ten years from 2000 to 2009, more than 2.2 billion people worldwide were affected by 4,484 natural disasters. These disasters killed close to 840,000 people and cost at least US$891 billion in economic damage. In this report we examine the top 40 humanitarian recipient countries in the context of natural disasters and especially with regard to financing to reduce risk. We highlight how prevalent disasters are in these countries, and their particularly significant impact. Beyond this, we examine the current state of funding for DRR and, in the context of those countries most at risk of natural disaster, ask questions about the volume and type of funding, and its equity. Are the right choices being made?
THE BIG NUMBERS
DISASTER RISK REDUCTION
IN THE TOP 40 HUMANITARIAN RECIPIENTS, 2000–2009
Note: All figures are for 2000–2009 except where indicated.
Five countries received more than
US$5 per person in DRR over the decade
Twenty-three countries received less than
US$1 per person in DRR over the decade
Fourteen countries ranked as mortality
risk medium -high to severe received only
US$351.1 million of DRR combined
Fourteen countries collected less than US$100
per person in government revenues in 2010;
only two of these received more than
US$50 million in DRR over the decade
595,783
POPUlATION KIllEDUS$9.3 billion of US$10.1 billion of
humanitarian aid to the top 40 recipients
in 2009;
US$9 out of every US$10
US$363 billion of US$1,229 billion of
development aid to the top 40 humanitarian
recipients;
US$3 out of every US$10
INTERNATIONAl
ASSISTANCE
US$3.7 billion for DRR out of US$363 billion
development aid,
to the top 40 humanitarian
recipients
Therefore 1% of all development aid is DRR;
US$1 out of every US$100 spent on aid is for
reducing disaster risk
Four countries alone account for 75% of all DRR
–
US$2.8 billion of the US$3.7 billion
In 2009,
68% of DRR financing came from
humanitarian funds
INTERNATIONAl
DRR FUNDING
DRR AND EQUITY
DRR IN CONTEXT
IMPACT
US$74 billion
ECONOMIC DAMAGE847.5 million
TOP HUMANITARIAN RECIPIENTS: AID AND DISASTER
The top recipients of humanitarian aidare particularly relevant when it comes to examining risk reduction financing. Firstly, these countries account for the vast bulk of humanitarian expenditure each and every year; it is to them that nine out of every ten humanitarian dollars go annually, and therefore they account for the continually upward pressure on humanitarian financing. Secondly, these are precisely the countries that are susceptible to the risk of natural hazards becoming natural disasters, and where those natural disasters have particularly significant impacts. This suggests that these are the places where the bulk of risk reduction funding should be spent.
HUMANITARIAN EXPENDITURE
IS CONCENTRATED
By 2009 the top 40 recipients accounted for 92% of all humanitarian funding, with a similar figure reported in each of the previous six years. In the earlier years of the decade humanitarian aid was much less concentrated, with the top 40 recipients accounting for 74% in 2000. The top five recipient countries account for a particularly remarkable proportion of humanitarian financing, peaking at nearly 50% in 2003 and 2004. In the past five years this proportion has remained relatively stable at around 40%.
AID PROFILES OF TOP
HUMANITARIAN RECIPIENTS
DIFFER CONSIDERABLY
The major recipient countries of humanitarian assistance are in many ways very different. Some cover millions of square miles in area and have large populations, such as Pakistan and Indonesia. Others are relatively small and landlocked, such as Chad, Burundi and Serbia. Some of the countries have suffered from major single disasters that that have killed tens of thousands of people in a matter of moments, such as Haiti, Pakistan and Iran. Others have suffered long-developing droughts that rarely make the headlines but affect millions of people year on year. Some countries are major commodity producers and have significant government revenues as a result – Angola, Iraq and Algeria are examples – while others are amongst the smallest economies in the world and have the least available government revenues. One feature that almost all the countries share, beyond considerable humanitarian financing, is conflict. Only 6 of the 40 top recipients have not suffered at least one year of conflict during the decade: Democratic People’s Republic of Korea (DPRK), Jordan, Mozambique, Tanzania, Zambia and Zimbabwe.0% 10% 20% 30% 40% 50% 60% 70% 80% 90% 100%
2000 2001 2002 2003 2004 2005 2006 2007 2008 2009
% of aid top 40 % of aid top 20 % of aid top 5
FIGURE 1: CONCENTRATION OF HUMANITARIAN AID IN THE TOP 40 RECIPIENTS
Source: Development Initiatives based on OECD DAC and FTS
SAME AID, DIFFERENT
COUNTRIES
India and Mozambique have received US$17.8 billion and US$16.1 billion of aid respectively over the decade, of which US$628 million and US$534 million has been humanitarian financing. These two countries are good examples of how aid flows can be very similar in countries that are contextually very different.
India has the tenth largest economy in the world, with a gross domestic product (GDP) in 2011 of US$1.84 trillion, and a population of more than 1.2 billion. Mozambique is ranked 122nd in terms of GDP with a 2011 figure of US$12.1 billion. It has a population of 23 million. India’s economy is 150 times bigger than Mozambique’s, with a population only 51 times bigger.1 Per person, residents of Mozambique received US$781 in ODA over the decade. Indian residents received only US$16, the lowest of all top humanitarian recipients.
-5 0 5 10 15 20 25 30 35 40 Algeria
Thailand Zambia Guinea Nepal Cote d'Ivôire Georgia Iran Bosnia-Herzegovina Mozambique Syria India Haiti Bangladesh Colombia Sierra Leone Myanmar DPRK Tanzania Eritrea Liberia Chad Burundi Jordan Angola Zimbabwe Sri Lanka Uganda Serbia Kenya Lebanon Indonesia Pakistan Somalia DRC Ethiopia Afghanistan Iraq Palestine/OPT Sudan
US$ BILLION (CONSTANT 2009 PRICES)
Humanitarian aid, 2000-2009
Total development aid, 2000-2009 FIGURE 2
FIGURE 2: AID TO TOP HUMANITARIAN RECIPIENTS, RANKED BY vOLUME OF AID THAT IS HUMANITARIAN2
Some countries – Sudan, Palestine/OPT, Democratic Republic of Congo (DRC), Somalia, Iraq, Ethiopia – have been major recipients of humanitarian assistance for the whole of the decade. Three have become major recipients since 2005: Pakistan, lebanon and Chad. Others have received smaller but regular amounts of assistance on a near-yearly basis, such as Uganda, Zimbabwe, Burundi and Jordan. The relationship between humanitarian aid and overall development aid is not necessarily the same for all the top humanitarian recipients. Some countries have received a much higher proportion of overall aid as humanitarian assistance. For example, humanitarian assistance to Sudan, Somalia and Palestine/OPT makes up a particularly significant proportion of all aid (61%, 68% and 38% respectively), reflecting the seeming intractability of the crises in each of these countries and the challenges of fostering development. Meanwhile, some major humanitarian recipients have received far less aid in the form of humanitarian assistance than for development. This is partly a factor of timing. Countries such as Serbia, Angola and Mozambique were in conflict at the beginning of the decade but the need for humanitarian expenditure has diminished in favour of development aid, with priority being given to supporting reconstruction. Other countries are a particular focus for donors: for example, both Ethiopia and Pakistan border areas of conflict and are of strategic interest. Iraq and Afghanistan stand out; in both cases, conflict with US-led coalitions was followed by massive donor nation involvement in reconstruction and state-building.
In terms of official development assistance (ODA) volumes, the reconstruction of Iraq and Afghanistan has resulted in these countries coming first and second over the decade. The US$33.7 billion and US$28.7 billion that they have received, respectively, accounts for 9.3% of all aid expenditure over the period, equating to just under one
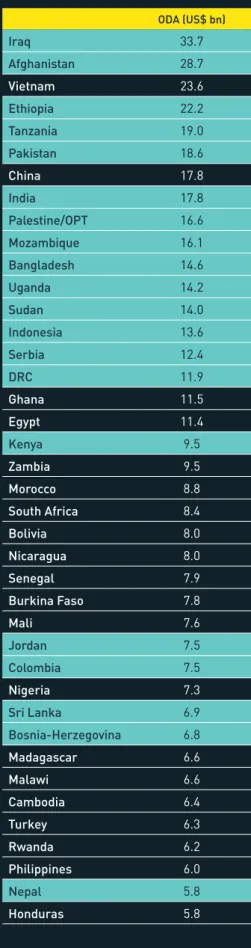
in every ten dollars spent. Ethiopia was fourth with US$22.2 billion and Pakistan was sixth with US$18.6 billion. India, Palestine/OPT and Mozambique also make it into the top ten over the decade. Some of the top recipients of humanitarian assistance have received very little development aid at all. The DPRK and Myanmar are examples, largely for reasons to do with the challenges of delivering development aid in these countries. There is actually significant overlap in the top 20 countries of the two aid categories, with 15 of the top recipients of humanitarian assistance also in the top 20 for ODA. Yet this is not the case for the next 20 highest recipients of ODA; major humanitarian recipients account for only five of these. Over the decade, the top 40 humanitarian recipients accounted for US$363 billion of all ODA, 30% of the total of US$1,229 billion for all countries. They, in effect, received nine out of every ten humanitarian dollars, but only three out of every ten ODA dollars.
This balance of humanitarian and development funding is important. Risk reduction is recognised as a long-term national investment that needs to be mainstreamed through a country’s ministries and activities. Humanitarian funding, with its relatively short-term planning and engagement, is considered unsuitable for supporting these activities, though it should be noted that examples of this happening are not uncommon. Data on the split of DRR financing between humanitarian and development funding is made problematic by reporting issues. However, perhaps worryingly, for 2009, the year for which we have the most robust data, 68% of all DRR funding to the top humanitarian recipients came from humanitarian financing, not development. Given the pressure on humanitarian financing to ‘respond’ to more and larger crises, the question must be asked whether this is sustainable, notwithstanding the structural issues within humanitarian aid.
ODA (US$ bn)
Iraq 33.7 Afghanistan 28.7 vietnam 23.6 Ethiopia 22.2 Tanzania 19.0 Pakistan 18.6 China 17.8 India 17.8 Palestine/OPT 16.6 Mozambique 16.1 Bangladesh 14.6 Uganda 14.2 Sudan 14.0 Indonesia 13.6 Serbia 12.4 DRC 11.9 Ghana 11.5 Egypt 11.4 Kenya 9.5 Zambia 9.5 Morocco 8.8
South Africa 8.4
Bolivia 8.0
Nicaragua 8.0
Senegal 7.9
Burkina Faso 7.8
Mali 7.6
Jordan 7.5
Colombia 7.5
Nigeria 7.3
Sri Lanka 6.9
Bosnia-Herzegovina 6.8 Madagascar 6.6 Malawi 6.6 Cambodia 6.4 Turkey 6.3 Rwanda 6.2 Philippines 6.0 Nepal 5.8 Honduras 5.8
TABLE 1: TOP 40 RECIPIENTS OF ODA, 2000-2009
Note: Figures in constant 2009 prices. Highlighted countries are also amongst the top 40 humanitarian recipients. Source: Development Initiatives based on OECD DAC
MAJOR HUMANITARIAN
RECIPIENT COUNTRIES ARE
DISPROPORTIONATELY AFFECTED
BY DISASTER
Major recipients of humanitarian assistance have accounted for substantial numbers of disasters, with many people affected and killed and substantial economic damage sustained. This is unsurprising since this impact is in many cases precisely why they needed the assistance.
What is clear, however, is that the impact of disasters is significantly higher in such countries when compared with other disaster-affected nations. Over the decade 2000–2009 the top 40 humanitarian recipients accounted for 1,286 disasters, 32.1% of the total. The proportion of people affected was significantly higher than this, at 52.5%, and the proportion of people killed over the ten years was 78.7%. Essentially, although major humanitarian recipient countries suffer three in every ten disasters, they account for five out of every ten people affected and seven out of every ten people killed.
There is no discernible trend for disasters within humanitarian recipient countries except that in general they follow the trend for all affected nations, with a rise in figures from 1997 to 2000. Peak years in terms of numbers of disasters in 2000, 2002 and 2005 were similarly high for humanitarian recipients. The year on year figures, however, reveal even more clearly how natural disasters in crisis-affected countries can have a particularly damaging impact.
TOP 40 HUMANITARIAN
RECIPIENTS ALL COUNTRIES % TOP 40 RECIPIENTS
Total affected 248,506,824 473,460,284 52.5%
Total mortality 536,321 681,313 78.7%
Total number of disasters 1,286 4,012 32.1%
Total estimated damages US$50 billion US$682 billion 7.3%
TABLE 2: DISASTER IMPACT ON THE TOP 40 HUMANITARIAN RECIPIENTS AGAINST TOTAL DISASTER FIGURES, 2000-2009
Note: These figures exclude India inside the top humanitarian recipients and China in ‘all countries’. Source: EMDAT CRED
0 100 200 300 400 500 600
20,000,000 0 40,000,000 60,000,000 80,000,000 100,000,000 120,000,000
1992 1993 1994 1995 1996 1997 1998 1999 2000 2001 2002 2003 2004 2005 2006 2007 2008 2009 2010
NUMBER OF DISASTERS
NUMBER OF AFFECTED
Number of disasters in the top 40 HA recipients (excl. India) Number of disasters outside of the top 40 HA recipients (excl. China)
Total number affected (excl. China and India) Number affected in top 40 HA recipients (excl. India)
FIGURE 3: TOTAL NUMBER OF DISASTERS AND AFFECTED NUMBERS FOR THE TOP 40 HUMANITARIAN RECIPIENTS OvER TIME IN COMPARISON wITH TOTAL FIGURES
Source: EMDAT CRED
The pattern of disaster numbers is remarkably stable, with between 29% and 38% of all disasters occurring in major humanitarian recipients over the period examined. The proportion of people affected is startlingly different, however, and much more erratic (this depends in part on the nature of different kinds of disaster and their impact. See box at base of page 7 on Haiti, “Disasters and their varying impacts”). 2001 was the year with the lowest figure, with fewer than 35% of people affected living in the top 40 humanitarian recipient countries. In four years, however – 1999, 2003, 2007 and 2010 – the proportion was
Source: Development Initiatives based on EMDAT CRED
close to 80%. There is no easily identifiable reason for the peaks in 2003 and 2007. In 1999 a drought in Iran affected 37 million people, 31% of all those affected in that year (excluding India and China). 2010 was remarkable for two mega-disasters of very different kinds, the Pakistan floods and the Haiti earthquake, but it was Pakistan’s flood victims (20 million affected) who accounted for 20% of all people affected, while Haiti’s 3.5 million were only 3.5% of the total for that year.
The proportion of people killed is also startlingly high for humanitarian recipients. In three years – 2004, 2005 and 2008 – the
proportion of people killed living in these countries was more than 90% of the total. In these years, although accounting for just three in every ten disasters, major humanitarian recipients accounted for nine out of every ten deaths, with the 2004 Boxing Day tsumani, the Kashmir earthquake in 2005, and Cyclone Nagris in Myanmar in 2008 partly responsible. Undoubtedly this severity of impact is due to these countries’ relatively poor infrastructure, weaker government capacity for planning and response and their often large populations living on the fringes of habitable space, frequently
on the edges of urban areas. These populations often lack basic facilities such as adequate housing, clean water and sanitation, roads and electricity. This, combined with their relatively limited means of coping with sudden crises, and compounded by weak infrastructure and government capacity, can easily turn a natural event into a disaster.
0% 10% 20% 30% 40% 50% 60% 70% 80% 90% 100%
1999 2000 2001 2002 2003 2004 2005 2006 2007 2008 2009 2010
% of total deaths % of total affected % number of disasters
FIGURE 4: PROPORTIONS OF DISASTERS, PEOPLE AFFECTED AND PEOPLE KILLED, LIvING IN TOP HUMANITARIAN RECIPIENT COUNTRIES, EXCLUDING INDIA AND CHINA
DISASTER
TYPE OCCURRENCE TOTAL DEATHS % OF DEATHS TOTAL AFFECTED % OF AFFECTED TOTAL DAMAGE (US$bn)
NUMBER AFFECTED FOR EACH DEATH
Earthquake 1 222,570 98.3% 3,500,000 92.5% 8 15.7
Epidemic 1 3,790 1.7% 185,012 4.9% n/a 48.8
Flood 3 44 0.0% 22,087 0.6% n/a 502.0
Storm 2 27 0.0% 78,142 2.1% n/a 2,894.1
Total 7 226,431 3,785,241
TABLE 3: HAITI DISASTER IMPACT, 2010
Source: Development Initiatives based on EMDAT CRED
DISASTERS AND THEIR vARYING IMPACTS
Not all disasters have the same impact. In some cases a single disaster can have the same effects as many others. Haiti is a good example. In 2010 seven natural disasters were reported in the country. One of these, the January earthquake, accounted for 98.3% of all deaths and 92.5% of all people affected. (In contrast, the far larger earthquake that hit Chile in 2010, causing US$30 billion in damages, had a much lower death toll of 562 people.)
73%
95% 89%
73% 76% 75%
68% 69% 67%
0% 10% 20% 30% 40% 50% 60% 70% 80% 90% 100%
0 100 200 300 400 500 600 700
2000 2001 2002 2003 2004 2005 2006 2007 2008 2009 2010
% OF AFFECTED
NUMBER OF AFFECTED (MILLIONS)
All other countries affected India affected
China affected
% of total affected China and India
61%
55%
FIGURE 5: POPULATIONS AFFECTED BY NATURAL DISASTER: INDIA, CHINA AND THE REST OF THE wORLD
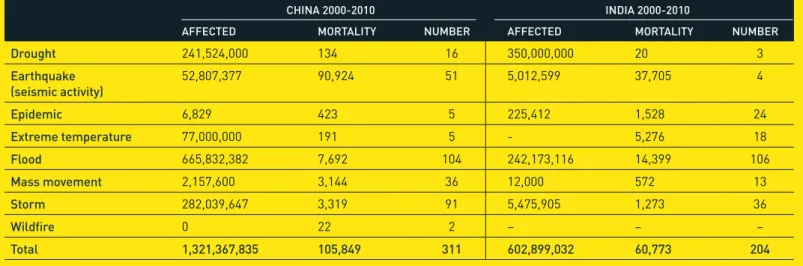
Source: Development Initiatives based on EMDAT CRED India and China are such large countries with huge populations that inclusion within the data on numbers of disasters and in particular numbers of people affected can tend to mask key data and trends within other countries affected by disaster. We have therefore removed both countries from the overall analysis (India from the top 40 humanitarian recipients and China from all other countries). However, the very fact that so many millions of people each and every year are affected in these countries demands attention.
Over the 11-year period from 2000 to 2010, nearly eight out of every ten people affected by a natural disaster have been either Indian or Chinese.
2002 was remarkable, with more than 627 million people affected being either Chinese or Indian – 95% of the total in that single year. China suffered a wave of droughts, floods and storms, which affected more than 285 million people. In India one single disaster, a drought, affected 300 million people, 42% of the total that year worldwide. This drought, which occurred after one of the shortest monsoon seasons on record, affected ten states and 56% of the entire country. Agricultural GDP shrank by 3.1% and overall GDP by 1% as a result.3
Perhaps unsurprisingly, the size of both these countries means that when disasters occur they can affect much higher
numbers of people than elsewhere. Taking 2002 as an example once more, the total number of disasters in China and India was 47 out of a total of 458, equivalent to just over 10%. So while the two countries accounted for more than nine out of every ten people affected in that year, it was with less than one out of every ten disasters. Over the decade the proportion of disasters occurring in India and China has been stable at between 8% and 13% each year – an average of 10% of all disasters over the ten years. This compares with the fact that 78% of all people affected over the decade were Chinese or Indian. The disaster profiles of both countries are in some ways similar, with drought and floods being particularly damaging. Through the decade China has experienced repeated and severe natural disasters, including significant earthquakes and storms. In each of the last four years more than 120 million people in China have been affected by natural disaster, a period in which an average of only 15.7 million Indians were affected.
Total number of disasters all other countries Total number of disasters China and India
% of total disasters China and India
0% 10% 20% 30% 40% 50% 60% 70% 80% 90% 100%
0 100 200 300 400 500 600
2000 2001 2002 2003 2004 2005 2006 2007 2008 2009 2010
NUMBER OF DISASTERS
10% 12% 9% 11% 8% 13% 12% 9% 10% 11% 10%
FIGURE 6: NUMBER OF DISASTERS IN INDIA, CHINA AND THE REST OF THE wORLD AND PROPORTION OF AFFECTED POPULATION
Source: Development Initiatives based on EMDAT CRED
CHINA 2000-2010 INDIA 2000-2010
AFFECTED MORTALITY NUMBER AFFECTED MORTALITY NUMBER
Drought 241,524,000 134 16 350,000,000 20 3
Earthquake (seismic activity)
52,807,377 90,924 51 5,012,599 37,705 4
Epidemic 6,829 423 5 225,412 1,528 24
Extreme temperature 77,000,000 191 5 - 5,276 18
Flood 665,832,382 7,692 104 242,173,116 14,399 106
Mass movement 2,157,600 3,144 36 12,000 572 13
Storm 282,039,647 3,319 91 5,475,905 1,273 36
wildfire 0 22 2 – – –
Total 1,321,367,835 105,849 311 602,899,032 60,773 204
TABLE 4: DISASTER PROFILE OF CHINA AND INDIA
Source: EMDAT CRED
Context is key, however, both to how countries cope with natural hazards and their impact and to the place of international aid, as we discuss later in this report. Perhaps China is more able to cope with natural disasters than India. Despite similarities in population (China’s is the largest in the world and India’s the second) and in size of the country (third and seventh largest respectively), China
is an upper middle-income nation while India is ranked in the lower category of lower middle-income countries. The poverty figures are particularly revealing. According to the Multidimensional Poverty Index (MPI), the countries are ranked first and second in terms of total numbers of people considered to be poor. However, India has more than 600 million poor people, four times the number of China.4
DRR IS A FRACTION OF AID
At first glance, trends in the financing of DRR to these key countries seem positive. Since 2000, DRR investments to the value of US$3.7 billion have been made from all aid to the top recipients of humanitarian assistance. Funding grew from US$121 million in 2000 to a peak of US$809 million in 2007, before falling back to US$338 million in 2009. Yet at the same time this is a very small percentage of overall development aid spent in these same countries. Only in two years, 2006 and 2007, has DRR expenditure ever reached above 2% of ODA, and over the entire decade it was only 1%. Essentially less than one dollar for every 100 has been spent on reducing disaster risk. Given that the economic damages for top humanitarian recipients have been estimated as at least US$74 billion, this figure of US$3.7 billion seems insubstantial.
There is further concern, looking beyond overall annual volumes of DRR financing, as those volumes hide not just variability but also very high concentrations of investments in just a few contexts. The aid trends over the decade do not show a sudden increase in expenditures from 2005 through to 2007, such as may be influenced by the lessons learned after the Indian Ocean tsunami of 2004. There is
121 176 152
205 184 357
756 809 591 338 0.0% 1.0% 2.0% 3.0% 4.0% 5.0% 0 100 200 300 400 500 600 700 800 900
2000 2001 2002 2003 2004 2005 2006 2007 2008 2009
US$ MILLION (CONSTANT 2009 PRICES)
Total DRR in ODA, top 40 HA recipients % of ODA as DRR
FIGURE 7: DISASTER RISK REDUCTION EXPENDITURE IN TOP HUMANITARIAN RECIPIENTS
Source: Development Initaitives based on OECD DAC
FINANCING FOR DISASTER RISK REDUCTION
no sudden general increase in the amount of funding going to countries in need. Rather, the increases are much more about single large projects that dominate overall spending.
In 2005, 63% of all DRR funding to top humanitarian recipients was for just two projects: US$116 million (32%) for a single World Bank reconstruction programme in Pakistan that focused on seismic-resistant house construction and a US$110 million (31%) project, also by the World Bank as part of its Gujarat recovery programme, that focused on “sustainable disaster management capacity”. In 2006, 71% (US$539 million) of all DRR funding for the top 40 humanitarian recipients was made up of two World Bank projects for Pakistan, one that linked DRR to reconstruction and another that mainstreamed DRR across multi-sectoral activities. In the following year, a single contribution from Japan of US$244 million to Indonesia to support its disaster management policy implementation accounted for 30% of funding to the top humanitarian recipients. The drops in funding for 2008 and 2009 are therefore much less about changes in donor priorities and more about the lack of single large projects for single recipient countries in those years.
THE SEMANTICS OF DRR,
PREPAREDNESS AND THE
DATA CONNECTIONS
The semantics of DRR are somewhat intimidating, with complex
interconnected terms made more complicated by the loose use of those terms. This confusion is also reflected in the data available.
The use of “DRR” in this report is taken from UN International Strategy for Disaster Reduction (UNISDR) terminology: “systematic efforts to analyse and manage the causal factors of disasters”. As there is no DRR code within the Organisation for Economic Co-operation and Development (OECD)’s Development Assistance Committee (DAC) database, a forensic method has been used to pull out investments made in reducing risk. This research has been particularly generous since many projects may actually include DRR as an element, perhaps as something cutting across other sectors; we have, without further information, added the entirety of this to our data. See methodology section for details.
For the purposes of this report we have used preparedness to mean “disaster preparedness and prevention”
(DPP), a humanitarian code that contains mostly activities designed as preparedness to respond to disasters.
A further complication, however, is that the available data does not show us the duration of projects. This is particularly significant in the case of longer-term loans and grants, such as those made by the World Bank, where a single project appearing in the available data as a DRR investment in a single year is actually a multi-year project. With this detailed information at hand (and it is not currently available in an easy-to-use form), we could expect a much smoother transition of DRR from 2006 through to 2009. Through the decade, the number of countries actually funded for DRR has grown. In 2000 there were 13 countries; this grew to 39 countries by 2009, with Iran the only top humanitarian recipient not to receive DRR financing in that year. There was a considerable jump from 18 to 28 countries from 2003 to 2004, and levels continued to rise for much of the rest of the decade. There is evidence to suggest that this sudden increase was less to do with changing donor priorities, however, and more to do with the introduction of the “disaster preparedness and prevention” code as part of humanitarian reporting within the OECD DAC database. TOP HUMANITARIAN RECIPIENTS RECEIvE LESS THAN OTHER COUNTRIES In 2009, the year in which we have investigated DRR expenditures for all countries, we find that the major humanitarian recipients combined received
Source: Development Initiatives based on OECD DAC
NUMBER OF TOP RECIPIENTS RECEIvING DRR
2000 13
2001 16
2002 15
2003 18
2004 28
2005 31
2006 31
2007 29
2008 37
2009 39
TABLE 5: NUMBER OF TOP HUMANITARIAN RECIPIENTS RECEIvING DRR FINANCING
338
162 414
0 100 200 300 400 500 600 700 800 900 1,000
2009
US$ MILLION (CONSTANT 2009 PRICES) Total DRR all other recipients
Bilateral, unspecified
Top 40 humanitarian recipients DRR
338
162 414
0 100 200 300 400 500 600 700 800 900 1,000
2009
US$ MILLION (CONSTANT 2009 PRICES) Total DRR all other recipients
Bilateral, unspecified
Top 40 humanitarian recipients DRR
FIGURE 8: BREAKDOwN OF DRR RECIPIENTS
Source: Development Initiatives based on OECD DAC
less funding than other aid recipients, this despite the fact that they suffer particularly from natural disasters. In 2009, 37% (US$338 million) of DRR went to the top 40 recipients of humanitarian assistance, with US$414 million going to the remaining countries. Notable recipients outside of the top 40 were Vietnam (US$50 million), the Philippines (US$50 million) and China (US$36 million).
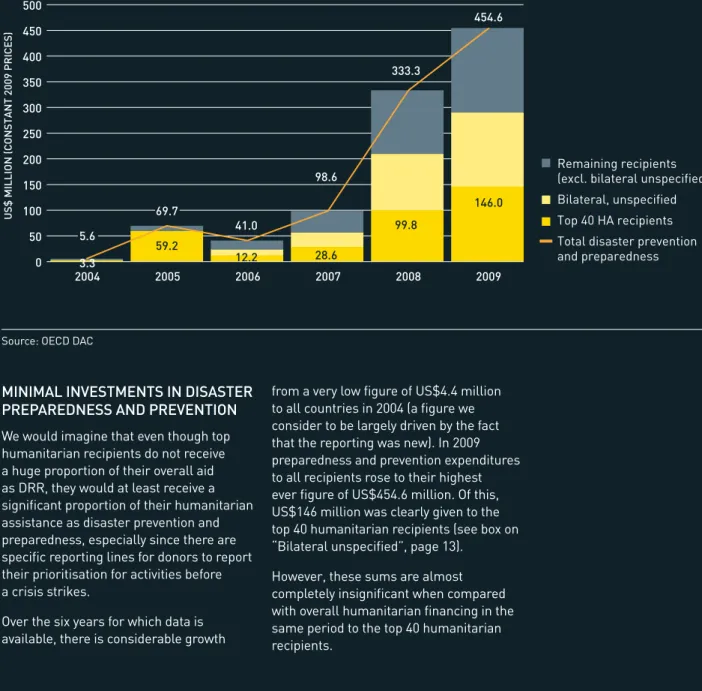
MINIMAL INvESTMENTS IN DISASTER
PREPAREDNESS AND PREvENTION
We would imagine that even though top humanitarian recipients do not receive a huge proportion of their overall aid as DRR, they would at least receive a significant proportion of their humanitarian assistance as disaster prevention and preparedness, especially since there are specific reporting lines for donors to report their prioritisation for activities before a crisis strikes.Over the six years for which data is available, there is considerable growth
from a very low figure of US$4.4 million to all countries in 2004 (a figure we consider to be largely driven by the fact that the reporting was new). In 2009 preparedness and prevention expenditures to all recipients rose to their highest ever figure of US$454.6 million. Of this, US$146 million was clearly given to the top 40 humanitarian recipients (see box on “Bilateral unspecified”, page 13).
However, these sums are almost completely insignificant when compared with overall humanitarian financing in the same period to the top 40 humanitarian recipients.
3.3
59.2
12.2 28.6
99.8
146.0
5.6
69.7
41.0
98.6
333.3
454.6
0 50 100 150 200 250 300 350 400 450 500
2004 2005 2006 2007 2008 2009
US$ MILLION (CONSTANT 2009 PRICES)
Remaining recipients (excl. bilateral unspecified) Bilateral, unspecified Top 40 HA recipients Total disaster prevention and preparedness
FIGURE 9: TOTAL vOLUMES OF DISASTER PREvENTION AND PREPAREDNESS
Source: OECD DAC
YEAR DISASTER PREvENTION AND PREPAREDNESS
ALL OTHER BILATERAL HA TO THE TOP 40 RECIPIENTS
TOTAL BILATERAL HA TO THE TOP 40 HA RECIPIENTS
% HA AS DISASTER PREvENTION AND PREPAREDNESS
2004 3.3 4,501.2 4,504.5 0.1%
2005 59.2 7,057.9 7,117.1 0.8%
2006 12.2 6,365.3 6,377.6 0.2%
2007 28.6 5,734.4 5,763.0 0.5%
2008 99.8 7,796.7 7,896.5 1.3%
2009 146.3 7,939.9 8,086.2 1.8%
Total 349.4 39,395.4 39,744.9 0.9%
TABLE 6: TOP 40 RECIPIENTS’ PREPAREDNESS/PREvENTION EXPENDITURE, 2005-2009
The 2009 figure of US$146.3 million for disaster prevention and preparedness is dwarfed by the US$8.1 billion of overall humanitarian expenditure allocated to the top 40 recipients of humanitarian aid, and is equivalent to just 1.8% of the total. Of the total US$39.7 billion of humanitarian aid spent specifically in these same countries over these five years, only US$349 million was on disaster prevention and preparedness, or 0.9%. For every US$100 spent on response to humanitarian need, therefore, less than 90 cents was spent on preparing for or preventing that need. One would imagine that, despite the poor overall volumes dedicated to disaster prevention and preparedness, the major humanitarian recipients should make up the major proportion of these investments before a crisis occurs. However, this is not the case.
By 2009 humanitarian funding going straight to recipient countries (bilateral funding) reached US$10.7 billion. Of this funding, the top 40 countries made up a
very stable percentage of close to 70% each year. For some of the specific humanitarian reporting lines they received a particularly large proportion; for example, in 2009, 91% (US$2.9 billion) of total food aid of US$3.2 billion went to the top 40. A similarly large proportion of the other line that received considerable volumes of funding, emergency distress/relief, also went to top humanitarian recipients – in 2009, US$3.6 billion of the total US$5.4 billion, equating to 68%. However, while the top 40 made up the largest proportion in four of the five codes, the share of DPP was remarkably low, hovering at only about 30% in each of the last four years. Essentially, more funding for disaster preparedness and prevention is going to countries that are not major humanitarian recipients than to those that are.
0% 10% 20% 30% 40% 50% 60% 70% 80% 90% 100%
2004 2005 2006 2007 2008 2009
Disaster prevention and preparedness Emergency/distress relief
Relief co-ordination; protection and support services
Emergency food aid Reconstruction relief Total all
FIGURE 10: PROPORTION OF BILATERAL HUMANITARIAN SECTOR FUNDING TO TOP 40 HUMANITARIAN RECIPIENTS
Source: OECD DAC
wHAT IS BILATERAL
UNSPECIFIED?
A number of members of the OECD DAC report portions of their bilateral ODA as “bilateral, unspecified”. As a result, much of their aid is not allocated geographically by recipient or region. Bilateral unspecified allocations are made for expenditures on administrative costs, global programmes and unearmarked contributions to implementing partners that cannot be allocated by recipient country. For practical purposes in this report, the bilateral unspecified DRR expenditure indicated in Figure 9 includes, for example, contributions to the UNDP Bureau of Crisis, Prevention and Recovery (BCPR) and the World Bank Global Fund for Disaster Risk Reduction (GFDRR). These organisations then disburse funds to recipient countries, some of which are also top humanitarian recipients.
POOLED FUNDS FOR PREPAREDNESS
AND DRR
Funding mechanisms do exist that finance DRR and preparedness activities, although to significantly varying levels. Humanitarian funds focus more on preparedness. There are three main types of pooled humanitarian fund that finance preparedness: the Central Emergency Response Fund (CERF), common humanitarian funds (CHFs) and emergency response funds (ERFs).5 Despite the global CERF being limited by its emergency response mandate, it has funded some preparedness activities, but only in the last year of operation. In the second half of 2011 it channelled almost US$12 million to preparedness in three of the top 40 recipient countries – Ethiopia, Kenya and Sudan – but this was still a small fraction of the total US$426.2 million spent that year.
The four country-level CHFs in operation continue to attract considerable donor support – US$354 million in 2011. Nevertheless, only 3% of the total channelled by the funds was spent on preparedness. Three of the funds operate in countries that are among the top 40 humanitarian recipients – DRC, Sudan and Somalia. In total these funds disbursed US$8.7 million to preparedness activities in 2011, an increase on 2010 and 2009 figures but still a very modest proportion, accounting for 3.9% of total CHF funding. Despite the emergency response mandate of the ERFs, several have disbursed funds to preparedness projects. In 2011 Haiti’s
ERF spent 11.8% (US$0.8 million) on disaster and cholera preparedness. In 2010 the fund in Kenya spent 20% of its budget on flood preparedness, one of only four projects funded that year. In 2009 the ERFs in Somalia and Zimbabwe spent 5.9% and 2.9% respectively on preparedness out of the total money allocated in those countries. Unsurprisingly, each ERF is in a top 40 humanitarian recipient country. The World Bank-managed Global Facility for Disaster Reduction and Recovery (GFDRR) is the only operational fund that is solely focused on DRR and carries out both global and country-level projects. Around 70% of its funding comes from humanitarian aid budgets and it has received almost US$200 million since its inception in 2006. Track II of the fund allocates money to 20 priority countries deemed to be most at risk of disasters, plus 11 countries earmarked by donors. Only 8 of these 31 countries are among the top 40 recipient countries. In 2010 the fund allocated a larger proportion to countries that were top 40 recipients, 70% or US$7.2 million. In 2011 it spent a similar amount, US$6.3 million, but this was a substantially lower proportion of overall expenditure that year, only 35% (note these figures do not include GFDRR expenditures that are allocated to more than one country or are regional). The total three-year DRR funding by country to the top humanitarian recipients that we can identify is still only small relative to overall aid flows, just US$15.6 million out of a total of US$33.4 million.
0 2 4 6 8 10 12 14 16 18 20
CERF CHF ERF GFDRR CERF CHF ERF GFDRR CERF CHF ERF GFDRR
2011
2010
2009
Top 40 recipients of humanitarian aid, 2000-2009
All other recipients
US$ MILLION (CURRENT PRICES)
FIGURE 11: MONEY SPENT ON PREPAREDNESS AND DRR FROM FOUR DIFFERENT POOLED FUNDS
FIGURE 12: vOLUMES OF DRR OvER LAST TEN YEARS TO TOP RECIPIENTS OF HUMANITARIAN ASSISTANCE, RANKED BY MORTALITY RISK
Sources: Development Initiatives based on OECD DAC, UNISDR
371.4 4.4 639.4 754.6 19.5 49.8 1.8 1002.3 0.2 15.1 7.9 140.7 64.7 46.9 23.5 3.8 15.9 38.0 1.3 10.2 7.3 1.2 23.0 2.4 53.7 143.4 3.1 1.2 1.9 9.9 110.5 1.5 6.7 2.8 16.5 3.0 1.3 82.8 0.5 4.2
0 200 400 600 800 1,000 1,200 Bangladesh Colombia India Indonesia Myanmar Afghanistan Iran Pakistan Algeria DRC DPRK Ethiopia Haiti Mozambique Nepal Sierra Leone Sudan Uganda Bosnia-Herzegovina Burundi Chad Cote d'Ivôire Georgia Guinea Iraq Kenya Lebanon Liberia Serbia Somalia Sri Lanka Syria Tanzania Thailand Zimbabwe Angola Eritrea Zambia Jordan Palestine/OPT MORTALITY RISK
US$ MILLION (CONSTANT 2009 PRICES)
All DRR within ODA, 2000-2009 Multiple Mortality Risk Class (UNISDR 2009)
0 1 2 3 4 5 6 7 8 9 10
2.50 0.06 3.60 5.50 0.94 0.17 0.12 5.40 0.01 0.13 0.50 0.60 1.30 0.29 0.40 0.10 0.11 0.27 0.02 0.28 0.20 0.06 0.50 0.10 0.16 1.50 0.06 0.04 0.02 0.28 1.60 0.12 0.04 -0.24 0.44 0.07 0.05 0.90 0.01 0.03 % OF OD A THA T IS DRR
DISASTER RISK REDUCTION FINANCING IN CONTEXT
DRR IN THE CONTEXT OF RISK
It is through looking at individual countries that we can begin to understand how adequate or otherwise DRR expenditure has been over the decade, especially when we examine the context, in terms of the different risks faced from natural disaster.
The most obvious point to emerge from the data is the high level of concentration of DRR financing over the decade in just a few recipient countries. The top four recipients by volume (Pakistan, India, Indonesia and Bangladesh) received US$2.8 billion of the total US$3.7 billion received by the entire
top 40 countries, or 75%. This meant that close to eight out of every ten DRR dollars going to the top humanitarian recipients went to just the top four countries. The top ten meanwhile accounted for 91.2%, leaving the other 30 to share the remaining US$325 million.
TOP 10 COUNTRIES
AFFECTED BY DISASTERS NUMBERS AFFECTED (MILLION PEOPLE) NUMBER OF DISASTERS NUMBER OF DEATHS RATIO DISASTERS TO DEATHS ECONOMIC COSTS (US$bn)
China 1,321.4 311 105,849 340 205,654,128
India 602.9 204 60,879 298 25,888,285
Bangladesh 73.2 90 9,696 108 5,884,000
Philippines 52.9 160 10,531 66 2,543,118
Thailand 43.6 57 9,750 171 2,433,613
Pakistan 32.8 74 79,325 1072 17,134,648
Ethiopia 29.2 48 2,926 61 9,400
vietnam 21.8 89 3,754 42 5,759,905
United States 20.7 257 4,357 17 353,414,290
South Africa 15.3 42 708 17 866,305
% of total 90% 27% 25% – 61%
TABLE 7: TOP 10 COUNTRIES AFFECTED BY NATURAL DISASTERS, 2000 –2010
Source: EMDAT CRED
Secondly, funding received varied considerably between countries that are classified as having the same mortality risk. Relatively large amounts were spent in three major risk countries, Bangladesh, India and Indonesia, but two similarly ranked countries, Colombia and Myanmar, received hardly any funding at all. Similarly low levels of funding were received by Afghanistan and Iran, both ranked very high for mortality risk. These low amounts going to high-risk countries seem even more surprising when we see how three countries much further down the rankings (Kenya and Sri lanka ranked medium and Zambia medium-low) have received relatively high levels of funding. Zambia received US$82.8 million of DRR funding over the decade, far more than all other higher-ranked sub-Saharan countries (with the exceptions of Kenya and Ethiopia). DRC, ranked as high for mortality risk and suffering from multiple epidemics, droughts, floods and seismic activity, received only US$15.1 million over the decade.
Even the relatively large amounts going to some of those high-risk countries suddenly seem relatively insignificant when compared with overall ODA levels. The top three countries by proportion of ODA that was used for DRR over the decade (Indonesia, Pakistan and India) received only 5.5%, 5.4% and 3.6% respectively for this purpose. Only 6 of the top 40 countries
received more than 1% of ODA as DRR. Sub-Saharan African countries, which are in many cases affected by a mix of droughts and floods (often compounded by conflict) and where a very large proportion of overall humanitarian spending goes each year, have received particularly low levels. The proportion over the decade for both Somalia and Uganda was 0.3%; for Sudan and DRC it was only 0.1%. There are many countries that have high levels of risk but low levels of funds for tackling risk.
DRR IN THE CONTEXT OF ECONOMY
ALL COUNTRIES CAN BE AFFECTED BY NATURAL DISASTERNatural hazards are not confined to poorer countries or to those without systems or infrastructure and with particularly vulnerable populations. Rich and seemingly well-prepared nations can also be severely affected. The list of top ten countries by number of people affected includes five countries that are not major humanitarian recipients: China, the Philippines, Vietnam, South Africa and the United States. These top ten countries accounted for 27% of all disasters over the decade and 90% of people affected, a percentage largely made up of Indians and Chinese. The US, which ranked ninth over the period in terms of numbers affected, suffered the largest estimated economic impact, at US$353.4 billion.
wHAT ARE THE MORTALITY
RANKINGS?
Mortality risk is taken from the UN Global Assessment report on DRR produced by the United Nations International Strategy for Disaster Reduction (UNISDR), with a rating of ten denoting the most at-risk countries and one the least.
Of the top 40 humanitarian recipients over the decade, five countries are classified as being at major risk (level nine), three as very high (level eight) and two as high (level seven). The risk level of medium (five) applies to the largest number (17) of the top humanitarian recipients.
Japan has the third largest economy in the world and in the past has spent up to 5% of its annual general budget on DRR.Yet even the richest, best-prepared nations in the world cannot completely prevent natural hazards from becoming natural disasters.
Japan has a multi-hazard profile. The country has suffered from regular seismic, flooding and storm disasters in particular, with notable events being the Kobe earthquake in 1995, the worst flooding in
TABLE 8: THE IMPACT OF DISASTERS IN JAPAN
Source: EMDAT CRED
JAPAN DISASTERS TOTAL
2000-2011 RANK
Number of disasters
72 13/201
Number affected 1,991,840 46/201
Number of deaths 21,365 10/201
Economic damages US$288 bn 2/201
Epidemic
269,855
5,400
67,460 73,130 44,000
576,090
20,746 100,792
22,593 410,846
276,427
22,587
64,089 50,270 32,000
15,000 400,000
100,000
0 200,000 300,000 400,000 500,000 600,000 700,000
1995 1996 1997 1998 1999 2000 2001 2002 2003 2004 2005 2006 2007 2008 2009 2010 2011
NUMBER OF AFFECTED
Extreme temperature Storm
Earthquake (seismic activity)
Flood Mass movement
Volcano
Wildfire
Total
1995
2000 SENDAI TSUNAMI
2011
WORST FLOODS IN A CENTURY KOBE
EARTHQUAKE
FIGURE 13: AFFECTED NUMBERS AGAINST DISASTER TYPE, JAPAN
Source: EMDAT CRED
COUNTRY FOCUS: JAPAN, A RICH NATION PRONE TO MAJOR NATURAL DISASTERS
a century in 2000 and of course the hugetsunami in March 2011. It ranks as having the third highest number of disasters of all countries over the years 2000–2011. Its ranking for deaths due to natural disasters would have been only 49th were it not for the 2011 tsunami, which pushed it up to 10th place. The total estimated economic damages (US$288 billion) put Japan only one place behind the US; even without the massive impact of the tsunami, Japan still ranks very high, third in total estimated damages, behind the US and China.
Upper middle-income country Lower middle-income countries (excl. China and India)
Low-income country Least developed country % disasters in low-income and least developed countries
41.6%
50.0% 49.4%
46.0% 42.3% 50.8% 52.3% 48.2% 45.3% 45.9% 44.1%
0% 10% 20% 30% 40% 50% 60% 0 50 100 150 200 250 300 350
2000 2001 2002 2003 2004 2005 2006 2007 2008 2009 2010
NUMBER OF DISASTERS
FIGURE 14: NUMBER OF DISASTERS IN DEvELOPING COUNTRIES
Sources: EMDAT CRED and OECD (income groups are determined by the OECD for 2009 and 2010)
60.5% 49.5% 49.7% 70.6% 62.8% 79.0% 35.8% 72.6% 45.5% 59.1% 55.9% 0% 10% 20% 30% 40% 50% 60% 70% 80% 90% 0 10 20 30 40 50 60 70 80
2000 2001 2002 2003 2004 2005 2006 2007 2008 2009 2010
NUMBER OF AFFECTED (MILLIONS)
Upper middle-income countries Lower middle-income countries (excl. China and India)
Low-income countries Least developed countries % affected in low-income and least developed countries
FIGURE 15: POPULATION IN DEvELOPING COUNTRIES AFFECTED BY NATURAL DISASTERS
Sources: EMDAT CRED and OECD (income groups are determined by the OECD for 2009 and 2010) POOREST COUNTRIES SUFFER
FROM HIGHER PROPORTIONS OF AFFECTED PEOPLE
The poorer a country is, the more significant the impact of natural disaster. Over the 11 years from 2000 to 2010, the proportion of natural disasters in developing countries occurring in those with the lowest incomes (low-income and least developed countries) has been relatively constant at 40–50%.
However, the proportion of people affected in these same two poorest country categories was higher in all but two of the 11 years. In some years, such as 2003, 2005 and 2007, the proportion of people affected was 25% higher than the proportion of disasters.
It is therefore not just major humanitarian recipients that are disproportionately affected by natural disaster, but also poor countries in general. Unsurprisingly, there is plenty of crossover between top humanitarian recipients and poorest countries. Most of the top 40 are in the poorest groups, though not all. Of the top 40 humanitarian recipients over the decade, 25 fall into the lowest two categories of income, with 20 classified as least developed and five as low-income. Thirteen are classified as lower middle-income and two are upper middle-middle-income.
CLASSIFICATION OF COUNTRIES BY INCOME GROUP
The OECD classifies countries by income group:
• least developed countries (lDCs) are defined by the UN based on an assessment of economic vulnerability, human resource weakness (nutrition, health, education, adult literacy) and where gross national income (GNI) per capita, based on a three-year average, is under $750. lDCs are a subset of low income countries.
• low-income countries (lICs) are those with a per capita GNI of less than US$935 in 2007.
• lower middle-income countries (lMICs) are those with a per capita GNI of between US$936 and US$3,705 in 2007. • Upper middle-income countries
(UMICs) are those with a per capita GNI of between US$3,706 and US$11,455 in 2007.
YEAR COUNTRY NAME ALL TERMS DAMAGE
(US$m) LOSSES (US$m) TOTAL (US$m)
2010 Haiti Haiti earthquake 2010 Earthquake 4,245.3 3,517.3 7,762.6
2004 Indonesia Indonesia tsunami 2004 Tsunami 3,371.5 1,765.4 5,136.9
2008 Myanmar Cyclone Nargis Myanmar 2008 Hurricane/cyclone/storm 1,773.1 2,328.2 4,101.3
2001 India Gujarat (India) earthquake 2001 Earthquake 2,609.9 802.1 3,412.0
2006 Indonesia Indonesia earthquake 2006 Earthquake 2,637.1 739.3 3,376.4
2005 Pakistan Pakistan earthquake 2005 Earthquake 2,549.6 645.0 3,194.6
2004 Thailand Thailand tsunami 2004 Tsunami 587.3 1,950.0 2,537.3
2007 Bangladesh Cyclone Sidr Bangaldesh 2007 Hurricane/cyclone/storm 1,211.3 540.6 1,752.0
2004 Sri lanka Sri lanka tsunami 2004 Tsunami 1,320.0 357.7 1,677.7
2004 India India tsunami 2004 Tsunami 663.5 748.8 1,412.3
2008 Haiti Hurricane Gustave Haiti Hurricane/cyclone/storm 458.6 435.4 894.0
2009 Indonesia West Java quake 2007 Earthquake 760.8 20.3 781.1
2000 Mozambique Floods Mozambique 2000 Flood 304.6 357.9 662.5
2010 Indonesia Indonesia volcanic eruption 2010 Volcanic eruption 126.5 343.3 469.8
2004 Haiti Hurricane Jeanne Haiti 2004 Hurricane/cyclone/storm 210.3 91.1 301.4
2006 Indonesia Aceh floods 2006 Flood 195.9 30.4 226.2
2007 Indonesia West Sumatra quake 2007 Earthquake 172.9 2.8 175.6
2010 Sri lanka Floods Sri lanka 2010 Flood 23.4 27.2 50.6
Note: Table contains outcomes of post-disaster damage and loss assessments carried out by various international organisations. Source: GFDRR
TABLE 9: THE GLOBAL FACILITY FOR DISASTER REDUCTION AND RECOvERY (GFDRR) GLOBAL DISASTER DAMAGE AND LOSS DATABASE
While the Centre for Research on the Epidemiology of Disasters (CRED) database provides the most comprehensive coverage of disasters, the damage and loss assessment (DalA) methodology assesses their economic impact far more rigorously, though only for major natural disasters. It usually also identifies priorities for recovery.
The United Nations, World Bank and other stakeholders often use a DalA methodology to assess the economic impact of major natural disasters, as well as to identify the needs of recovery. Since 2003 this methodology has been used 16 times by the UN, World Bank and national
partners to gauge the economic impact of disasters in top humanitarian recipients, including five times in Indonesia, after the Haiti earthquake and twice in India. Damage and losses can be significant: for example, Haiti suffered US$7.8 billion in losses due to the January 2010 earthquake, while Cyclone Nargis caused US$4.1 billion of damage in Myanmar. The 2004 Indian Ocean tsunami caused US$10.8 billion of damage and losses across the four countries assessed. The five disasters assessed in Indonesia incurred damages and losses amounting to US$9.4 billion in total.
GOvERNMENT REvENUES AND DRR
Data on national capacity to reduce the risk of natural disasters is at present very limited. Despite the work done through the Hyogo Framework for Action (HFA), there is only partial, piecemeal information available on just a few developingcountries. Government revenues do provide us with a proxy of national capacity, however, and indicate which countries could have finances available to fund DRR. Differences between countries are again evident. Some have significant revenues based on very large economies, such as Indonesia, Iran and India. Some are major commodity producers, while others are at the other end of the scale – such as liberia, Afghanistan and Burundi, each of which features in the top five for aid dependency on a yearly basis. Government revenues range from the US$267.6 billion of India in 2010 to the US$253 million of Sierra leone.
The figures for revenues per person tell a different story than simple volumes. lebanon generates nearly US$2,000 from each of its citizens, followed closely by Bosnia-Herzegovina, Angola and Algeria. Some of the top 40 humanitarian recipients generate very little revenue at all per person. Fourteen countries produced less than US$100 per person in 2010.
On the positive side, growth in government revenue has been remarkably robust, even during the worst of the financial crisis. Of those 14 countries that generated less than US$100 per person in government revenue, only four did not see growth in revenues year on year from 2006 to 2010. Only in 2009 were there marked drops in revenues in many countries, and most of those were major commodity producers – Algeria, Iraq, Sudan and Angola – which suffered due to the sharp dip in prices from 2008 peaks. Thirteen countries suffered no decline at all over the five years.
The relationship between government revenues and mortality risk is revealing. Of those same 14 countries that generated less than US$100 of revenue per person in 2010, two are ranked as major risk (level nine) for mortality, one is ranked as very high (eight) and five are ranked as medium-high (six). All these countries have significant risk of mortality from natural disaster, but have very little revenue available to reduce risk. The level of funding available for DRR is obviously key. It would be expected that the greater the government revenue in general, the less DRR financing would have to come from external sources such as international aid. The picture for DRR funding when compared against government revenues is very mixed, however. We do not see, for example, that those 14 countries with less than US$100 per person in revenue are the ones that have received the bulk of DRR funding over the decade.
In fact, only two of them received over US$100 million in that period (Ethiopia and Bangladesh). The rest received less than US$50 million. Some of these countries, those in sub-Saharan Africa in particular, have received almost no DRR funding at all, despite the risks and their lack of revenue. For example, Sierra leone received just US$3.8 million over the decade, Eritrea US$1.3 million, Côte d’Ivôire US$1.2 million and Guinea US$2.4 million.
COUNTRY 2005
(US$bn) 2006(US$bn) 2007(US$bn) 2008(US$bn) (US$bn)2009 2010(US$bn) MORTALITY RISK GOvT REv PER PERSON 2010 DRR (US$m)
Lebanon 4.5 5.0 5.7 6.9 8.4 8.3 5 1,955 3.1
Bosnia-Herzegovina 4.7 5.6 6.8 8.1 7.3 7.2 5 1,925 1.3
Angola 12.4 21.0 27.7 42.8 23.3 36.0 4 1,896 3.0
Algeria 38.2 50.1 53.2 80.3 50.7 62.3 7 1,760 0.2
Iraq 0.0 33.6 45.0 66.4 44.8 55.3 5 1,757 53.7
Serbia 9.9 11.4 16.4 19.5 16.4 15.0 5 1,523 1.9
Colombia 37.0 42.8 56.5 61.1 61.0 69.7 9 1,505 4.4
Iran 45.7 66.4 87.8 89.3 82.9 97.5 8 1,299 1.8
Thailand 39.6 45.8 52.9 58.0 54.7 65.9 5 968 2.8
Jordan 3.2 4.4 5.0 5.6 5.9 6.0 3 923 0.5
Georgia 1.2 2.0 2.9 3.5 2.9 3.0 5 716 23.0
Syria 7.9 8.5 9.2 10.6 12.9 13.1 5 580 1.5
Indonesia 53.9 72.6 81.9 107.4 87.4 119.1 9 512 754.6
Sri Lanka 3.4 4.4 4.8 5.6 5.5 6.8 5 332 110.5
Sudan 4.2 7.5 9.3 12.4 8.3 10.3 6 239 15.9
India 147.4 174.9 240.6 249.0 226.6 267.6 9 220 639.4
Zambia 1.3 1.8 2.1 2.7 2.0 2.9 4 217 82.8
Haiti 0.6 0.6 0.9 1.0 1.2 1.9 6 191 64.7
Kenya 4.0 4.7 6.0 6.6 6.7 7.8 5 190 143.4
Zimbabwe 0.9 0.5 0.2 0.1 0.9 2.2 5 174 16.5
Chad 0.4 0.9 1.6 2.2 1.1 1.9 5 169 7.3
Pakistan 15.2 18.0 21.5 23.9 23.5 24.8 8 134 1,002.3
DRC 0.8 1.1 1.5 2.1 1.9 2.5 7 115 15.1
Mozambique 0.9 1.1 1.3 1.6 1.8 1.9 6 82 46.9
Liberia 0.1 0.1 0.2 0.2 0.2 0.3 5 80 1.2
Tanzania 1.6 1.8 2.1 3.0 3.4 3.6 5 80 6.7
Guinea 0.4 0.4 0.6 0.7 0.8 0.7 5 70 2.4
Bangladesh 5.6 5.9 6.4 7.2 8.8 11.5 9 70 371.4
Cote d’Ivôire 2.8 3.2 3.8 4.4 4.3 4.5 5 67 1.2
Nepal 0.7 0.7 0.9 1.1 1.3 2.0 6 66 23.5
Uganda 1.1 1.2 1.5 1.8 2.0 2.1 6 62 38.0
Afghanistan 0.0 0.6 0.7 0.8 1.3 1.7 8 60 49.8
Eritrea 0.3 0.3 0.3 0.3 0.2 0.3 4 54 1.3
Ethiopia 1.8 2.2 2.5 3.2 3.9 4.2 6 49 140.7
Myanmar 0.7 1.0 1.3 1.7 1.8 2.5 9 49 19.5
Sierra Leone 0.2 0.2 0.2 0.2 0.2 0.3 6 43 3.8
Burundi 0.2 0.2 0.2 0.2 0.2 0.3 5 34 10.2
More than 20% growth 0 to 20% growth 0 to -10% growth -10 to -20% growth less than -20% growth
TABLE 10: GOvERNMENT REvENUES IN TOP 40 HUMANITARIAN RECIPIENTS
Notes: 1) This table does not include DPRK, Palestine/OPT or Somalia due to lack of data on government resources. 2) Government revenues are made by a tax component and a non-tax one (revenue coming for example from sovereign wealth funds and state-owned enterprises and corporations). They include also fees, fines and mineral and resource rights. Sources: IMF Regional Outlooks (2011), IMF World Economic Outlook (2011), OECD DAC and UNISDR6
% ALLOCATED FROM NATIONAL BUDGET
ALLOCATED FROM OvERSEAS DEvELOPMENT ASSISTANCE FUND (US$m)
ALLOCATED TO HAZARD PROOFING SECTORAL DEvELOPMENT INvESTMENTS (US$m)
ALLOCATED TO STAND ALONE DRR INvESTMENTS (E.G. DRR INSTITUTIONS, RISK ASSESSMENTS, EARLY wARNING SYSTEMS) (US$m)
DISASTER PROOFING POST-DISASTER RECONSTRUCTION (US$m)
Mozambique 5.2% 317.2 538.1 28.2 14.8
Zambia 5% 394.5 1.6 0.1 –
Colombia 0.1% – – 17.0 1.1
Bangladesh 4.5% – 1.5 – –
Pakistan – 3.6 – 10.0 0.6
Sri Lanka 2.6% 102.2 63.8 6.7 67
TABLE 11: REPORTED NATIONAL RESOURCES SET ASIDE FOR DRR BY TOP 40 HUMANITARIAN RECIPIENTS
Source: Indicator 1.2: The Hyogo Framework for Action dedicated and adequate resources available to implement disaster risk reduction plans and activities
at all administrative levels7
TABLE 12: BUDGET FOR INDONESIA’S NATIONAL DISASTER MANAGEMENT PLAN, 2010-2014
Note: Presentation given by Dr. Suprayoga Hadi from the Indonesian Ministry of National Development Planning at a workshop on the Tracking of DRR and Recovery Investment Data with International Aid in 2011; sources of funding include the government, foreign loans, foreign grants and the private sector.
Source: Republic of Indonesia, National Disaster Management Plan, 2010-20148
IN FOCUS: UNDERSTANDING NATIONAL SPENDING ON DRR
Obtaining comparable data from national governments on how much they are investing in DRR is at present considerably challenging. Those governments that have signed up to the Hyogo Framework for Action are supposed to declare the financing they have committed for DRR, as dictated by one of their indicators. However, of the top 40 recipients of humanitarian financing, only a handful have reported funding in 2009–2011. Whether this is a reporting issue or is due to lack of financing is difficult to gauge.
Indonesia, which unlike the other countries above, reported no financial data to the HFA during the three years, has a well-developed DRR programme and a detailed breakdown of finances. Its planned DRR expenditure of US$7.5 billion over five years comes from a variety of sources, both government and private sector, domestic and international.
INDONESIA’S NATIONAL DISASTER MANAGEMENT PLAN BUDGET (US$bn)
Enhancement of regulatory framework and institutional capacity 3.6
Integrated disaster management planning 0.0
Research, education and training 0.0
Capacity building and improvement of people’s and stakeholders’ participation in DRR
0.3
Disaster prevention and mitigation 0.8
Early warning system 0.1
Preparedness 0.9
Emergency response 0.1
Rehabilitation and reconstruction 1.7
INEQUITIES ACROSS SIMILAR
CONTEXTS
Unequal spending across countries is not necessarily indicative of inequity, especially
given the range of countries amongst the top recipients of humanitarian assistance. Further analysis against population figures reveals, however, that considerable inequity does exist.
DRR PER PERSON (AvERAGE 2000-2009 POPULATION)
AvERAGE PROPORTION PEOPLE AFFECTED EACH YEAR
NUMBER OF
DISASTERS MORTALITY RISK
Zambia 7.10 3.6% 21 4
Haiti 6.94 1.2% 40 6
Pakistan 6.14 0.8% 67 8
Sri Lanka 5.68 3.0% 24 5
Georgia 5.13 1.6% 8 5
Kenya 4.04 3.1% 53 5
Indonesia 3.44 0.5% 152 9
Bangladesh 2.45 4.8% 84 9
Mozambique 2.28 4.8% 45 6
Afghanistan 2.05 2.4% 83 8
Iraq 1.92 0.0% 9 5
Ethiopia 1.90 3.9% 45 6
Burundi 1.39 4.3% 31 5
Uganda 1.34 1.0% 37 6
Zimbabwe 1.32 6.8% 21 5
Somalia 1.20 6.7% 40 5
Palestine/OPT 1.14 0.0% 1 2
Nepal 0.87 1.1% 27 6
Lebanon 0.77 0.0% 3 5
Chad 0.74 3.6% 22 5
Sierra Leone 0.74 0.0% 9 6
India 0.57 5.3% 186 9
Sudan 0.42 2.0% 36 6
Myanmar 0.41 0.6% 14 9
Bosnia and Herzegovina
0.34 0.9% 14 5
Liberia 0.34 1.6% 11 5
DPRK 0.34 0.7% 13 6
Eritrea 0.29 3.9% 3 4
Guinea 0.26 0.3% 16 5
DRC 0.26 0.1% 64 7
Serbia 0.19 0.0% 4 5
Angola 0.18 0.6% 35 4
Tanzania 0.17 1.5% 39 5
Colombia 0.10 1.0% 50 9
Jordan 0.09 0.3% 4 3
Syrian Arab Republic 0.08 0.7% 5 5
Côte d’Ivôire 0.06 0.0% 13 5
Thailand 0.04 4.3% 54 5
Iran 0.03 0.3% 53 8
Algeria 0.01 0.1% 36 7
TABLE 13: COMPARISONS BASED ON DRR FUNDING PER PERSON IN TOP 40 HUMANITARIAN RECIPIENTS
Note: Colour-coded cells indicate where those countries are in the top ten for the various elements. Sources: Development Initiatives based on OECD DAC, CRED and ISDR
Again, analysis reveals a concentration of DRR financing within a few countries. Over the decade the top five recipients of DRR per person received as much as the other 35 countries combined. This inequity is particularly worrying given how unrelated it appears to be to various proxies of investment need. Only one of the top ten countries for DRR financing – Bangladesh – made it into the top ten for number of people affected, number of disasters and mortality risk. Meanwhile, only two of the top ten countries ranked by people affected are also top ten recipients of DRR financing. Only five of the top ten ranked by number of disasters and four of the top ten ranked by mortality risk are recipients of DRR financing.
Zimbabwe and Somalia have had a yearly average of 6.8% and 6.9% respectively of their populations affected by natural disasters. Burundi has had 4.3%. Yet none of these countries are in the top ten for DRR funding. Mortality risk would appear to drive more DRR financing, with Pakistan, Indonesia, Bangladesh and Afghanistan, all ranked high-risk, in the top ten. However, Myanmar (ranked as a major mortality risk), and DRC (high) have received very little funding at all, just 41 cents and 26 cents per person respectively over the decade.
There is a question to be asked about whether Zambia, Georgia and Sri lanka are appropriate priorities for funding, given that they do not appear in any of the top ten proxies of need. This may be somewhat misleading, however, given that overall funding levels are so low. The US$7.1 per person spent on DRR per person in Zambia over the decade is hardly an indicator of significant priority being given to the reduction of risk. A question that should be asked, but that appears to have no clear answer at present, is how much is an appropriate level of investment in DRR, and on what should that investment be based?
COUNTRY AvERAGE HA
PER PERSON
Palestine/OPT 1,680.0
Lebanon 431.5
Somalia 296.6
Liberia 269.1
Jordan 229.3
Sudan 223.6
Afghanistan 202.2
Eritrea 192.1
Iraq 180.2
Burundi 157.8
TABLE 14: AvERAGE AMOUNT OF HUMANITARIAN ASSISTANCE PER PERSON, 2000-2009
Sources: OECD DAC and UN population figures (downloaded November 2010)
COUNTRY AvERAGE ODA
PER PERSON
Palestine/OPT 4,466.1
Bosnia and Herzegovina 1,766.5
Jordan 1,367.8
Lebanon 1,301.5
Serbia 1,247.0
Iraq 1,206.0
Afghanistan 1,182.7
Georgia 1,021.9
Liberia 846.1
Zambia 812.1
TABLE 15: AvERAGE AMOUNT OF DEvELOPMENT ASSISTANCE PER PERSON, 2000-2009
Sources: OECD DAC and UN population figures (downloaded November 2010)
HUMANITARIAN INEQUITY DEvELOPMENT AID INEQUITY
GENERAL INEQUITY OF FUNDING Similar inequities exist elsewhere within aid financing. The people of Palestine/OPT received US$1,680 per person over the decade, four times as much as in lebanon, the country ranked second in terms of average humanitarian assistance per person. The disparity is similarly evident for development aid, where the Palestinian population is once more ranked first for financing per person: US$4,466 was received, more than 2.5 times higher than second-placed Bosnia-Herzegovina.
OvERALL FIGURES MASK
INADEQUACIES: BY COUNTRY
The generally inadequate level of investment in DRR, with year on year volumes dominated by single projects, is further revealed through an analysis of funding trends in individual countries. ETHIOPIA DRR PROFILEEthiopia has been in and out of the disaster headlines ever since the famine of the mid-1980s. A massive drought in 2003 affected more than 12 million people and the 2011 famine was a reminder that underlying issues have still not been resolved. More regular though less severe natural disasters include the yearly flooding, which usually affects more than 100,000 people, and volcanic eruptions. The country has 65 volcanoes, 25 of which have 100,000 people living within a 30km radius.9 Mount Erta Ale erupted in 2005, displacing thousands of people.
Funding for Ethiopia was US$140.7 million over the decade (making it the 6th largest recipient), but its large population made it only 12th highest in terms of per person funding. Despite the major droughts, and the country being a major recipient of development aid, the proportion of ODA for DRR has been only 0.6%. The 2007 peak in funding is explained by a World Bank “productive safety net” programme of US$51 million, which was designed to help Ethiopians be more resilient to drought and to respond to it more effectively.
2,000,000 0 4,000,000 6,000,000 8,000,000 10,000,000 12,000,000 14,000,000
0 10 20 30 40 50 60 70
2000 2001 2002 2003 2004 2005 2006 2007 2008 2009
NUMBER OF AFFECTED
US$ MILLION (CONSTANT 2009 PRICES)
DRR spending
Number of affected
2002/2003
2005 DROUGHT, FLOODING 2008/2009DROUGHT
AND MOUNT ERTA ALE ERUPTION MAJOR DROUGHT
FIGURE 16: DRR FUNDING AND NATURAL DISASTERS IN ETHIOPIA
Source: Development Initiatives based on OEDCD DAC and EMDAT CRED
YEAR DROUGHT EPIDEMIC FLOOD vOLCANO
2000 - 7,033 30,000 -
2001 - 8,166 39,500 -
2002 - - 4,000 -
2003 12,600,000 - 110,000 -
2005 2,600,000 964 242,418 9,000
2006 - 32,848 434,050 -
2007 - - 245,386 2,000
2008 6,400,000 3,134 115,595 -
2009 6,200,000 13,652 - -
2010 - 967 80,700 -
2011 4,805,679 - - -
Total 32,605,679 66,764 1,301,649 11,000
Source: EMDAT CRED
TABLE 16: NUMBER OF PEOPLE AFFECTED BY NATURAL DISASTERS IN ETHIOPIA BY DISASTER TYPE
This accounted for 86% of total DRR spending in that year. The 2009 peak was largely made up of a single US$16 million donation from Canada through the World Food Programme (WFP), for a mix of food provision and resilience. A low overall figure therefore is compounded by a DRR financing trend that starts off as non-existent and then varies considerably, but this may be in part due to the availability of data. If the World Bank project was stretched over several years, the variability in DRR trends may be reduced.