Who’s Wired and Who’s
Not: Children’s Access to
and Use of Computer
Technology
Henry Jay Becker
Abstract
As computer technology becomes increasingly prevalent throughout society, concerns have been raised about an emerging “digital divide” between those children who are benefitting and those who are being left behind. This article presents results from new analyses of national survey data describing children’s differential access to computers in school and at home, and the varying conditions that affect how children experience computers. For example, responses from a nationwide survey of teachers suggest that, as of 1998, more than 75% of students had access to computers at school. In fact, those teaching lower-income students reported weekly use of computers more often than those teaching higher-income students. But the nature of children’s experiences using computers in school varied greatly by subject and teacher objectives, and the data suggest that lower-income students use computers more often for repetitive practice, whereas higher-income students use computers more often for more sophisticated, intel-lectually complex applications.
Differences between low-income and high-income children’s access to home comput-ers were far less subtle. Survey data indicate that only about 22% of children in fami-lies with annual incomes of less than $20,000 had access to a home computer, compared to 91% of those in families with annual incomes of more than $75,000. And among children with access, those in low-income families were reported to use the computer less than those in high-income families, perhaps because most low-income families with computers lacked a connection to the Internet. The two most predictive factors of children’s use of home computers were the child’s age and the computer’s capabilities. The author concludes that home access to computers will be a continued area of inequality in American society, and that schools must play a critical role in ensuring equal opportunity for less-advantaged children to access the benefits of the more intellectually powerful uses of computer technology.
I
n nearly every American city, town, and neighborhood, the personal
computer and its electronic offspring have affected young people’s lives.
This new Net generation is evidenced in adolescents playing computer
games or surfing the Web, in young children learning abstractions through
The Future of Children CHILDREN AND COMPUTER TECHNOLOGY Vol. 10 • No. 2 – Fall/Winter 2000
Henry Jay Becker, Ph.D., is professor of education at the University of California, Irvine.
School Computers and
How They Are Used
Next to families, schools are the institutions most responsible for instilling in children the knowledge and skills believed to lead to productive lives and cultural continuity. Schools play a critical role in ensuring equal opportunity for less-advantaged children by
providing access to a wide range of enrich-ing experiences, includenrich-ing exposure to com-puter technology. Indeed, for many children, school provides the greatest opportunity to use computers. According to parents’ estimates from the CPS 1997 sup-plement, more than half of school-age chil-dren use computers at school several times per week—nearly twice the number of
chil-playful computer-centered environments, in precocious hackers busily
investigating and modifying the performance of software, in preteens
par-taking in online chats and electronic mail, and in the many young people
expressing themselves with the help of writing and graphic arts software
tools. Yet other children and adolescents in these same communities have
hardly been affected by computer technology. Just as a great many young
people have been transformed by the electronic culture, others—whether
due to lack of interest, lack of understanding, or lack of opportunity—seem
barely touched.
Such differences have raised concerns about the emergence of a “digital
divide” between the children on one side who are benefitting from
com-puter technology and the children on the other side who are being left
behind. This article examines the extent of children’s access to computers
in schools and at home and describes general patterns of computer
tech-nology presence and use in both settings. Most of the data concerning
school computers presented in this article are from original analyses of
responses to a national survey of more than 4,000 teachers, Teaching,
Learning and Computing: 1998—A National Survey of Schools and Teachers
(TLC-1998).
1The primary data source for children’s home computer use is the
U.S. Census Bureau’s Current Population Survey of U.S. Households (CPS),
1997 and 1998 supplements, which gathered information on home
com-puter and Internet access from parents about more than 23,000 children.
Although a few years old, these surveys remain valuable because of their size
and comprehensiveness.
2Data from all three surveys were analyzed to
examine how demographic factors relate to opportunities to use computers,
and how computer use is affected by conditions in schools and at home—
such as teacher objectives for student computer use and the
technology-related experiences of family members. Finally, key conclusions and
interpretations are offered in the hopes of guiding efforts to shrink the
dig-ital divide and to ensure equal access to the effective use of computers for
all of America’s children.
http://www.futureofchildren.org
dren who use computers that often at home (see Figure 1).
Nevertheless, schools must struggle to keep up with the rapid pace of technologi-cal and cultural change. Survey data indi-cate that, although classroom access to computers is increasing rapidly, the most frequent and creative uses of computer technology are not yet linked to curricula, and many factors influence the use of com-puters in schools. Substantial progress is needed if schools are to play an effective role in ensuring equal opportunity for less-advantaged children to access and use computers.
Access to School Computers
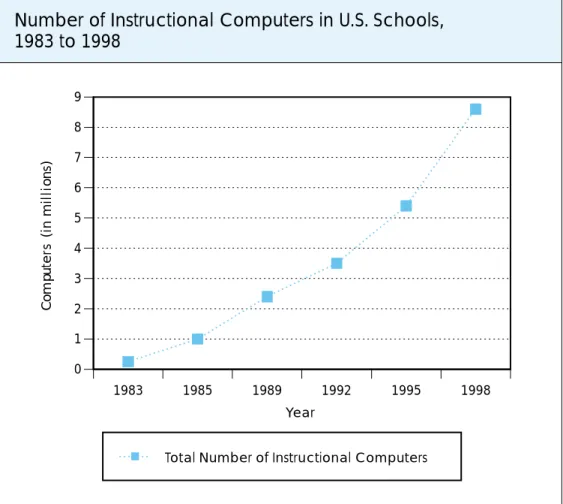
Since the early 1980s, the number of com-puters in American schools has increased steadily, from only 250,000 in 1983 to 8.6 million in 1998 (see Figure 2). In 1983,
almost half of the nation’s schools had no computers at all; by 1998, all schools were equipped with at least one computer, as were nearly half of all classrooms. The typi-cal school in 1985 averaged 40 students for each computer; by 1998, this average had shrunk to 6 or 7 students per computer.3
These numbers indicate that students’ access to school computers has increased significantly. For computers to become an integral tool for learning, however, further improvements are needed in both the quantity and quality of computers available in classrooms.
One obstacle to effective computer use is outdated technology. As schools have been building their computer inventories, tech-nology has been developing at a rapid pace. For many years, while commercial, univer-sity, and home users were migrating to new, more sophisticated models, schools seemed to be increasingly saddled with outdated, stand-alone computers. As of 1992, only 22% of school computers were considered con-temporary for the period.3 A 1997 White
House Panel on Educational Technology concluded that a large share of the school computer inventory was “obsolete and of very limited utility.”4In the mid-1990s,
how-ever, schools began to replace their older machines. By 1998, some 45% of school computers were models such as Pentiums or Power Macintoshes, which were intro-duced within the previous five years.3 In
addition, access to the newest mass-market computer technology—the Internet and the World Wide Web—spread rapidly among schools. The percentage of instructional rooms with one or more Internet connec-tions increased from only 3% in 1994 to 63% in 1999.5
Despite this flurry of technology infra-structure-building, most schools could not yet be described as well-equipped because they did not permit routine integration of computer technology into the learning activ-ities of most classes. As an indication of how well-equipped schools are nationwide, data from the national survey, TLC-1998, were analyzed based on eight benchmarks related to the density and type of computer tech-nologies available in schools (see Table 1). A majority of schools surveyed met only one of the eight benchmarks: connection of at least 50% of their computers to a local area net-work. Averaged across all school levels, only 15% met five or more benchmarks overall. In general, middle and high schools were more likely to meet the benchmarks than were elementary schools.
The analysis of TLC-1998 data also found differences in computer access based on a school’s socioeconomic status (SES). These differences were not reflected in numbers of computers so much as in type of Internet access. Across all SES groups, schools were about equally likely to have at least one computer per four students; however, sig-nificant differences were found with respect to connections to the Internet. As of 1998, low-SES schools were only about half as likely as high-SES schools to have high-speed Internet access, to have at least one com-puter with Internet access for every 12 stu-dents, or to have half of their classrooms connected to the Internet.6
Although few schools at any SES level were meeting most of these benchmarks in 1998, an increasing number of schools are
Only about 1 in 10 secondary teachers of
core academic classes could be considered an
active user of analytic or product-oriented
software in their teaching.
meeting more of the benchmarks each year. Thus, the disadvantages between high-SES and low-high-SES schools can be thought of in terms of the number of years required for lower-SES schools to meet the same benchmarks as the higher-SES schools. From this perspective, schools with the most students from low-income families are about one to two years behind schools with students primarily from average-income families, and another one to two years behind schools with students mostly from high-income families.
Across all SES levels, several more years of progress will be required before most schools acquire a sufficient Internet-connected com-puter infrastructure to enable technology to become an integral learning tool in most classrooms. Meanwhile, what is considered an essential technological infrastructure is constantly changing, so that just as schools meet one set of benchmarks, new ones emerge. As a result, most schools will con-tinue to be technologically challenged well into the future.
Most Frequent and Creative
Uses Not Yet Linked to Curricula
Because schools are so large and composed of so many discrete parts, the amount of technology present in a school building gives only a rough indication of its likely impact on individual students. The same number of computers may be spread among classrooms or concentrated in a computer lab. A computer with Internet access may be in the library or in the principal’s office. A better indicator of students’ exposure to technology is the fraction of students with frequent access to current hardware and software in their different classes. According to the TLC-1998 national survey of teachers, the most frequent and creative uses of com-puters are found in computer classes and other specialized classes, rather than in core academic classes such as English, science, math, and social studies.
Over the course of a school year, most students are exposed to substantial com-puter experience in at least one of their courses. Data from the TLC-1998 survey
indi-Figure 1
0 10 20 30 40 50 60
P
e
rcentage of Children
Home use School use
Nonuser Low Frequency
(1 to 2 days per week)
High Frequency (3 or more days
per week)
Sources: Data analyzed from the U.S. Census Bureau’s Current Population Survey of U.S. Households, October 1997 supple-ment. For a more detailed analysis of these data, see Becker, H.J. Who’s wired and who’s not. Teaching, learning and com-puting: 1998—A national survey of schools and teachers. Irvine, CA: Center for Research on Information Technology and Organizations, University of California, Irvine, 2000. Available online at http://www.crito.uci.edu/TLC.
http://www.futureofchildren.org
cate that, on average, at least one or two of the classes students take each year in middle and high school are “frequent computer-use classes”—that is, classes in which students use computers more than 20 times per year.7
Besides computer classes, in which comput-ers are the subject matter, high school and middle school classes most likely to use com-puters frequently are in applied areas such as business and vocational education.8
Among core academic subjects, English teachers are more likely than others to use computers frequently during class time (see Figure 3). In the TLC-1998 sample, high school students were most likely to use com-puters in core academic subjects when par-ticipating in specialized classes that allow more curricular flexibility, such as those designed specifically for honors students or for students bridging vocational and acade-mic work. Aside from such specialized classes, most core academic courses pro-vided limited opportunity to use computers.
Interestingly, teachers in economically disadvantaged schools are as likely to report that their students use computers on a weekly basis as are teachers in more advan-taged schools. In fact, among teachers in three of the four main academic subjects covered in the TLC-1998 survey, those work-ing in low-SES schools reported more fre-quent computer use than did teachers from any other SES group (see Figure 4).9Only in
science did teachers from the top SES group of schools report more frequent weekly com-puter use by students than teachers from the lowest SES group, and even for that subject, the difference was small. Whether this expo-sure to computer technology is enhancing learning in the same way across the various SES levels, however, depends on how teach-ers have their students use computteach-ers.
In addition to frequency of use, the nature of use—as indicated by the type of software or application—is an important
Figure 2
1983 1985 1989 1992 1995 1998
0 1 2 3 4 5 6 7 8 9
Year
Total Number of Instructional Computers
C
o
mp
u
ter
s (i
n
m
illio
n
s)
Source: Anderson, R., and Ronnkvist, A. The presence of computers in American schools.Teaching, learning and computing: 1998—A national survey of schools and teachers, report #2. Irvine, CA: Center for Research on Information Technology and Organizations, University of California, Irvine, and University of Minnesota, June 1999. Available online at http://www.crito.uci.edu/tlc/html/findings.html.
Number of Instructional Computers in U.S. Schools,
1983 to 1998
consideration in determining how the pres-ence of computers in schools might affect student learning. A wide range of software is now available—from word processing and information retrieval applications to more sophisticated analytic programs for under-standing patterns in data, developing spreadsheet models, creating presentations, and constructing interactive multimedia environments. Although an increasing number of teachers are beginning to incor-porate computer use into the curricula, data from the TLC-1998 survey indicate that chil-dren’s opportunities to experience the more analytic and creative software programs are still most likely found in computer classes, rather than linked to course work in core academic subjects.10
Even in academic classes, however, cur-rent use of software involves more complex computer applications than the basic skill games and computer literacy activities that previously dominated classroom computer use. For example, word processing is the most common computer activity for stu-dents in academic classes. By 1998, not only English, but also science, social studies, and elementary school teachers were more likely to have their students use the computer for word processing than any other type of activ-ity. In the TLC-1998 survey, 60% of all English teachers, and about 40% of both sci-ence and social studies teachers, had their students use computers for word processing
during class time (see Table 2).11 Among
those who made word processing assign-ments, most made such assignments quite frequently—at least 10 times during the year. After word processing, the next most common computer activity linked to the cur-riculum is information acquisition—that is, using CD-ROM reference titles and Web search tools for research. Elementary school-children tend to use the more controlled information bases such as encyclopedias on CD-ROMs, whereas secondary school stu-dents tend to use the Web at least as often as CD-ROMs in subjects such as English, social studies, and, most intensively, science. By 1998, only four years after its initial public dis-tribution, teachers were assigning students work involving use of World Wide Web browser software more often than any other type of software except word processors and CD-ROMs.12However, the greatest use of the
Web by far was in computer education classes. In addition to word processing and infor-mation retrieval, many other computer appli-cations using analytic or product-oriented software could be linked to academic use, but survey results indicate that they are used much less often. For example, some science classes use analytic software such as a “simu-lation modeling program” to study ecologi-cal systems, which enables students to explore how different factors in a particular situation lead to a stable population or to
dis-Elementary Middle High All
Benchmark
School School School Schools
At least 50% of computers connected to a local area network 50% 64% 63% 55% (LAN)
At least 1 computer for every 4 students 10% 29% 33% 18% At least 1 Pentium/Power Mac for every 6 students 7% 14% 14% 10% At least 1 CD-ROM-equipped computer for every 6 students 11% 27% 17% 15% At least 50% of rooms with high-speed Internet access 16% 17% 22% 17% At least 50% of rooms connected to LAN 34% 46% 30% 35% High-speed Internet access somewhere at school 24% 35% 45% 30% At least 1 Internet-accessible computer for every 12 students 24% 39% 41% 30%
Met at least 5 of the 8 benchmarks 12% 21% 23% 15%
Table 1
Technology Access by School Level, 1997–98
Source: Data analyzed from Teaching, learning and computing: 1998—A national survey of schools and teachers. Irvine, CA: Center for Research on Information Technology and Organizations, University of California, Irvine, 1998. See the project’s home page at http://www.crito.uci.edu/TLC.
http://www.futureofchildren.org
equilibrium of various species. Some math classes use spreadsheet programs to explore numerical relationships to help students gain intuitive appreciation for mathematical equations. (See the article by Roschelle and colleagues in this journal issue for more detailed descriptions of these applications.) Relatively few teachers have adopted such approaches in their curricula, however.
Overall, the TLC-1998 data indicate that only 22% of science teachers and 12% of social studies teachers had their students use simulation software even occasionally, and only 13% of math classes used spreadsheets
more than once or twice during the year. Of course, students’ use of electronic technolo-gies such as graphing calculators is quite high in many math classes. But the data show that using general-purpose computers for more sophisticated applications—such as spreadsheet calculations, analysis of large amounts of “real data,” or library research into real-world applications of quantitative procedures—has not yet become part of the curricula in most middle and high school mathematics classrooms.
Similarly, product-oriented software— such as that used for creating presentations
Figure 3
aFrequent-use class is defined as a class in which students used computers more than 20 times during the
school year.
bSeparate figures for these classes were not available at the middle school level.
English Science
Math
Social Studies
Computer EducationBusiness EducationVocational Education
0 10 20 30 40 50 60 70 80 90
P
e
rcentage of Frequent-Use Classes
Middle School Classes High School Classes
Computer , Business
, and
Vocational Education
b
a
Source: Adapted from data in Becker, H.J., Ravitz, J.L., and Wong, Y.T. Teaching and teacher-directed student use of com-puters and software. Teaching, learning and computing: 1998—A national survey of schools and teachers, report #3. Irvine, CA: Center for Research on Information Technology and Organizations, University of California, Irvine, and University of Minnesota, revised December 1999, p. 7. Available online at http:www.crito.uci.edu/tlc/html/findings.html.
Frequent-Use Classes in Middle and High School, by Subject,
1997–98
and multimedia projects—could be linked to academic curricula in situations where teachers have students communicate their understanding of content by demonstrating their work. Applications are available for making and printing brochures, designing presentations for a live audience, or creating multimedia projects incorporating related text, pictures, video, music, voiced commen-tary, and even puzzles or games. In particu-lar, the interactive, “nonlinear” structure of multimedia projects engages class interest by providing group decision points for explor-ing alternative aspects of the topic. Although increasing numbers of teachers have stu-dents prepare computer-assisted
presenta-tions and multimedia documents, the num-bers are still small in every subject and level. Only 11% of English teachers in the TLC-1998 survey had students use relatively simple presentation software, and only 11% of social studies teachers and 8% of science teachers had students even occasionally use multimedia authoring.
As shown in Table 2, it is mostly in elec-tive classes—such as computer, business, and vocational education—that students are pro-vided opportunities to explore the newer, more sophisticated and creative, analytic, and product-oriented software.13 The data
suggest that only about 1 in 10 secondary
Figure 4
Frequent Computer Use in Academic Subjects, by
School-Level Socioeconomic Status Quartile, 1997–98
Note: Frequent computer use was defined as students using computers more than 20 times during the school year. School-level socioeconomic status (SES) quartiles were determined by a factor score that incorporates data on school eligibility for subsidies under the Education for the Disadvantaged program (also known as Chapter 1), principals’ assessments of parents’ type of employment and the percentage of students with lim-ited proficiency in English, and an index characterizing the SES of the neighborhood where the school is located. All schools were then arrayed based on these scores and divided into four comparably sized groups from “low” to “high” SES.
Low SES Low-Middle
SES
High-Middle SES
High SES 0
5 10 15 20 25 30 35 40
English Social Studies
Science Math
P
e
rcentage of Secondar
y
Teacher
s Repor
ting Frequent Use
Source: Data analyzed from Teaching, learning and computing: 1998—A national survey of schools and teachers. Irvine, CA: Center for Research on Information Technology and Organizations, University of California, Irvine, 1998. Available online at http://www.crito.uci.edu/TLC.
http://www
.futur
eofchildr
en.org
THE FUTURE OF CHILDREN
–
F
ALL/WINTER 2000
Early Software Information Analytic Product-Oriented and Applications Retrieval Software Communication Software
Skill World Simulations/ Spread-
Multi-Practice Word Wide Exploratory Sheets/ Graphics media Student
Games Processing CD-ROM Web Environments Database Printing Presentation Authoring E-mail
Elementary School Classes (Grades 4+) 62% 66% 54% 26% 32% 10% 27% 8% 13% 7%
Secondary School Classes
Core academic classes
English 18% 60% 42% 34% 12% 8% 17% 11% 7% 6% Science 11% 41% 36% 35% 22% 17% 16% 8% 8% 8% Math 25% 15% 9% 16% 18% 13% 8% 6% 4% 2% Social Studies 14% 38% 33% 31% 12% 11% 12% 16% 11% 9%
Specialized classes
Computer Education 35% 87% 33% 48% 48% 66% 55% 45% 22% 16%
Business Education 23% 86% 22% 37% 32% 63% 40% 34% 5% 13% Vocational Education 16% 41% 30% 35% 41% 24% 37% 23% 11% 13% Fine Arts 3% 22% 9% 20% 12% 8% 28% 12% 7% 8% Foreign Language 16% 32% 17% 32% 5% 9% 13% 2% 8% 3%
All classes 28% 50% 36% 29% 23% 16% 21% 12% 9% 7%
Note: Bolded blue percentages indicate that a majority of teachers who used that software did so frequently; that is, in more than 10 lessons during the year. Thus, even though only 11% of social stud-ies teachers had students use multimedia authoring software, a majority of that group did so frequently.
Table 2
Source: Data analyzed from Teaching, learning and computing: 1998—A national survey of schools and teachers. Irvine, CA: Center for Research on Information Technology and Organizations, University of California, Irvine, 1998. See the project’s home page at http://www.crito.uci.edu/TLC.
teachers of core academic classes could be considered an active user of analytic or product-oriented software in their teaching. Thus, although most students use a com-puter frequently in at least one of their classes, most often such exposure is not in an academic subject and does not involve the more sophisticated or creative software applications. Expanded use of the more complex and intellectually powerful applica-tions has many challenges to overcome before becoming integral learning tools linked with academic curricula.14
Factors Affecting Use of School
Computers
Students’ opportunities to use computers vary according to the subjects they take, and also within the same subject. Survey data point to six important factors affecting how students experience computers in school: (1) availability of computers in the class-room, (2) teacher computer expertise, (3) teacher philosophy and objectives for com-puter use, (4) teacher collaboration and leadership, (5) teacher judgments of class ability, and (6) school SES level.
Availability of Computers in the Classroom
How frequently a student uses computers at school, and for what, depends greatly on how many computers are available and whether they are located within the classroom or else-where. Especially in high school academic classrooms—with their extensive curricular demands and 50-minute period structure—a shortage of individual computer stations in the classroom has long restricted more fre-quent, systematic, and well-integrated use of technology. The TLC-1998 survey found that only 14% of English teachers, 12% of math teachers, 7% of science teachers, and 2% of social studies teachers taught in classrooms with a ratio of at least one computer for every four students enrolled.15
Further analysis of the TLC-1998 data indicated that, among teachers of the same subject, frequent computer use is closely associated with having computers accessible in their own classroom. For example, among science and social studies teachers who assigned computer work, 53% of those with at least one computer in the classroom for every four students assigned computer work frequently, compared with 21% of those
lim-ited to access in a computer lab. Differences were found to be just as dramatic for math teachers. Across all secondary school acade-mic classes, students with five to eight com-puters in their own classroom were more than twice as likely to use computers fre-quently during class time compared with stu-dents using computer labs—even though the labs had more than three times as many computers.16
Accessibility in the classroom also influ-ences the type of software used. Science and math teachers with at least five computers in the classroom were much more likely to have their students use spreadsheet or data-base programs on a regular basis than were
teachers whose classes used computers in a lab.17Similarly, English and science classes
used presentation and graphical printing software, simulations, Web browsing, and multimedia software more frequently when computers were in the classroom.18 Even
using skill games in secondary academic sub-jects was more common when computers were in the classroom.
In addition, frequent use of the Web depends on having a sufficient number of classroom computers connected to the Internet. Although schools and classrooms have been connecting to the Internet rapidly in the past several years, as of 1998, only 3% of all secondary academic class-rooms had both an Internet connection and four or more computers. The TLC-1998 data confirm that Internet resources such as the Web were twice as likely to be used fre-quently when a classroom had at least four simultaneous Internet connections than when it had a single Internet-connected computer.19
Of course, teachers who are prepared to use computers tend to demand greater access, so the correlation between having classroom access to computers linked to the Internet, and using those computers more
A shortage of individual computer stations
in the classroom has long restricted more
frequent, systematic, and well-integrated
use of technology.
http://www.futureofchildren.org
extensively, is not surprising. However, the computer’s greatest value in academic classes is not generally for concentrated whole-class use on a scheduled basis, but instead as a resource for particular groups of students to find, analyze, or communicate information as the need arises on a more spontaneous basis. Thus, the presence of resources in the classroom is at least a necessary, if not suffi-cient, condition for integrating use of com-puters more effectively into the curricula. Other important conditions, including vari-ous teacher-related factors and the SES level of the school, are discussed below.
Teacher Computer Expertise
How likely students are to experience com-puters in intellectually powerful ways depends greatly on their teacher’s expertise with computers. To use computers effec-tively in their classrooms, teachers must have certain levels of expertise in basic computer
operations. Teachers have had to operate equipment such as movie projectors, slide projectors, and VCRs for decades, but the skills required to successfully operate com-puters—with all their varied functions—are much more complex and far removed from most other competencies required of teach-ers. Data from the TLC-1998 survey indicate that teachers’ expertise with computers ranged from 75% who said they could dis-play a disk’s directory to only 18% who said they could develop a multimedia docu-ment.20And those teachers with the
broad-est expertise in using computers were the most likely to use applications on the leading edge of computer use in their subject. For example, computer-savvy teachers were more likely to use spreadsheets and presen-tation software in science classes, Web browsers in social studies classes, and e-mail in foreign language classes.
Teacher Philosophy and Objectives for Computer Use
Beyond simply acquiring expertise in spe-cific applications, however, teachers must
also value the use of that application for enhancing the learning of important skills and content. Teachers are not likely to inte-grate a software application into the cur-riculum unless it is compatible with their instructional goals. As the data show, par-ticular types of software were used more often when the applications were consistent with the teacher’s philosophy and objec-tives for use of technology.21For example,
the two types of software most commonly used by students under their teachers’ direction were word processing and refer-ence materials on CD-ROM. These applica-tions paralleled the two objectives that teachers most frequently selected as most important for student computer use: “expressing themselves in writing” and “finding out about ideas and information.” Similarly, teachers who assigned the use of presentation software were those who most valued computers for their role in helping students learn how to present information to an audience.
In addition, teachers were three times more likely to have their students use the Internet if they held more constructivist beliefs about teaching in general—that is, they believed in devoting attention to stu-dent interest rather than curriculum cover-age, focusing on critical thinking and real-world applications, and using complex problem solving in small groups to help stu-dents learn—compared with teachers with more traditional beliefs and practices.22 Teacher Collaboration and Leadership
The data suggest further that those teachers oriented toward collaboration with each other and toward taking a leadership role in their profession are also the strongest users of technology. In nearly every subject, teach-ers who were “professionally engaged”— interacting with their peers on instructional and subject-matter issues and mentoring and teaching workshops for other teach-ers—were more likely to have their students use computers regularly during class, and with more types of software, than “private practice” teachers whose sole focus was on their own classroom.
The most significant differences were found in the use of software for communi-cating with others and creating products for an audience—activities closely associated
Teachers’ expertise with computers ranged
from 75% who said they could display a
disk’s directory to only 18% who said they
could develop a multimedia document.
with constructivist beliefs. That is, profes-sionally engaged teachers were much more likely than private practice teachers to use e-mail, multimedia authoring, and presenta-tion software. Differences were even greater when the analysis considered the teacher’s own professional use of and expertise in computer technology, as well as their use of software. The most professionally engaged teachers (that is, the 3% of all teachers who are also sometimes termed “teacher lead-ers”) were 10 times more likely to be highly active computer users than were comparably skilled private practice teachers (40% versus 4%). Teachers in the latter group were more likely to emphasize curriculum coverage and direct instruction of facts and skills and simply did not find computers relevant to their concept of teaching.23
Teacher Judgments of Class Ability
In addition, the data indicate that students’ use of computers varied according to their teachers’ judgments about class ability levels. For example, across all subjects, classes cate-gorized as low achieving used substantially more drill-and-practice exercises, whereas classes categorized as high achieving used more spreadsheet/database and e-mail soft-ware. Among teachers of the same subject, English teachers used word processing soft-ware much more often with high-achieving classes; computer and social studies teachers used presentation software more frequently with high-achieving classes; and social stud-ies teachers used Web browsers more with high-achieving classes.24 In general, the
more salient a type of software was to a given subject, the more likely the teacher was to favor high-achieving classes for frequent use of that software.
The differential opportunity for higher-achieving students to use more intellectually complex software is the result of many fac-tors, among them a teacher’s expectations and beliefs about how different groups of students can use computers successfully.25
Teachers of low-achieving classes may have found it difficult to use complex types of soft-ware with their students. If low-achieving classes are to experience more opportunities to work with complex software applications, teachers will need time and practice to develop methods for using such software successfully; otherwise, low-achieving classes are likely to continue using computers
pri-marily for more narrowly focused drill-and-practice exercises.
School SES Level
Finally, the data show that students’ use of computers in the classroom varied depending on the SES level of the community surround-ing the school.26 In particular, the ways in
which students used computers were quite dif-ferent in schools having mostly students from wealthier families compared with schools having mostly students from poorer families.
As discussed earlier, overall, a greater percentage of teachers reported weekly use of computers in low-SES schools than in high-SES schools. However, the data indicate that computer use in low-SES schools often involved traditional practices and beliefs
about student learning, whereas computer use in high-SES schools often reflected more constructivist and innovative teaching strate-gies. For example, teachers in low-SES schools were more likely than those in high-SES schools to use computers for “remedia-tion of skills” and “mastering skills just taught” and to view computers as valuable for teaching students to work indepen-dently. In contrast, teachers in high-SES schools were more likely to use computers to teach students skills such as written expres-sion, making presentations to an audience, and analyzing information.27
In addition, middle and high school stu-dents in low-SES schools are more likely to experience frequent computer use in dif-ferent subjects than are students in high-SES schools. For example, students in low-SES schools were much more likely than students in high-SES schools to experience frequent computer use in a math class. Math classes account for 24% of all high-frequency computer experiences in the lowest SES-level schools, compared with only 6% of high-frequency experiences in other schools. In contrast, students in high-SES schools were
Computer use in low-SES schools often
in-volved traditional practices and beliefs about
student learning, whereas computer use in
high-SES schools often reflected more
con-structivist and innovative teaching strategies.
http://www.futureofchildren.org
most likely to experience high-frequency computer use in science and computer classes. These courses account for more than 40% of all high-frequency computer experi-ences in high-SES schools, compared with only 12% in low-SES schools.
In sum, schools could play a critical role in helping to ensure equal access to com-puters for less-advantaged children. Although low-SES schools are beginning to catch up to high-SES schools in some bench-marks of access, the more sophisticated and creative uses of computers are not yet well linked with the curricula in core academic
subjects, especially in poorer schools. For use of these more innovative software appli-cations to become more widespread, greater numbers of computers must be accessible in academic subject classrooms—and greater numbers of teachers must be trained in and value the skills and experiences these appli-cations have to offer.
Home Computers and How
They Are Used
Outside of school, children are most likely to access a computer in their homes. A home computer can provide children with a useful tool for helping them with homework and playing games. If connected to the Internet, a home computer can provide children with a vast array of material for both their educa-tion and entertainment, as well as a vehicle for informal “chats” or sending e-mail to friends and cybermates. The effects of chil-dren’s access to computers at home are still being explored (see the article by Subrahmanyam and colleagues in this jour-nal issue). However, the data describing chil-dren’s access to and use of home computers in the United States are clear: the digital divide separating children in socioeconomi-cally advantaged homes from children in socioeconomically disadvantaged homes is mammoth.
Access to Home Computers
Overall, children’s access to home computers and the Internet has been increasing rapidly, according to data from the 1997 and 1998 CPS supplements.2In the 15 months between
these two surveys, the proportion of children living in homes with computers increased by 4.6 percentage points (from 51.9% to 56.5%), and the proportion of children with home access to the Internet increased by 7.5 percentage points (from 26.5% to 34.0%). But some groups of children are much more likely to have access to home computers and the Internet than others. Income, education, and ethnicity are key predictors of access. The data also show that if parents use computers at work, they are much more likely to provide access to broadly functional computers at home. The extent of the disparities in home access for different groups of children is dis-cussed further below.
Key Demographic Predictors of Access
The digital divide in access to home com-puters is illustrated dramatically in the data from the 1998 CPS. According to these data, the largest differences in access to a home computer and the Internet were between children from low-income and high-income families, and between children whose par-ents had limited education and children whose parents had graduate degrees.28 As
illustrated in Figure 5, only about 22% of children living in families with annual incomes under $20,000 had a home com-puter in 1998, compared with 91% of chil-dren living in families with incomes of more than $75,000. Similarly, only about 16% of children living with parents who had not graduated from high school had a home computer, compared with 91% of children with a parent having at least a master’s degree.29 In addition, community effects
exacerbate the already large family-level SES differences in children’s access to comput-ers. Because of residential segregation by SES, children living in low-SES families with-out access to home computers also tend to live in low-SES neighborhoods, where they are less likely than children living in wealth-ier communities to have access through a neighbor or friend.30
The likelihood of children’s home access to a computer and the Internet is also highly related to ethnicity. As shown in Figure 5,
Only about 22% of children in families with
annual incomes under $20,000 had a home
computer in 1998, compared with 91% of
children in families with incomes of more
than $75,000.
African-American and Hispanic children were far less likely to have a computer or Internet access at home than other children. Earlier analyses of CPS data indicate that among households at the same income levels (whether or not children were present), African Americans are about three years behind, and Hispanics are about four years behind, white non-Hispanics in terms of their likelihood of owning home computers.31
Even among families with similar incomes and parent education levels, most African-American and Hispanic children had at least 10% less access to home computers and the Internet than white non-Hispanic or Asian-American children.32Two interpretations of
these findings are plausible. First, computers may be valued differently by the various ethnic groups. Second, economic factors not measured by current income—such as accu-mulated personal wealth—might enter into computer acquisition decisions.
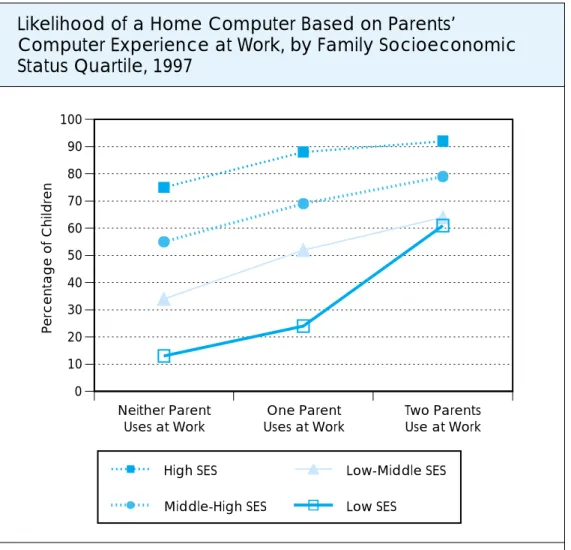
In addition, children’s access to home computers correlated highly with their par-ents’ work-based experience with comput-ers. According to data captured in the 1997 CPS supplement, children with two parents using computers at work are much more likely to have a computer at home than those with no parent using a computer at work (see Figure 6). Of course, much of this difference results from higher income and better-educated parents who are more likely to use a computer at work. However, even within SES groups, parents who use a puter at work are more likely to have a com-puter at home. In fact, work-based comcom-puter use appears to play an especially important role in increasing the likelihood of poorer and less-educated families having a home computer, holding other factors constant.33
In contrast with the differences based on income, education, ethnicity, and parents’ work-based experience, differences in home computer access based on children’s age and gender are quite small. The 1998 CPS data show variations in access between younger children and adolescents to be about 9%34and variations between boys and
girls to be, at most, 1%.35
Quality of Access Also Linked to Demographics
Children’s access to home computers can be described not only by the presence of a
computer, but also by the computer’s func-tionality and the number of computers in the household. Five features of functional-ity are important in providing access to a broad range of applications on a home computer:
A hard disk drive, A CD-ROM drive, A printer,
A modem (or other Internet access device), and
A mouse (or other pointer control device). These features determine what the home computer enables children to do. Without hard disks and CD-ROM storage, for exam-ple, children cannot use information resources such as graphically appealing mul-timedia encyclopedias, complex simulation
environments, or even literacy tools such as a thesaurus and spelling dictionary. Without printers, they cannot have hard copies of their creations for display. Without modems, they cannot access the huge world of infor-mation and communication provided by the Internet.
As of late 1997, CPS data indicate that nearly 60% of children who had a computer of any kind in their home had access to a computer with all five features (about 30% of all children), and that about 25% lived in a multiple-computer household (about 12% of all children). How recently a household acquired a computer made some difference in the likelihood of a home computer having broad functionality. For example, 64% of home computers acquired in the previous year had all five features, whereas this was true of only 45% of those purchased in 1994 or earlier. Clearly, some homes up-grade older computers to meet new opportu-nities for functionality whereas others do not.
When the disparities in computer access are
compounded by the disparities in computer
functionality, the differences between some
ethnic and SES groups are monumental.
http://www.futureofchildren.org
Figure 5
Children’s Access to Home Computers and the Internet, by Family
Income, Education, and Ethnicity, 1998
Note: Calculations were based on the number of households with computers and the Internet as a percentage of all house-holds in each demographic group. Income was annualized based on weekly reports of income summed for both parents, when both were present in the child’s household. Education is the maximum degree or years of school completed by either parent living in the household.
Over $75,000 $60,000–75,000 $40,000–60,000 $20,000–40,000 Under $20,000
Doctorate Master’s Bachelor’s High School No High School (11th–12th grade) No High School (10th grade)
White Non-Hispanic Asian American American Indian Hispanic African American
0 10 20 30 40 50 60 70 80 90 100
Computer Only
Both Computer and Internet
Household Income
Ethnicity Parents' Education
Percentage
Income, education, and ethnicity are strong predictors of whether or not children have access to a home computer, as well as strong predictors of the quality of access. Even among households with computers, children living in families with higher incomes and education were much more likely to have a computer that had all five fea-tures of functionality or to have multiple computers in their homes.36But when the
disparities in computer access are com-pounded by the disparities in computer functionality, the differences between some ethnic and SES groups are monumental. Table 3 lists the groups of children who were most and least likely to have quality access to a home computer from among all families, not just those with computers, according to 1997 CPS data.
Similarly, parents’ experience with com-puters at work is also, once again, linked to quality of access. In households with com-puters, a child’s likelihood of having a broadly functional computer and multiple computers present was significantly greater when two parents used computers at work (see Figure 7).37
The evidence presented here suggests that the digital divide separating socioeco-nomically advantaged and disadvantaged children in their access to home computers is quite large, and may be growing even larger. Even as poor families with little edu-cation obtain basic computers, limited soft-ware, and modems to link to the Internet; wealthier and more educated families obtain multiple computers, sophisticated software,
Figure 6
Note: Family socioeconomic status (SES) quartiles were determined by combining family income and parent education into an SES index, arraying all children based on this index, then dividing them into four compara-bly sized groups from “low” to “high” SES.
Neither Parent Uses at Work
One Parent Uses at Work
Two Parents Use at Work 0
10 20 30 40 50 60 70 80 90 100
High SES Middle-High SES
Low-Middle SES Low SES
P
e
rcentage of Children
Source: Data analyzed from the U.S. Census Bureau’s Current Population Survey of U.S. Households, October 1997 supplement.
Likelihood of a Home Computer Based on Parents’
Computer Experience at Work, by Family Socioeconomic
Status Quartile, 1997
http://www.futureofchildren.org
and high-speed links to the Internet. Moreover, many uses of computers require skills and experience in information man-agement and other technical areas that socioeconomically disadvantaged children are less likely to procure through family, friends, and personal opportunity.
Home Computers Used Most for
Games and Schoolwork
As of 1998, just about the same percentage of homes had computers as did classrooms: 57% of homes with children and adoles-cents had computers,38 and 51% of
4th-through 12th-grade classrooms had com-puters.39 At school, however, a student’s
opportunity to use computers is con-strained by the regimentation of the daily schedule and the number of students shar-ing available resources. In contrast, at home, a child’s opportunity to use a com-puter depends more on the child’s own
interest, prerequisite skills, and available time.40These factors suggest that children
are more likely to use a computer at home than a computer at school. According to CPS data, when a computer was present in the home, nearly 9 of 10 children used it to some extent.41With a computer in slightly
more than half of all children’s homes, that translates to about 45% of school-age children being home computer users. But how often and for what purpose these chil-dren use their home computers is also important.
About 60% of the children in families owning computers were reported to be “reg-ular users,” using the home computer at least three days per week, according to the 1997 CPS data. At the same time, playing games has always been the primary use of home computers for children. Some com-puter games teach school-related skills, but only about half as many parents reported their children’s use of home computers for educational programs as reported use for playing games. Thus, despite claims by most parents that their children’s use of home
computers has some relationship to school, the educational value of the games they play may be fairly modest. After games, however, the next most frequently reported activity on the home computer for children older than age eight was use specifically for school assignments.
Perhaps surprisingly, given the recent growth of and media attention surrounding the Internet, as of 1998, more children used home computers to run stand-alone soft-ware than to go online. Only about 34% of school-age children lived in households with home Internet access. Often, children did not use the Internet even when avail-able—its use limited by cumbersome access and by a child’s age.42However, children’s
use of home computers to access the Internet has been growing rapidly. In the 15 months between the 1997 and 1998 CPS surveys, home use of the Internet among children and adolescents grew from 14% to 23%.43
In addition, several surveys have found that those children who use the Internet go online rather frequently. For example, a Roper-Annenberg survey of parents found that half of the children ages 8 to 17 using the Internet from home were reported to use it about once every three days.44Another
survey of children themselves found even higher rates of access: 60% of Internet users said they used the Internet at least once per week, and 15% said they used it every day.45
Although only a small minority of all 8- to 17-year-olds engage in such frequent home Internet use, the diffusion of this relatively new technology among young people has been quite rapid.46In a global survey
includ-ing 1,000 American households with a con-nection to the Internet, teens ages 13 to 19 were found to use online services signifi-cantly more than adults, even young adults ages 20 to 29.47
For the most part, the types of activities children engage in through the Internet parallel those for computer use in general. In both the CPS and Roper-Annenberg sur-veys, the most commonly reported single home-based Internet activity for teens was “homework” (38% in Internet households; 13% of all children). Similarly, in the CPS study, parents reported that more children used the Internet to do “research for school”
Children’s growing Internet use is oriented
at least as much toward recreational
pursuits as toward formal learning.
than any other activity (20% of all children). However, both studies found that most other Internet activities were recreational in nature—such as e-mail, chat rooms, Web-based games, Web surfing, and listening to music—and that taken together, more time was spent on these predominantly recre-ational activities than on school-related work.48In addition, as illustrated in Figure 8,
children’s use of the Internet for e-mail
increased dramatically between 1997 and 1998, whereas use of the Internet for infor-mation retrieval remained the same or even declined for all but the youngest age group. Thus, the data indicate that children’s grow-ing Internet use is begrow-ing driven more by their personal choice than by teacher direc-tives, and that it is oriented at least as much toward recreational pursuits as toward formal learning.
Percentage of Demographic Group with Quality Access to Home Computers,
As Measured by the Presence of— A Broadly Functional Multiple Computers
Computer in the Home Five demographic groups most likely
to have quality access
Children with a parent who has a 52% 32% professional or doctorate degree
Children in families with incomes 56% 28% of more than $75,000
Children with a parent who has a master’s 50% 23% degree (but none higher)
Children in families with a parent in a 43% 20% managerial or professional occupation
Children with a parent who has a 42% 20% bachelor’s degree (but none higher)
Five demographic groups least likely to have quality access
Hispanic children 13% 5%
African-American children 10% 4%
Children with a parent employed in a 10% 2% blue-collar or service occupation
Children in families with an income of less 7% 3% than $20,000
Children with no parent who graduated 4% 1% from high school
Note: A broadly functional computer is defined as one with the following five features: a hard disk drive, a CD-ROM drive, a printer, a modem (or other Internet access device), and a mouse (or other pointer control device).
Table 3
Children’s Likelihood of Quality Access to a Home Computer, by
Demographic Group, 1997
http://www.futureofchildren.org
Although much of children’s increasing activity on the Internet appears to be for entertainment rather than education, recre-ational uses can help children develop com-petencies that have academic value. For example, playing games may enhance strat-egy and planning skills, and using e-mail may improve verbal skills. Therefore, the question still remains whether or not chil-dren and teens who are heavy users of home computers and the Internet—even if pri-marily for recreational pursuits—are never-theless gaining skills, knowledge, and educational advantages compared with those who lack such access.
Factors Affecting Use of Home
Computers
Among families with home computers, some children and adolescents are more
likely to take advantage of that technology than others. To determine which factors have the largest effects on the frequency and type of children’s use of home computers, data on more than 11,000 children from the 1997 CPS were analyzed. Results of this analysis indicate that the age of the child was the strongest predictor of use. The function-ality of the computer and the experience of family members also were important factors. Family SES level was still found to be signifi-cant, but gender was found to have little effect on children’s use of home computers.49 Age of Child Most Strongly Linked to Use
With few exceptions, the 1997 CPS data indicate that older children used the com-puter more often and with different appli-cations and types of software than did
Figure 7
Note: A broadly functional computer is defined as one with the following five features: a hard disk drive, a CD-ROM drive, a printer, a modem (or other Internet access device), and a mouse (or other pointer control device).
Neither Parent Uses at Work
One Parent Uses at Work
Two Parents Use at Work 0
10 20 30 40 50 60 70
A broadly functional computer Multiple computers in the home
P
e
rcentage of Children
Source: Data analyzed from the U.S. Census Bureau’s Current Population Survey of U.S. Households, October 1997 supplement.
Likelihood of Quality Access Among Families with Home
Computers, Based on Parents’ Computer Experience at
Work, 1997
younger children. Early adolescents (ages 12 to 14) appeared to use home computers somewhat more than all other age groups analyzed, including both older teens (ages 15 and older) and preteens (ages 9 to 11). The youngest children studied (ages 6 to 8) used the computer significantly less often than the older children for most activities except educational programs and games (see Figure 9).50 However, as mentioned
earlier, more recent data indicate that use of the Internet has been increasing rapidly, especially among younger children. Younger children may simply be following the lead of older children—or they may be responding to the growth in professionally organized Web-based activities and Web sites oriented toward younger age groups (see the article by Montgomery in this jour-nal issue).
The Computer’s Features and Family’s Experience Also Important
The functionality of the home computer was the second strongest predictor of chil-dren’s home computer use, followed by the family’s computer experience. Children, especially older teens, used their home com-puters more frequently and with a wider variety of applications when the computers had all of the features used to define full functionality: a hard disk drive, a CD-ROM drive, a printer, a modem, and a mouse or similar pointer control. Internet applica-tions and educational software were most affected by home computer quality because they require the extra features of a modem and CD-ROM.
The computer experience of family members, both inside and outside the home, also affected children’s home com-puter use.51Parents’ work experiences with
computers had the broadest effects across a majority of the measures. Parents’ knowl-edge and experience appeared to help chil-dren ages 9 to 11 in particular with such applications as e-mail and the Web. To a lesser extent, parents’ experience with diverse software appears to help older chil-dren with some of the more complex com-puter applications, such as desktop publishing and spreadsheets. Children also were more likely to use home computers if their older siblings did so and if they used computers themselves at school. Among the youngest children studied, computer
use at school was linked to computer use at home for a variety of basic applications, from educational software to computer games.
SES Level Still Significant
Just as children in families with lower income and less-educated parents were much less likely to have a computer in their home—or, if they had a computer, to have one with many features—such children were also less likely to use their family’s computer in various ways. Data from the 1997 CPS supplement indicate that, even among computer-owning families, children who were socioeconomically more advantaged were more likely to use each of the six applica-tions measured (see Figure 10). SES dispari-ties were greatest in children’s use of home computers for word processing: 50% of the
children from high-SES families with home computers used word processing, compared with only 24% of the children from low-SES families with home computers. If all chil-dren in each SES group are considered— not just those with a computer at home—the differences become enormous: 44% of all high-SES children reported use of home computers for word processing, compared with fewer than 4% of all low-SES children. Such data make clear that children from lower-SES families are far less likely to use computers at home for what many middle-class children experience as common, ordi-nary activities.
In this analysis of factors, however, two of the factors already discussed—home computer quality and parents’ computer use at work—were found to account for a large part of the relationship between SES and children’s use of home computers. That is, the SES differences in children’s use of educational software and e-mail on their home computers were much smaller among families with computers with the same level of functionality and among fam-ilies whose parents have the same level of
Children from lower-SES families are far
less likely to use computers at home for what
many middle-class children experience as
common, ordinary activities.
http://www.futureofchildren.org
work-based computer experience. Still, even when these two factors are held con-stant, higher-SES children used a wider range of applications overall—and word processing in particular—than did lower-SES children.
Gender Found to Have Little Effect
The analysis of 1997 CPS data found similar patterns of home computer use for both boys and girls. Adolescent girls were reported to use computers three or more days per week nearly as often as were adolescent boys (30% versus 31% for ages 15 to 17; and 34% versus 37% for ages 12 to 14).52Only small
differ-ences existed between the percentages of same-age boys and girls using home comput-ers for any given activity. The largest gender differences were in the use of games (75% for boys versus 68% for girls) and word pro-cessing (36% for boys versus 41% for girls).
Boys’ and girls’ reported use of home com-puters for other activities did not vary by more than one or two percentage points.53
In addition, the 1998 CPS data found boys and girls were equally likely to use the Internet from home; types of Internet use again varied only slightly.54 Other surveys
have shown more significant gender differ-ences, however. For example, the 1998 Roper
Youth Report found that girls were more likely
to socialize online through chat rooms, e-mail, and surveys on Web pages, whereas boys were more likely to play online games and download software.45The main issues
regard-ing gender may have less to do with access or categories of software used, however, than with attitudinal and interest dimensions.55
(For further discussion of gender issues, see the article by Subrahmanyam and colleagues in this journal issue.)
Figure 8
G G
G
G
J
J
J
J
H
H
H
H
B
B
B
B
October 1997
December 1998
October 1997
December 1998 0
5 10 15 20 25 30 35 40 45
G Ages 15 and older
J Ages 12 to 14
H Ages 9 to 11
B Ages 6 to 8
Information Searching Electronic Mail
P
e
rcentage
Sources: Data analyzed for children in homes with computers, from the U.S. Census Bureau’s Current Population Survey of U.S. Households, October 1997 and December 1998 supplements.
Changes in Children’s Reported Use of Home Computers
Between 1997 and 1998, by Age
In sum, among families with home com-puters, children use the computer as much for entertainment as for educational purposes. Key factors affecting how often a child uses a home computer—and for what—are the age of the child, the presence of a broadly func-tional computer, experienced family mem-bers, and family SES. Older children from more advantaged backgrounds, and those with a broadly functional computer and
expe-rienced family members, are more likely to use a home computer more often and with a wider variety of software than are younger, poorer children and those without such equip-ment and support. However, whereas dispari-ties in children’s access to home computers persist, it appears that once children have access, some gaps in home computer use— such as between younger and older children and between boys and girls—are closing.
Figure 9
Percentage of Children with Home Computers Reported to
Use Different Types of Software, by Age Group, 1997
Note: Children age 15 and over were not asked about their use of educational programs.
6 to 8 9 to 11 12 to 14 15 and older 6 to 8 9 to 11 12 to 14 6 to 8 9 to 11 12 to 14 15 and older 6 to 8 9 to 11 12 to 14 15 and older 6 to 8 9 to 11 12 to 14 15 and older 6 to 8 9 to 11 12 to 14 15 and older
0 10 20 30 40 50 60 70 80
School Assignments
Percentage Graphics/
Design
Word Processing
Educational Programs
Games
http://www.futureofchildren.org
Summary and
Interpretations
The images of a new Net generation of chil-dren at the start of this article certainly have some truth to them. Just as widespread access to computers and the Internet is rapidly diffusing ideas, information, and skills among adults with common interests, it is also enabling teens and even younger chil-dren to learn more about what interests them. Little in the data examined here would lead to the conclusion that most
teenagers are broadly sophisticated com-puter users, however. Most comcom-puter use at schools falls short of helping students reach a high level of mastery, and most computer use at home is too entertainment oriented to have a major impact on children’s intel-lectual or technical competencies.
Yet the surveys analyzed here are but a snapshot in a highly dynamic situation. As schools and homes acquire more and newer computers, and as more young people spend more time using computers and the Internet in diverse ways, the Net generation is becoming a reality. The fol-lowing discussion provides a brief summary of key conclusions and interpretations to guide efforts to invest effectively in future technology and to ensure more equal access and use of computers for all America’s children.
Access to Computers and the
Internet: Necessary, But Not
Sufficient
Access to computers and the Internet is a necessary, but not sufficient, condition for children to grow up with the information-gathering, analytic, and written and graphi-cal communications skills that will constitute “being educated” in the twenty-first century.
Children must have access to an adequate quantity and quality of computers in their classrooms and homes, and knowledgeable adults or older peers must be available to help children learn to use the variety of soft-ware applications.
Nearly all children have access to com-puters at school. Low- and high-SES schools are about equally likely to meet a suggested standard for per capita computer presence. For the most part, however, only those stu-dents taking computer, business, or voca-tional education classes have ready access to computers in a classroom where other learn-ing activities are taklearn-ing place. Most academic classrooms with computers have too few to permit easy access to large numbers of stu-dents at one time.
In contrast, only about half of our nation’s children have access to computers at home. The disparities in access between chil-dren in low-SES and high-SES families are simply enormous. For example, whereas 91% of children in families with incomes of $75,000 or more have a computer at home, only 22% of children in families with incomes of less than $20,000 have home computers. The large family-level SES differ-ences in children’s access to home comput-ers are further exacerbated by residential SES segregation, with children living in poorer neighborhoods also having less access through a neighbor or friend, compared with children living in wealthier communities.
The data show that when parents use computers at work, however, they are much more likely to provide their children with access to computers at home, especially those in low-income families. Employers could reinforce this connection and help even more disadvantaged families gain access to home computers by extending their hardware and software contracts to employees for private purchase, thus making computer access available to families at a much-reduced price. Some companies have gone a step further and actually pur-chased computers for employees to use at home, including access to the Internet, for a nominal monthly fee.56
Even when computers are present in classrooms and in homes, however, the com-puters’ capabilities, location, or rules