ISSN 1725-2237
Reducing air pollution from electricity-generating large
combustion plants in the European Union
An assessment of potential emission reductions of NO
X, SO
2and dust
EEA Technical report No 9/2013
Reducing air pollution from electricity-generating large
combustion plants in the European Union
An assessment of potential emission reductions of NO
X, SO
2and dust
Cover design: EEA
Cover photo © istockphoto/Mafaldita Layout: EEA/Pia Schmidt
European Environment Agency Kongens Nytorv 6
1050 Copenhagen K Denmark
Tel.: +45 33 36 71 00 Fax: +45 33 36 71 99 Web: eea.europa.eu
Enquiries: eea.europa.eu/enquiries Copyright notice
© European Environment Agency, 2013
Reproduction is authorised, provided the source is acknowledged, save where otherwise stated.
Information about the European Union is available on the Internet. It can be accessed through the Europa server (www.europa.eu).
Luxembourg: Publications Office of the European Union, 2013 ISBN 978-92-9213-398-6
ISSN 1725-2237 doi:10.2800/92476
Environmental production
This publication is printed according to high environmental standards. Printed by Rosendahls-Schultz Grafisk
— Environmental Management Certificate: DS/EN ISO 14001: 2004 — Quality Certificate: DS/EN ISO 9001: 2008
— EMAS Registration. Licence no. DK – 000235
— Ecolabelling with the Nordic Swan, licence no. 541 176 — FSC Certificate – licence code FSC C0688122
Paper
RePrint — 90 gsm. CyclusOffset — 250 gsm.
Both paper qualities are recycled paper and have obtained the ecolabel Nordic Swan. Printed in Denmark
Contents
Contents
Acknowledgements ... 4
Executive summary ... 5
1 Introduction ... 13
1.1 Background ... 13
1.2 Objectives of this report ... 14
2 Data and methods ... 15
2.1 Datasets used in this study ... 15
2.2 Methodology ... 16
3 Results and discussion ... 20
3.1 Analysis of fuel type and use ... 20
3.2 Comparison of 2009 NOX emissions with LCPD and IED ELVs and lower BAT AELs .... 21
3.3 Comparison of 2009 SO2 emissions with LCPD and IED ELVs and lower BAT AELs ... 24
3.4 Comparison of 2009 dust emissions with LCPD and IED ELVs and lower BAT AELs .... 27
4 Uncertainty analysis ... 30
4.1 Introduction ... 30
4.2 Scope of the sensitivity analysis ... 30
4.3 Sensitivity analysis on the impact of parameters used to estimate the flue gas volume ... 30
4.4 Sensitivity analysis on the impact of the calorific value for NOX emissions ... 31
4.5 Sensitivity analysis on the impact of the calorific value for SO2 emissions ... 32
4.6 Sensitivity analysis on the impact of the calorific value for dust emissions ... 33
4.7 Conclusions of the sensitivity analysis on the impact of the calorific values for emissions ... 33
5 Conclusions ... 34
5.1 Emission reduction potential of NOX, SO2 and dust ... 34
5.2 Applicability of the approach ... 35
5.3 Uncertainty ... 36
Glossary ... 37
References ... 38
Annex I Example calculations of flue gas volumes for selected fuels ... 39
Acknowledgements
Acknowledgements
This report was prepared by the European Environment Agency's (EEA) European Topic Centre for Air pollution and Climate change Mitigation (ETC/ACM). Authors of the report were Pieter Lodewijks, Hannes Pieper and Luc Van Wortswinkel (ETC partner Flemish Institute for Technological Research (VITO), Belgium). The EEA project manager was Bob Boyce. Martin Adams
and Eva Goossens (EEA) are thanked for their contributions to the steering and finalisation of the report.
Representatives of the European Commission and the European Environmental Information and Observation Network (EIONET) who commented on the draft version of this report are warmly thanked.
Executive summary
Executive summary
Background
In 2008, the European Environment Agency (EEA) published a first assessment of the theoretical potential to reduce emissions of nitrogen oxides (NOX) and sulphur dioxide (SO2) from electricity-generating large combustion plants (LCPs) (EEA, 2008). That earlier study showed that improving the environmental performance of existing LCPs by applying best available techniques potentially could have reduced NOX emissions by up to 59 %, and SO2 emissions by as much as 80 % in the year 2004. These earlier emission reduction estimates were based on data from 450 electricity-generating LCPs in the then EU-25 that had been included in the now-discontinued European Pollutant Emission Register (EPER).
Since 2004, data reported by Member States shows that emissions of NOX, SO2 and dust from all LCPs have fallen. More specifically, between 2004 and 2009, EU-27 total emissions of NOX from the sector decreased by 30 %, of SO2 by 53 % and of dust by 58 % (AMEC, 2012). It is important to note that not all this reduction has occurred solely due to a further implementation of best available techniques (BAT), but rather by a combination of factors also including, for example, the economic recession and its subsequent impacts on energy demand, increased uptake of renewable energy and the closure of certain power plants.
This report presents results from an updated assessment of the hypothetical emission reduction potential of NOX, SO2 and dust from European LCPs for the year 2009. This new assessment is based upon improved statistics increasing the accuracy of the analysis compared to the earlier report, notably the latest available emission and fuel-use data from 2009 reported by Member States under the Large Combustion Plant Directive (2001/80/EC) (LCPD; EU, 2001).
The European Commission has proposed an enhanced focus on implementation in the context of the 7th Environment Action Programme. Filling gaps in the knowledge base in order to optimise
policy responses will become increasingly important in the face of the challenges and opportunities to enhance cross-cutting policy coherence. Compared with the existing situation, emissions from LCPs are expected to further decrease in the future with the implementation of the Industrial Emission Directive (2010/75/EU) (IED; EU, 2010) and its more stringent emission limit values (ELVs) that are to be met by 2016 for existing plants. The publication of the latest 2009 LCPD dataset has therefore provided an opportunity to assess the magnitude of the difference between actual emissions reported for that year and the level of emissions that would theoretically occur were the same set of plants to achieve emission levels corresponding with the IED ELVs. For comparative purposes, the report also presents a comparison of the reported 2009 emissions with the LCPD ELVs and the lower BAT associated emission levels (BAT AELs) — the latter to serve as a proxy for a potential 'maximum feasible' emission reduction.
The LCP pollutants NOX and SO2 are major contributors to acid deposition, leading to soil and freshwater acidification, which damages plants and aquatic habitats and can corrode building materials. Both pollutants also contribute to the formation of secondary particulate matter (PM) in the atmosphere following their release, while NOX also react with volatile organic compounds (VOCs) in the presence of sunlight to form ground-level ozone (O3). At present, primary and secondary PM and O3 are Europe's most problematic pollutants in terms of harm to human health (EEA, 2012a). NOX, SO2 and dust adversely affect local air quality, but also contribute to transboundary pollution causing harm to health and environment even at distant locations.
Approach
This report presents an estimation of the theoretical emission reduction potential from Europe's largest thermal power plants and compares the 2009 emissions data reported under the LCPD (EEA, 2012b) with the future applicable ELVs as defined in the IED, excluding all exempted circumstances.
Executive summary
A comparison of the reported 2009 emissions with the LCPD ELVs and the BREF lower AELs is also provided. The 2009 LCPD dataset used is the most recent emissions dataset available for LCPs, and it also contains information on the thermal capacity of each facility, its fuel types and fuel use. Of the 3 310 plants in the dataset, 1 595 (48 %) met the criteria for further analysis by being identifiable as an Electricity Supply Industry (ESI) or Combined Heat and Power (CHP) plant and being operational. Of these 1 595 plants, most (1 592) reported NOX emissions, 1 119 reported SO2 and 1 173 reported dust.
The remaining 1 715 plants were not considered in the scope of this report. The LCPD covers other types of industrial combustion plants beyond ESI and CHP plants such as refineries, and iron and
Box ES.1 Legislative context
Large combustion plants are defined in the EU LCP Directive (2001/80/EC) as those plants having a rated thermal input of 50 MW or greater. Emissions of three pollutants (SO2, NOX and dust) are regulated by the directive. According to the directive's Annex VIII(B), Member States must establish a plant-by-plant inventory of the total annual SO2, NOX and dust emissions and total annual energy input by fuel type (i.e. biomass, other solid fuels, liquid fuels, natural gas or other gases). A summary of this information must be reported to the Commission every three years; the latest available data covers 2007–2009. In addition, the Commission has asked for the plant-by-plant data to be made available. Large combustion plants are also regulated under the Integrated Pollution Prevention and Control (IPPC) Directive
(consolidated version: EU, 2008) which may lead to stricter and/or additional obligations on the plants than those required under the LCPD itself.
In particular, the IPPC Directive requires installations operating activities within its scope to apply the best available techniques (BAT), i.e. the most effective and advanced stage of operations considered technically and economically viable for the sector for controlling and reducing pollution. The emission limit values in the permits have to be based on BAT, taking into account local considerations. In order to describe and define the BAT at the EU level, the European Commission develops and adopts the BAT reference documents (BREF), which serve as guidance for competent authorities when defining permit conditions.
In 2006 the European Commission adopted the large combustion plant BREF (LCP BREF) which describes the BAT as well as the range of emission levels achievable by applying BAT — the so-called Associated Emission Levels (AEL) with the lower end (lowerBAT-AEL) being the most stringent and the upper end the least stringent.
The IPPC Directive and the LCPD were superseded by the Industrial Emissions Directive (IED) (2010/75/EU) which entered into force on 6 January 2011 and which had to be transposed into national legislation by 7 January 2013. The IED regulates the emissions from LCPs by requiring the application of BAT and the BAT-AELs, set out in BAT conclusions which have a legal effect, as well as by setting mandatory 'minimum' emission limit values (ELVs) for SO2, NOX and dust. These limit values will apply for existing combustion plants from 2016 onward, with some longer transitional periods for particular groups of plants. The European Commission is presently revising the LCP BREF, with the aim of establishing BAT conclusions, to be adopted in the course of 2014.
This report does not assess the compliance of individual plants or Member States under these directives. Neither does it evaluate the implementation of the IPPC, LCPD or IED through national regulations.
steel facilities. Such facilities were not included in the study. Further, 'opt-out' plants which have elected to manage their emissions via other permissible LCPD methods such as closing down after a set period were excluded, as were those where there was insufficient information to allow their classification.
The 2009 LCP dataset was supplemented by data from the Platts European Energy Power Plants (EEPP) dataset (Platts, 2011) that contains technical information on most electric power plants in Europe. The Platts dataset was used to distinguish between ESI and CHP plants when sector code information was not reported in the LCP dataset, and also to improve the level of detail concerning use of 'other solid fuels' and 'biomass' at Member State level.
Executive summary
Four main steps were performed in the assessment: i. determination of the thermal capacity, and fuel
use per fuel type at each plant; ii. estimation of flue gas volumes;
iii. calculation of the theoretical NOX, SO2 and dust emissions for three cases:
– assuming that all plants have emissions not exceeding the LCPD ELVs;
– assuming that all plants have emissions not exceeding the IED ELVs;
– assuming that all plants have emissions not exceeding the BREF lower AELs;
iv. comparison of the pollutant emissions calculated for each of the three cases aggregated by
Member State with the reported emissions for the year 2009.
The robustness of the updated assessment compared to the earlier EEA 2008 report is notably improved in two main respects:
• the number of plants considered in this report (1 595) is greater than the number (450) upon which the findings of the earlier report were based, which strengthens the applicability of the analysis;
• actual fuel-use data from the LCPD reporting is used in this study. Such data was not available when the previous reporting was performed, which meant a number of assumptions had to be made concerning the fuel type and fuel consumption at the individual plant level. The accuracy of results in the current study is therefore significantly improved.
It is important to note the theoretical nature of this study. It assumes the same application of the IED ELVs (and the LCPD ELVs and the BREF lower AELs) across all plants covered, and does not consider derogations or the detailed flexibilities (temporary and permanent) that are included in the scope of the IED. For example, no differentiation was made for ESI and CHP plants addressed in National Emission Reduction Plans (NERPs) or under Member State Accession Treaty derogations. Thus, the study does not provide a detailed modelling of IED implementation. The report also does not take into account any changes that may have occurred since 2009 — for example, reduced industrial activity because of the economic recession, plant closures, replacement of old plants
with newer, more efficient and cleaner technologies, changes in fuel mixes, operational/management changes and evolution of abatement equipment.
Results and key findings
A small number of large-scale coal plants and plants co-combusting coal with other fuels dominate the reported emissions for all three pollutants. Just 50 plants (i.e. 3 % of the 1 595 plants addressed in this report) contribute 50 % of NOX emissions, with 454 (28 %) responsible for 90 % of emissions. The situation is more striking for SO2 with only 20 plants (1 %) responsible for 50 % of total emissions and 165 (10 %) contributing 90 %. For dust, just 21 plants (1 %) contribute 50 % and 175 (11 %) contribute 90 % of the total reported emissions. In general, a good correlation is noted at the Member State level between the 2009 emissions reported under the LCPD for the electricity generation sector and those reported under the European Pollutant Release and Transfer Register (E-PRTR) (1), although some potential
errors in official reporting were identified and are described. Unfortunately, a detailed plant-by-plant comparison is not possible because there is no direct link established between the two datasets (2).
The results of the present study clearly indicate that EU-27 emissions of the air pollutants NOX, SO2 and dust from the selected LCPs could potentially be significantly lower if all plants operating in 2009 were to meet the ELVs set out in the IED (Table ES.1 and Figure ES.1).
Specific findings of the report are listed below. • EU-27 NOX emissions from LCPs considered in
this study have the potential to be 36 % lower than in 2009 if all plants meet the IED ELVs and 69 % lower if plants achieve the more stringent BAT AEL. For SO2,the potential emission reductions are 66 % and 94 %, respectively, and 64 % and 79 %, respectively, for dust.
• Most of the potential reduction can be achieved from just a relatively few very large coal and coal co-combustion plants.
• Several Member States already report emissions from LCPs below the level of the IED emission limits that have to be achieved by 2016. However, in some of the newer Member States, emissions are still significantly above the IED levels.
(1) European Pollutant Release and Transfer Register (http://prtr.ec.europa.eu/).
Executive summary
• At the Member State level, most of the reported 2009 emissions are consistent with, or below, the LCPD ELVs. There are a number of derogations (exemptions) granted under the LCPD that are not taken into account in this analysis, such a plants granted longer transitional periods and/or which rely on derogations such as controls on desulphurisation rates being implemented in place of attaining ELVs.
It is clear that meeting the ELVs of the IED would reduce emissions of SO2 and dust from these LCPs by more than 60 % compared to 2009 emission levels. Such reduction of emissions would obviously deliver substantial benefits in terms of improvements to human health and the environment. A recent assessment from the EEA showed that the estimated damage costs to health and the environment caused by air pollution from the energy-generating sector (excluding carbon dioxide (CO2)) in 2009 was EUR 26–71 billion (EEA, 2011). An assessment of the costs to industry and consumers to achieve such lower emissions is beyond the scope of this report.
In the following figures comparisons are made by Member State between reported emissions for 2009 and the theoretical application of ELVs for NOX (Figure ES.2), SO2 (Figure ES.3) and dust (Figure ES.4).
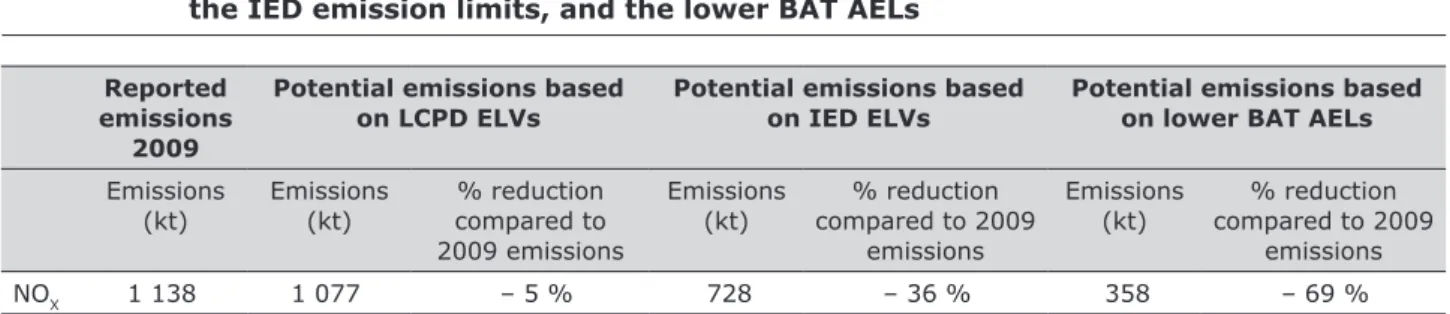
Table ES.1 Gap between 2009 emissions and emissions based on the LCP emission limits, the IED emission limits, and the lower BAT AELs, by pollutant for the 1 595 plants assessed in this report (*)
Reported emissions
2009
Potential emissions based
on LCPD ELVs Potential emissions based on IED ELVs Potential emissions based on lower BAT AELs Emissions
(kt) Emissions (kt) compared to % reduction 2009 emissions
Emissions
(kt) compared to 2009 % reduction emissions
Emissions
(kt) compared to 2009 % reduction emissions
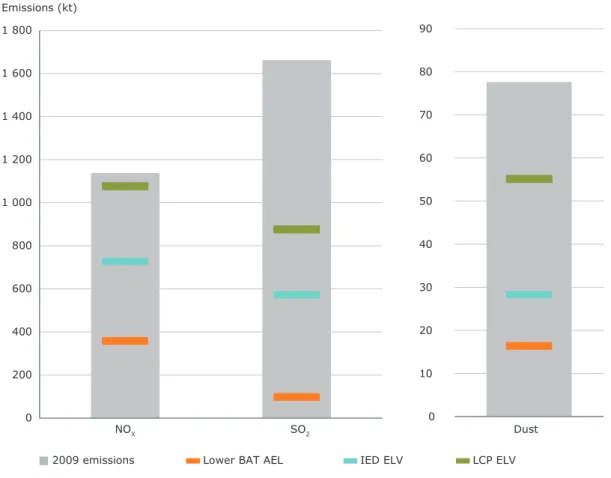
NOX 1 138 1 077 – 5 % 728 – 36 % 358 – 69 %
SO2 1 662 876 – 47 % 572 – 66 % 98 – 94 %
Dust 77.6 55.1 – 29 % 28.2 – 64 % 16.4 – 79 %
Note: * Care is needed when interpreting the values in Table ES.1 as there are uncertainties inherent in the estimation of the
flue gas volumes. The estimates are based on Member State averages and do not reflect individual plants; existing LCP
derogations have not been taken into account.
NOX
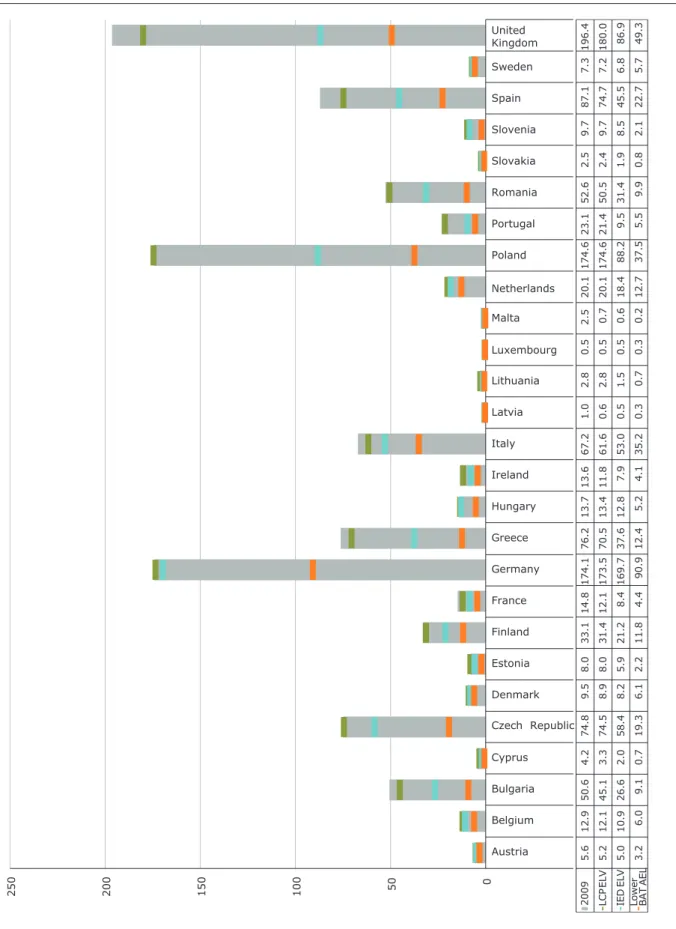
Germany, Poland and the United Kingdom report the highest 2009 NOX emissions from LCPs (Figure ES.2). However, emissions from Germany are already largely consistent with the IED ELVs, while some scope exists to reduce emissions further to the levels of the lower BAT AELs values. Greece, Poland, Spain and the United Kingdom have the largest absolute differences in terms of tonnes of NOX from 2009 emissions to the IED ELVs. SO2
Bulgaria, Greece, Poland and Romania have the highest reported 2009 SO2 emissions of the EU-27 Member States (Figure ES.3), and together account for the largest difference between 2009 emission levels and the IED ELVs. In particular, Bulgaria and Romania together, contribute almost 40 % to the total SO2 emissions for the EU-27 and, similarly, account for a large fraction of the EU-27 SO2 emissions that in 2009 lay above the IED ELVs. Dust
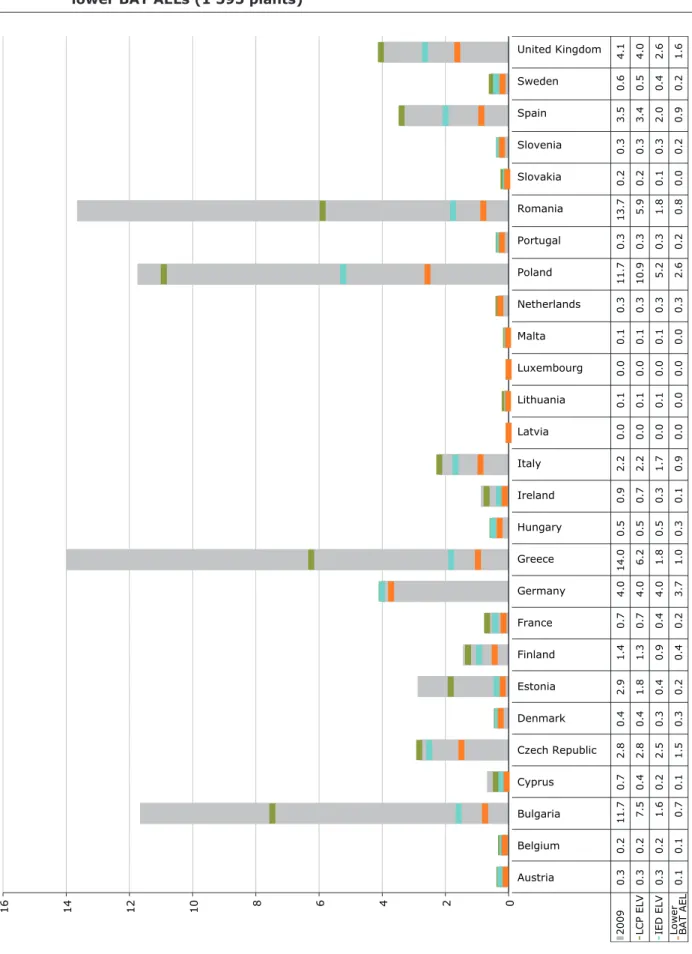
The same four Member States (i.e. Bulgaria, Greece, Poland and Romania) also reported the highest 2009 dust emissions, significantly above emission levels that would be consistent with the IED ELVs (Figure ES.4).
Executive summary
Figure ES.1 Reported 2009 EU-27 LCP emissions compared with the future emission limit values of the IED, the existing LCPD emission limit values and the LCP BREF lower AEL
NOX SO2
Emissions (kt)
2009 emissions Lower BAT AEL IED ELV LCP ELV 0
200 400 600 800 1 000 1 200 1 400 1 600 1 800
0 10 20 30 40 50 60 70 80 90
Dust
Uncertainties
Due caution is also needed when interpreting the figures since there are uncertainties inherent in the estimation of the flue gas volumes, and the estimates are averaged for each Member State thus not reflecting individual plants. Recognising the uncertainty
inherent in the assessment, a sensitivity analysis was performed concerning the influence of the fuel
calorific values used to estimate the flue gas volumes and, hence, ultimately the emissions. The analysis showed that the highest impact on the certainty of the study results is related to lignite and its wide range of possible calorific values. In order to raise the overall certainty for future assessments and to assist in the verification of plant emissions, it would be beneficial if plant-specific information on the calorific value of fuels used were made publicly available.
Executive summary
Figure ES.2 2009 NOX emissions (kt) compared with LCP and IED emission limits, and the lower BAT AELs (1 595 plants)
NO X emissions (kt) 2009 5. 61 2. 95 0.6 4.2 74.8 9. 58 .0 33.1 14.8 174.1 76.2 13.7 13.6 67. 21 .0 2. 80 .5 2. 52 0.1 174. 62 3. 15 2.6 2.5 9.7 87.1 7.3 196. 4 LC P EL V 5. 21 2. 14 5.1 3.3 74.5 8. 98 .0 31.4 12.1 173.5 70.5 13.4 11.8 61. 60 .6 2. 80 .5 0. 72 0.1 174. 62 1. 45 0.5 2.4 9.7 74.7 7.2 180. 0 IE D EL V 5. 01 0. 92 6.6 2.0 58.4 8. 25 .9 21. 28 .4 169.7 37.6 12.8 7.9 53. 00 .5 1. 50 .5 0. 61 8.4 88.2 9. 53 1.4 1.9 8.5 45.5 6.8 86. 9 Lowe r BA T AE L 3.2 6.0 9. 10 .7 19.3 6. 12 .2 11. 84 .4 90.9 12.4 5.2 4.1 35. 20 .3 0. 70 .3 0. 21 2.7 37.5 5. 59 .9 0.8 2.1 22.7 5.7 49. 3 0 50 10 0 15 0 20 0 25 0 Austria Belgium Bulgaria Cyprus Czech Republic Denmark Estonia Finland France Germany Greece Hungary Ireland Italy Latvia Lithuania Luxembourg Malta Netherlands Poland Portugal Romania Slovakia Slovenia Spain Sweden United Kingdom
Executive summary
Figure ES.3 2009 SO2 emissions (kt) compared with LCP and IED emission limits, and the lower BAT AELs (1 595 plants)
Austria Belgium Bulgaria Cyprus Czech Republic Denmark Estonia Finland France Germany Greece Hungary Ireland Italy Latvia Lithuania Luxem-bourg Malta Netherlands Poland Portugal Romania Slovakia Slovenia Spain Sweden United Kingdom SO 2 emissions (kt) 2009 1.4 2.5 308.5 13.3 93. 82 .7 40.7 20.1 16. 91 21. 51 88. 19 .8 15.7 51.5 0. 04 .2 0. 03 .5 5. 92 37. 07 .1 327. 03 .2 6. 06 6.8 2. 61 11. 8 LCP EL V 1.3 2.3 68. 97 .5 81. 22 .7 15.2 19.1 11. 31 21. 16 5.7 9. 87 .4 47.7 0. 01 .1 0. 00 .6 5. 91 85. 27 .1 68.7 3. 06 .0 44.1 2. 69 0.5 IE D EL V 1.4 1.9 30. 12 .4 56. 62 .4 7.4 14. 17 .6 119. 43 7.6 9. 03 .7 27.8 0. 00 .6 0. 00 .6 5. 99 8.7 7. 13 2. 61 .7 5. 63 2.4 2. 06 3.8
Lower BAT AE
L 0.7 0.6 3.7 1. 09 .9 1. 50 .9 5. 72 .3 25.6 4. 52 .1 0. 55 .5 0. 00 .3 0. 00 .2 2. 11 1.1 0. 93 .7 0. 30 .9 5. 11 .4 7. 5 0 50 100 150 200 250 300 350
Executive summary
Figure ES.4 2009 dust emissions (kt) compared with LCP and IED emission limits, and the lower BAT AELs (1 595 plants)
Dust emissions (kt)
Austria Belgium Bulgaria Cyprus Czech Republic Denmark Estonia Finland France Germany Greece Hungary Ireland Italy Latvia Lithuania Luxembourg Malta Netherlands Poland Portugal Romania Slovakia Slovenia Spain Sweden United Kingdom 2009 0.3 0.2 11.7 0.7 2.8 0.4 2.9 1.4 0.7 4.0 14.0 0.5 0.9 2.2 0. 00 .1 0.0 0.1 0.3 11.7 0.3 13. 70 .2 0.3 3.5 0.6 4. 1 LCP EL V 0.3 0.2 7.5 0.4 2.8 0.4 1.8 1.3 0.7 4.0 6.2 0.5 0.7 2.2 0. 00 .1 0.0 0.1 0.3 10.9 0. 35 .9 0. 20 .3 3.4 0.5 4. 0 IED EL V 0.3 0.2 1.6 0.2 2.5 0.3 0.4 0.9 0.4 4.0 1.8 0.5 0.3 1.7 0. 00 .1 0.0 0.1 0.3 5. 20 .3 1. 80 .1 0.3 2.0 0.4 2. 6
Lower BAT AE
L 0.1 0.1 0.7 0.1 1.5 0.3 0.2 0.4 0.2 3.7 1.0 0.3 0.1 0.9 0. 00 .0 0.0 0.0 0.3 2. 60 .2 0. 80 .0 0.2 0.9 0.2 1. 6 0 2 4 6 8 10 12 14 16
Introduction
1 Introduction
1.1 Background
LCPs are a significant source of emissions of the air pollutants NOX,SO2 and dust (particulate matter) as well as other pollutants such as greenhouse gases, heavy metals and certain persistent organic pollutants. The pollutants NOX and SO2 are major contributors to acid deposition, leading to soil and freshwater acidification, which damages plants and aquatic habitats, and can corrode building materials. Both pollutants also contribute to the formation of secondary PM in the atmosphere following their release, while NOX also react with VOCs in the presence of sunlight to form ground-level O3. At present, primary and secondary PM and O3 are Europe's most problematic
pollutants in terms of harm to human health (EEA, 2012b). NOX, SO2 and dust adversely affect local air quality, but also contribute to transboundary pollution causing harm to health and environment even at distant locations.
The introduction of air pollution legislation over the past decades and the subsequent implementation of emission prevention and abatement measures in the power plant sector has led to a significant reduction in the level of emissions from LCPs. Since 2004, data reported by Member States shows that emissions of NOX, SO2 and dust from plants covered by the LCP Directive have fallen significantly. More specifically, between 2004 and 2009, EU-27 emissions of NOX from the sector decreased by 30 %, of SO2 by 53 % and of dust by 58 % (AMEC, 2012).
However, despite the reductions in emissions that have occurred, the electricity and heat production sector still remains an important source of key air pollutants that contribute to poor air quality in Europe (EEA, 2012a).
1.1.1 EU legislation concerning large combustion plants
The LCPD (2001/80/EC) covers combustion plants with a rated thermal input equal to or exceeding 50 MW which are operated for power and/or heat generation purposes as well as certain industrial plants. It entered into force on 27 November 2001. The directive sets specific ELVs for the pollutants SO2, NOX and dust (PM). The directive distinguishes between new plants (licensed after 1 July 1987), which had to meet the LCPD ELVs immediately, and existing plants (licensed before 1 July 1987), which could choose, by 1 January 2008, to:
• meet the LCPD ELVs, or
• implement a national emission reduction plan (NERP), which sets an annual maximum level of emissions for the plants covered by it.
A NERP has been implemented by 8 Member States (3) for part or all of their existing LCPs.
In addition, existing plants can be exempted from compliance with the emission limits and from inclusion in the NERP on condition that the operator undertook not to operate the plant for more than 20 000 hours between 1 January 2008 and 31 December 2015. In 2009, there were approximately 239 such plants, and these are referred to as 'opted out' plants.
The IPPC Directive (originally 96/61/EC, but consolidated in 2008 as Directive 2008/1/EC) covers a number of industrial activities (including combustion plants with a rated thermal input exceeding 50 MW) and aims to reduce their overall environmental impact through a process of integrated permitting. Emission limit values set in those permits have to be based on best available techniques (BAT), taking into account certain local considerations. The interaction between the IPPC Directive and the LCPD is such that the latter sets
Introduction
minimum obligations which are not necessarily sufficient to comply with the IPPC Directive.
The IPPC Directive and the LCPD are being replaced by the IED (2010/75/EU) is a recast of seven existing directives. The IED entered into force on 6 January 2011 and had to be transposed into national legislation by Member States by 7 January 2013. The IED aims to achieve further benefits to the environment and human health by reducing harmful industrial emissions through the better application of BAT. Amongst the key changes is a stricter definition of BAT, leaving less flexibility for competent authorities to set ELVs outside the BAT ranges. The IED also has tighter minimum ELVs for LCPs to be applied from 1 January 2016 for existing plants. There is also the possibility under the IED of using minimum desulphurisation rates or less strict ELVs in case of plants having a limited number of operating hours. These options are not considered for the purposes of the hypothetical assessment described in this report.
1.1.2 Best available techniques and emission limits The present LCP BREF was adopted in 2006
following an exchange of information between the European Commission, the Member States, industry and environmental NGOs (European Commission, 2006).
The BAT associated emission levels (BAT-AELs) given in the BREF are expressed as a range of values taking into consideration factors such as the age of the plants, process management and the range of techniques considered to be BAT. The BAT-AELs range from the lowerBAT (most stringent) to the upper BAT (least stringent). The BAT AELs are expressed as flue gas pollutant concentrations. While not legally binding under the IPPC Directive,
the BAT AELs provide information on the best environmental performance associated with technically and economically viable techniques. A revision of the LCP BREF started in October 2011, a process which is expected to lead to new LCP BAT conclusions to be adopted under the IED in the course of 2014. These BAT conclusions will have a much more binding role under the IED than was previously the case under the IPPC Directive.
1.2 Objectives of this report
Emissions from existing LCPs are expected to decrease in the future with the implementation of the IED and its more stringent ELVs that are to be met by 2016. The publication of the latest 2009 LCPD dataset provided an opportunity to assess the difference between actual emissions reported for that year and the level of emissions that would hypothetically occur were all LCPs to achieve the default IED ELVs. The report also presents a comparison of the reported 2009 emissions with the LCPD ELVs and the BREF lower AELs.
It is important to note the theoretical nature of this study. It assumes the same application of the IED ELVs (and the LCPD ELVs and the BREF lower AELs) across all plants covered, and does not consider derogation or the detailed flexibilities (temporary and permanent) that are included in the IED. Thus, the study does not provide a detailed modelling of future IED implementation. The report also does not take into account any changes that may have occurred since 2009 — for example, reduced industrial activity because of the economic recession, plant closures, replacement of old plants with newer, more efficient and cleaner technologies, changes in fuel mixes, operational/ management changes and evolution of abatement equipment.
Data and methods
2 Data and methods
2.1 Datasets used in this study
The latest available LCP (2009) dataset (EEA, 2012b) was used as the main data source for the purposes of this report. However, not all required data are available from this source and thus the methodology developed also required certain assumptions and approximations. The Platts EEPP dataset (Platts, 2011) was used to provide more detailed technical information on coal and biomass type used on a Member State basis. The E-PRTR was used for cross-checking emissions from the LCP dataset.
Each of these datasets has its own terminology, and each also represents a different scale of the emissions sources. At the most detailed scale is the Platts EEPP dataset, in which information is provided for individual units (i.e. boilers, turbines, etc.). One or more units that discharge waste gases through a common stack form a LCP. One or more plants on the same site comprise a 'facility' under the E-PRTR Regulation. These datasets are discussed in further detail below.
2.1.1 Large combustion plant inventory dataset Starting in 2004, Member States were required to establish an inventory of annual SO2, NOX and dust emissions from plants under the LCPD (Annex VIII(B)) requirements. The inventory contains information on a plant-by-plant basis including the amount of fuel used per category of fuel (biomass, other solid fuels, liquid fuels, natural gas, other gases). In addition, the Commission has asked Member States to also report for each plant, sometimes on a voluntary basis, information on the rated thermal input, the plant type or sector in which it is operated and its age category. Information on whether the plant has opted-out of the LCPD is also reported. Of the 3 310 plants in the dataset for 2009, 1 595 (48 %) met the criteria for further analysis by being identifiable as an ESI or CHP plant and being operational. Of these 1 595 plants, most (1 592) reported NOX emissions, 1 119 reported SO2 and 1 173 reported dust.
The remaining 1 715 plants were not considered in the scope of this report. The LCPD covers other types of industrial combustion plants beyond ESI and CHP plants such as refineries, and iron and steel facilities. Such facilities were not included in the study. Further, 'opt-out' plants which have elected to manage their emissions via other permissible LCPD methods such as closing down after a set period were excluded, as were those where there was insufficient information to allow their classification.
Only the electricity-producing plants, ESI and CHP sectors, are used in this report. Most Member States voluntarily provided the sector codes but a few did not — for example, Germany, the Netherlands and Sweden, while Italy only distinguishes between 'refinery' and 'non-refinery'. For these plants it was necessary to use other sources of information to distinguish between a plant producing only electricity (ESI) or also heat (CHP) or only heat (others like refinery or district heating, etc.). The main shortcoming of the LCP dataset for the purpose of comparing emissions with applicable emission limit values or BAT levels (expressed as concentrations) is that the fuel type grouping is not detailed enough to calculate flue gas volumes with a sufficient degree of certainty, especially for 'biomass' and 'other solid fuels'. More specifically, biomass can be solid, liquid or gaseous, and 'other solid fuels' can be (sub)bituminous coal, anthracite or lignite. Each of these fuel types produces a different specific flue gas volume when combusted. The LCP data was therefore complemented by using data from the Platts EEPP dataset at a Member State level to improve the assessment's certainty. The EEPP dataset was used to distinguish between ESI and CHP by assuming all LCPs with gas turbines produce electricity and for all others to determine if the plant was producing only heat or also electricity. Where it was not possible to identify the sector activity of a LCP using this approach — for example, industrial parks with several LCPs on the same site — the LCPs were excluded from the study.
Data and methods
2.1.2 European Pollutant Release and Transfer Register 2009 dataset
The E-PRTR (4) 2009 dataset (v4.1) (5) was used
to cross-check the LCP emissions data for consistency. The E-PRTR provides annual NOX, SOX and PM10 emissions from industrial facilities covering 65 activities. In 2009, 2 252 E-PRTR facilities reported being 'Thermal power stations and other combustion installations', of which 1 732 facilities reported it as their main activity, which is considered equivalent to the LCP ESI and CHP sectors. One or more pollutants were reported by 1 288 facilities above the E-PRTR reporting thresholds for NOX, SOX andPM10.
2.1.3 Platts European Energy Power Plants dataset (Platts, 2011)
The EEPP (version Dec. 2011) (Platts, 2011) is a commercial dataset containing information on most European power plants. The data is available at unit level, which represents a set, block, aggregate or section of power generation equipment. Information on unit name, geographic location, operating status, electrical capacity (MWe), primary and alternate fuel type (but not fuel use), equipment vendors for the boiler (or reactor), turbine and/or engine, as well as generator/ alternator, steam conditions, pollution control equipment and cooling system data are included in the dataset.
The dataset contains more detail on the biomass (wood, peat, bio-derived liquid fuel) and coal (anthracite, (sub)bituminous coal, lignite) fuel types compared to that provided in the LCP dataset. Therefore, for the purposes of this study, the EEPP dataset was linked to the LCP dataset and used at an aggregated Member State level to complement the LCP dataset. The chemical composition of the fuels was used to calculate the flue gas volume with higher accuracy. The following section and Annex I provide further details of the calculations for the different fuel types.
In most cases, individual units contained in the Platts dataset cannot be matched with LCP plants and therefore information was aggregated by Member States. The sector code information was
(4) See http://prtr.ec.europa.eu.
(5) The E-PRTR dataset (v4.1) represents the status of the E-PRTR dataset as on 9 June 2012. It contains 2009 data reported in 2011
that has subsequently been corrected by reporting countries. See http://www.eea.europa.eu/data-and-maps/data/E-PRTR4.1.
used to distinguish between ESI and CHP sectors for Italy, the Netherlands and Sweden. In some cases, the EEPP was not up to date so further information was gathered via publicly available sources.
2.2 Methodology
The LCP dataset is the only official dataset available at EU level that contains both emissions and
information on the fuel consumption at individual plant level. The Platts dataset was used for
increasing the level of detail concerning the coal and biomass fuel types. Together, these datasets provide the necessary parameters to calculate emission levels (based upon ELVs) and make the comparison with actual emissions.
Four main steps were performed in the assessment: 1. determination of the thermal capacity, and fuel
use per fuel type at each plant; 2. estimation of flue gas volumes;
3. calculation of the theoretical annual NOX, SO2 and dust (and also PM10 and PM2.5) emissions when:
– assuming that all plants have emissions not exceeding the LCPD ELVs;
– assuming that all plants have emissions not exceeding the IED ELVs;
– assuming that all plants have emissions not exceeding the BREF lower AELs;
4. comparison of the pollutant emissions calculated for each of the three cases aggregated by
Member State with the reported emissions for the year 2009.
Each step is described in more detail below. Step 1: Thermal capacity per plant — fuel use per
fuel type
To calculate the progress of Member States towards the LCPD and IED ELVs and the lower BAT AELs, knowledge of the thermal capacity at each plant is needed. The LCP dataset contains data on the total thermal input capacity per plant and provides fuel use broken down into five categories: biomass, other solid fuels, liquid fuels, natural gas and other gases.
Data and methods
Step 2: Estimation of flue gas volumes To calculate the level of expected emissions consistent with LCPD and IED ELVs and the lower BAT AELs, estimates of flue gas volumes were calculated based on fuel type and fuel use information.
The calculations start with the estimation of the stoichiometric volumes of flue gases due to the combustion of different fuel types. The combustible components of fuels are principally carbon (C) and hydrogen (H), and in lesser quantity sulphur (S). Complete combustion of a fuel is possible only in the presence of an adequate supply of oxygen (O) usually in the form of air (Box 2.1).
Ambient air contains 21 % oxygen, 78 % nitrogen (N2) and 1 % other gases (for example, argon (Ar), CO2 and water vapour). The products of a stoichiometric combustion with oxygen from the air are CO2, H2O (water) and SO2, which pass through the chimney along with the N2 in the air. N2 and the other gases do not take part in the combustion process, but some N2 reacts with oxygen to form NO and NO2 (reported as NOX).
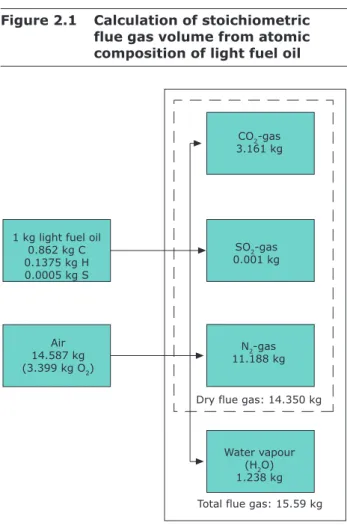
As an example, the flue gas volume in the combustion of 1 kg of light fuel oil is illustrated in Figure 2.1. Annex I provides details of the calculation of the flue gas volume of other fuels (based upon Babcock & Wilcox Co., 2007). For the ideal combustion of 1 kg of light fuel oil containing 86 % carbon, 14 % hydrogen and 0.05 % sulphur, theoretically about 14 kg of air is required. This is the minimum air that would be required if the mixing of fuel and air by the burner and combustion is perfect.
Box 2.1 Theoretical combustion
[C + H (fuel)] + [O2 + N2 (Air)] à (Combustion Process) à [CO2 + H2O + N2 (Heat)] Considering:
1 mol C + 1 mol O2 = 1 mol CO2 à 12 kg C + (2 x 16/12) kg O2 = (44/12) kg CO2 Such that:
1 kg C + 2.667 kg O2à 3.667 kg CO2 And similarly for H2 and S:
1 kg H2 + 8 kg O2à 9 kg H2O 1 kg S + 1 kg O2à 2 kg SO2
The flue gas volume is calculated by taking the molecular weight (m) of the combustible components and air combined in the volume of 1 molecule (mol) of the ideal gas at normalised (N) gas conditions (1 013.25 mbar, 0 °C). This equates to 22.4 L. Using the values in Figure 2.1, the combustion of 1 kg of light fuel oil therefore leads to a net flue gas volume of 12.1 Nm³:
CO2-gas: 22.4 L * 3.161 kg/44 m = 1.6092 Nm³ SO2-gas: 22.4 L * 0.001 kg/64 m = 0.0004 Nm³ N2-gas: 22.4 L * 11.188 kg/28 m = 8.9504 Nm³ Water vapour: 22.4 L * 1.238 kg/18 m = 1.5406 Nm³
= 12.1006 Nm³ (wet flue gas) = 10.5600 Nm3 (dry flue gas)
The dry flue gas volume per unit energy produced (MJ) in a stoichiometric combustion process using 1 kg of light fuel oil is therefore 0.281 Nm³/MJ using the default net calorific value (43.0 MJ/kg) (IPCC, 2006). Since the LCPD and IED ELVs and the BAT AELs are also expressed as an emission factor per Nm³, the flue gas volumes can be directly used to calculate emissions.
In reality, unlike the theoretical example above, combustion works with a surplus of oxygen. The LCPD requirements state that the amount of surplus oxygen depends on fuel type and the technology used (e.g. gas turbine). The following excess oxygen values are used for the flue gas calculations in this report:
Data and methods
Figure 2.1 Calculation of stoichiometric flue gas volume from atomic composition of light fuel oil
Source: Modified from DEB, 1982; and Babcock & Wilcox Co.,
2007.
Water vapour (H2O)
1.238 kg N2-gas
11.188 kg SO2-gas
0.001 kg CO2-gas
3.161 kg
1 kg light fuel oil 0.862 kg C 0.1375 kg H 0.0005 kg S
Air 14.587 kg (3.399 kg O2)
Dry flue gas: 14.350 kg
Total flue gas: 15.59 kg
• Solid fuels (coal, brown coal, wood, etc.): 6 % • Liquid fuels: 3 % or 15 % for gas turbines • Gaseous fuels: 3 % or 15 % for gas turbines All calculations in this report are based on the calculated dry flue gas volumes and on the net calorific values of the different fuels (IPCC 2006, and for lignite Member State averaged values from Euracoal 2013).
It is difficult to estimate accurately the flue gas volumes for biomass and lignite because it itself contains oxygen and this oxygen takes part in the combustion process. Furthermore, the chemical composition of biomass can vary significantly. Since the LCP dataset does not contains details on biomass type (i.e. solid, liquid or gaseous), the Platts dataset was used to obtain further detail on the type of combusted biomass in order to differentiate between
wood, peat, biogas (landfill gas, sewage digester gas), wastewater sludge and bio-derived liquid fuel. The Platts dataset shows that 68 % of the units that have biomass as a main fuel use wood, and in most cases wood is an alternative fuel in co-combustion units. In Finland, Ireland and Sweden, peat is also used as a main fuel (11 % of the units). In some cases, there is no extra information available on the type of biomass.
As wood is the main biomass fuel type, the chemical composition of wood pellets was used to calculate the calorific value and flue gas volumes for all biomass. Wood pellets are often the main biomass source burned in electrical power plants because of their high combustion efficiency. The pellets themselves are densely compacted sawdust or other wastes from sawmilling, with low moisture content (below 10 %). Furthermore, the ELVs for 'wood' and 'peat' are the same, so there is no refinement necessary for further analysis.
The Platts dataset was also used to differentiate between the different types of 'other solid fuels' from the LCP dataset because of the variability in flue gas volumes in the combustion of anthracite, (sub) bituminous coal and lignite (6). Using the
coal details from Platts at a Member State level, the following grouping of coal types was used for the analysis:
• hard coal consisting of Platts coal types: anthracite, bituminous coal;
• lignite consisting of Platts coal types: lignite and (sub)bituminous coal;
mixed coal consisting of Platts coal mix:
bituminous/lignite, bituminous/(sub) bituminous. For each Member State, a weighted average was calculated across the distribution of different coal groups using the electrical capacity (MWe) of the units from the Platts dataset. Annex II provides a detailed summary.
Step 3: Estimation of NOX, SO2, dust, PM10 and PM2.5 emissions corresponding to the IED and LCPD ELVs and the lower BAT AELs
Case 1: All plants have emissions not exceeding the lower BAT AELs
Plant-level emissions were estimated using
(6) The value of the flue gas volume corresponding to each fuel type is a sensitive parameter in the assessment. Use of a higher flue
gas volume value implies lower emission concentrations will subsequently be estimated. Annex II provides further examples of the flue gas volume calculations by fuel type.
Data and methods
emission factors corresponding to the BAT lower AELs that are provided based on the age of the plant. The LCP dataset contains plant ages and their distribution is presented in Figure 2.2.
For the 'new-new' and 'old-new' plants (terminology of the LCPD), the BAT AELs of new plants were applied, while for the 'existing' plants, unknown and empty cells, the AELs for existing plants were applied. If the estimated value was higher than the 2009 emission, then the 2009 emission was retained since this means the reported emission is already lower than the AEL. The difference in such cases is termed the 'surplus reduction' throughout this report — that is, the difference between the estimated emission corresponding to the lower BAT AELs
(or LCPD ELVs) and the reported emission, where the latter is lower. As information on the emission abatement beyond the AEL is lost by simply retaining the 2009 emissions, an estimation of this 'surplus reduction' or excess was made in such situations.
Case 2: All units have emissions not exceeding the LCPD ELVs
Emissions at plant level were estimated using emission factors corresponding to the regular-case LCPD ELVs and using the same
Figure 2.2 Age distribution of the 1 595 LCPs considered in this report
'New-new' 16%
'Old-new' 22%
'Existing' 40 % Unknown
17 %
Empty cells 5 %
plant age assumptions as was done for the BAT AELs. If the estimated value was higher than the 2009 emission at plant level, the latter was retained since this means that the reported emission is already lower than the LCPD ELVs. The 'surplus reductions' were also calculated.
Case 3: All plants have emissions not exceeding the IED ELVs
Emissions at plant level were estimated using emission factors corresponding to the IED ELVs. The same plant age assumptions were applied as for the calculation of the BAT AELs and the LCPD ELVs. If the estimated value was higher than the 2009 unit emission, the latter was retained since this means that the current emission is already lower than the IED ELVs. The 'surplus reductions' were also calculated.
Actual emissions for NOX, SO2 and dust were obtained from the 2009 LCP dataset as previously described. While the LCP dataset contains data on dust emissions, no information is provided concerning the PM2.5 or PM10 fractionation. These fractions were therefore estimated using default average emission factors for averaged abatement technologies from the EMEP/EEA air pollutant emission inventory guidebook (EEA, 2009). The fuel type used strongly influences the PM emission factors. Dust emissions from gaseous fuels consist of 100% PM10 and PM2.5 emissions, while the fractions from the combustion of different coal types are 66% PM10 and 30% PM2.5. The combustion of liquid fuels entails a distribution of 75% PM10 and 50% PM2.5.
Step 4: Comparison of the pollutant emissions calculated for each of the three cases with the reported emissions for the year 2009 The calculated emissions in the three cases described above were aggregated at Member State level. The theoretical emission reduction potential of NOX, SO2 and dust was then estimated by comparing with the reported LCP emissions for 2009.
Results and discussion
3 Results and discussion
Figure 3.1 Shares of fuel used (TJ) by
the 1 595 plants Figure 3.2 Distribution of the 'single fuel type' classification in the LCP dataset
Natural gas 47 %
Multi-fuel 23 % Other solid fuels: hard coal, lignite,
mixed coal 14 %
Liquid fuels 11 %
Biomass 4 %
Other gases: mostly blast furnace gas
1 % Biomass
3 %
Liquid fuels 4 %
Natural gas 35 % Other gases
2 % Hard coal
35 % Lignite
19 %
Mixed coal 2 %
This chapter presents and describes the assessment performed for each of the three pollutants NOX, SO2 and dust, and the estimated theoretical emission reduction potential of emissions at plant level.
3.1 Analysis of fuel type and use
Fuel type plays a key role in the interpretation and comparison between Member States of the 2009 emissions and in the calculation of the theoretical emission reduction potential. The ELVs are specified for different fuel types. Figure 3.1 shows that in 2009, 56 % 'other solid fuels' (in terms of thermal input (TJ)) and 35 % natural gas of the total fuel use were used by the selected 1 595 plants. The use of biomass, liquid fuels and other gases is much smaller, between 2 and 4 %. Using data from the EEPP dataset to determine the average distribution within the 'other solid fuels' group (hard coal, lignite, mixed coal) revealed that 63 % used hard coal, 34 % lignite and 3 % mixed coal. The use of biomass, liquid fuels and other gases is much
smaller, between 2 and 4 %. The biggest impact in reduction can therefore be expected for coal/lignite and natural gas.
Where a plant uses only one fuel type, a direct link to the emissions and the fuel type used is possible. However, where plants use a multi-fuel mixture, it is not possible to simply link emissions to just one fuel type since only total emissions per pollutant are available and fuels may be used either consecutively or simultaneously. If no fuel type makes up more than 95 % of the total fuel usage, the combustion plant is considered 'multi-fuel'. Figure 3.2 shows that coal and biomass represent the highest share in emissions as illustrated in the distribution of plants using different single fuel types.
Comparison of Figure 3.1 and Figure 3.2 shows that 35 % of the total fuel is natural gas, which is used by 47 % of the 1 595 plants. 'Other solid fuels' comprises 56 % of the total fuel, which is used by less than 37 % (i.e. 14 % plus the largest share (23 %) of the multi-fuel plants') of the total number of plants.
Results and discussion
This implies that gas plants normally have smaller thermal and electrical capacities than coal plants.
3.2 Comparison of 2009 NOX emissions with LCPD and IED ELVs and lower BAT AELs
The effect on NOX emissions corresponding to a hypothetical full implementation of the lower BAT AELs and the LCPD and IED ELVs has been estimated (Table 3.1). If the estimated emission limit (BAT, LCPD or IED) is higher than the 2009 plants emission, then the latter will be retained since this means that the current reported emissions are already lower than the respective limit values. The largest reduction (69 %) would be achieved if all plants reached the most stringent limit values from the lower BAT AELs. The least reduction (5 %) is related to the LCPD ELV.
The NOX emissions in 2004 analysed in the previous EEA report (EEA, 2008) for the EU-25 were 20 % higher than the LCPD ELVs whereas, in 2009, a similar comparison (again based on EU-25) shows emissions are only 6 % higher. It should be noted however that the two studies employ different methodologies, so any comparison of values should be undertaken carefully. This confirms that good progress has been made by Member States in reducing their emissions since the previous report. Germany, Poland and the United Kingdom have the highest reported 2009 NOX emissions from the selected LCPs (Figure 3.3). However, emissions reported by Germany are already consistent with all but the most stringent lower BAT AELs. Figure 3.3 also shows that for a number of Member States (Belgium, Germany, Hungary, Luxembourg, the Netherlands, Slovenia and Sweden), the potential emission reductions are almost the same when comparing the theoretical IED and LCPD ELVs. This suggests the 2009 emissions are close to or already below the limit values.
Table 3.1 Gap between 2009 NOX emissions and emissions based on the LCP emission limits, the IED emission limits, and the lower BAT AELs
Reported emissions
2009
Potential emissions based
on LCPD ELVs Potential emissions based on IED ELVs Potential emissions based on lower BAT AELs Emissions
(kt) Emissions (kt) compared to % reduction 2009 emissions
Emissions
(kt) compared to 2009 % reduction emissions
Emissions
(kt) compared to 2009 % reduction emissions
NOX 1 138 1 077 – 5 % 728 – 36 % 358 – 69 %
For the plants where the 2009 emission was already lower than the ELVs, the 'surplus reductions' (i.e. the emission reduction already achieved below the limit values) was calculated. These amounted to 1 155 kt for the LCPD, 190 kt for IED and 8 kt for lower BAT emission levels. The surplus reductions are negligible compared with the lower BAT AEL, implying that only a very limited number of plants already reach the lower BAT AEL. The surplus reduction already achieved compared with the LCPD ELVs is high for a number of Member States, especially for Czech Republic, Germany and Poland, which suggests that these Member States have more stringent ELVs than required or plants in any case operate below the level of the LCPD ELVs.
It is noted that a small number of very large plants account for a substantial share of the total emissions (Figure 3.4) with only 50 (or 3 %) of the 1 595 plants accounting for 50 % of emissions, and 454 (or 28 %) accounting for 90 % of emissions. Germany, Poland and the UK account for 27 of the largest emitting plants, together representing more than 30 % of the total EU-27 emissions. It is important to note, however, that a small number of large plants may actually be more efficient than smaller plants; the absolute magnitude of emissions from a plant does not necessarily inform on relative operating efficiencies.
In terms of the cross-checking performed of reported emissions, only 40 of the 50 plants representing 50 % of the NOX emissions could be linked to E-PRTR facilities. For 28 of these plants, there is little difference (+/– 5 %) between the two datasets; however, two plants (one each in Bulgaria and Greece) have reported emissions that are significantly greater than the E-PRTR facility at 32 % and 155 %, respectively (Table 3.2). The reasons for such significant differences are not clear.
Overall, the NOX emissions from the selected LCPs account for 85 % of the total E-PRTR 'Thermal power stations and other combustion installations' sector
Results and discussion
Figure 3.3 2009 NOX emissions (kt) compared with LCPD and IED emission limits, and the lower BAT AELs (1 595 plants)
NO X emissions (kt) 2009 5. 61 2. 95 0.6 4.2 74.8 9. 58 .0 33.1 14.8 174.1 76.2 13.7 13.6 67. 21 .0 2. 80 .5 2. 52 0.1 174. 62 3. 15 2.6 2.5 9.7 87.1 7.3 196. 4 LC P EL V 5. 21 2. 14 5.1 3.3 74.5 8. 98 .0 31.4 12.1 173.5 70.5 13.4 11.8 61. 60 .6 2. 80 .5 0. 72 0.1 174. 62 1. 45 0.5 2.4 9.7 74.7 7.2 180. 0 IE D EL V 5. 01 0. 92 6.6 2.0 58.4 8. 25 .9 21. 28 .4 169.7 37.6 12.8 7.9 53. 00 .5 1. 50 .5 0. 61 8.4 88.2 9. 53 1.4 1.9 8.5 45.5 6.8 86. 9 Lowe r BA T AE L 3.2 6.0 9. 10 .7 19.3 6. 12 .2 11. 84 .4 90.9 12.4 5.2 4.1 35. 20 .3 0. 70 .3 0. 21 2.7 37.5 5. 59 .9 0.8 2.1 22.7 5.7 49. 3 0 50 10 0 15 0 20 0 25 0 Austria Belgium Bulgaria Cyprus Czech Republic Denmark Estonia Finland France Germany Greece Hungary Ireland Italy Latvia Lithuania Luxembourg Malta Netherlands Poland Portugal Romania Slovakia Slovenia Spain Sweden United Kingdom
Results and discussion
emissions. A plant-by-plant comparison at Member State level was not possible because there is no official link between plants in the LCP dataset with E-PRTR facilities. This situation could be improved if Member States were to make an explicit link between the two datasets in order to enable a proper and accurate comparison of the reported emissions to be made. It is recommended that a link be created between these two datasets by encouraging the
Table 3.2 Plants with emissions significantly greater than the relevant E-PRTR facility
Country Plant name Plant
location company E-PRTR name
E-PRTR facility name
LCP NOX
(t) E-PRTR NO(t) X Difference (E-PRTR/ LCP) Greece PPC S.A. — Amyntaio ST
Ι-II
Amyntaio,
Florina PPC S.A. PPC S.A. SES AMYNTAIOY 10 909 4 270 – 155.5 %
Bulgaria TPP 'Bobov dol'
Golemo selo, municipality Bobov Dol, region Kyoustendil
TETS —
BOBOV DOL TETs 'Bobov dol' 6 378 4 840 – 31.8 %
Figure 3.4 Cumulative distribution of the NOX emissions under different scenarios (1 595 plants)
reporting of the E-PRTR National Identification Code when reporting to the LCP inventory under the IED.
In line with the amount of the different fuels used, coal-fired power plants ('other solid fuels') have the highest proportion of 2009 NOX emissions (63 %), and coal co-combustion plants ('multi-fuel' plants) account for 21 % of emissions.
NOX emissions (kt)
Number of plants
2009 emissions LCP ELV IED ELV Lower BAT AEL 50 percentile 75 percentile 90 percentile
0 200 400 600 800 1 000 1 200
Results and discussion
Table 3.3 Gap between 2009 SO2 emissions and emissions based on the LCP emission limits, the IED emission limits, and the lower BAT AELs
Reported emissions
2009
Potential emissions based
on LCPD ELVs Potential emissions based on IED ELVs Potential emissions based on lower BAT AELs Emissions
(kt) Emissions (kt) compared to % reduction 2009 emissions
Emissions
(kt) compared to 2009 % reduction emissions
Emissions
(kt) compared to 2009 % reduction emissions
SO2 1 662 876 – 47 % 572 – 66 % 98 – 94 %
3.3 Comparison of 2009 SO2 emissions with LCPD and IED ELVs and lower BAT AELs
The potential estimated effect of meeting the emission limits for SO2 is shown in Table 3.3. As described previously, if the estimated emission value (LCPD, IED and BAT) was higher than the 2009 emission then the latter was retained since this means that the current emission was already lower than the emission limits. The largest reduction (94 %) would be achieved if all plants reached the most stringent limit values of the lower BAT AEL and the least reduction (47 %) to the LCPD ELV.
Figure 3.5 Total 2009 SO2 emissions in the EU-25 and the EU-27 compared with LCPD and IED emission limits, and the lower BAT AELs
The previous report (EEA, 2008), which was based on 450 facilities from the 2004 EPER dataset, indicated that reported emissions of SO2 were 61 % above the estimated emission corresponding to the LCPD ELVs. Figure 3.5 shows the 2009 (EU-25) SO2 emissions were 39 % higher than the LCPD ELVs, a positive evolution compared to the earlier study based on 2004 data. The 2009 EU-27 emissions are 90 % higher than the LCPD ELVs largely due to the reported emissions from the two most recent EU Member States, Bulgaria and Romania, both of which report emissions
significantly above the SO2 LCPD ELV (Figure 3.6). It is important to note that both these Member States had derogations in place in 2009.
SO2 emissions (kt)
2009 emissions Lower BAT AEL IED ELV LCP ELV 0
200 400 600 800 1 000 1 200 1 400 1 600 1 800
Results and discussion
Figure 3.6 presents the SO2 emissions for 2009 compared with lower BAT AELs, LCPD ELVs and IED ELVs for each Member State. The highest SO2 emissions were reported by Bulgaria, Poland and Romania. Compared to the reported 2009 emissions, Bulgaria, Estonia (7), Greece and Romania would
achieve the largest reduction percentage (98–99 %) if the selected plants in these countries reached the lower BAT AELs. The largest reduction effort in absolute tonnes SO2 would have to be realised by Bulgaria, Greece, Poland and Romania.
For a number of Member States (Austria, Belgium, Germany, Hungary, the Netherlands, Portugal, Slovenia and Sweden), the reduction needed to reach the LCPD and IED ELVs is small. This means that the 2009 emissions are close to or already below the limit values for these Member States, which means that the 2009 emissions are retained and no further reduction can be realised. It is likely these Member States have ELVs that are more stringent than the LCPD and IED ELVs.
For the plants where the 2009 emission was already lower than the ELVs, the 'surplus' reduction was calculated. This amounted to 1 044 kt for LCPD, 236 kt for IED and 15 ktfor lower BAT. For many Member States, especially Czech Republic, Germany and the United Kingdom, the surplus reduction compared with the LCPD ELVs is high.
In the case of Germany, the large difference between the LCPD and IED ELVs, and the lower BAT AEL is two-fold. On the one hand, the lower BAT AEL with a SO2 concentration of 20 mg/Nm3 is extremely low.
On the other, the lower BAT AEL does not reflect the special situation of combustion plants fuelled with high-sulphur containing lignite (Umweltbundesamt, personal communication). The next revision of the LCP BREF will consider such issues.
Even much more than for NOX, a limited number of very large plants account for a large share of the total SO2 emissions. Only 20 (1 %) of the 1 595 plants represent 50 % of the total emissions, while 165 (10 %) represent 90 % of the emissions. Bulgaria, Greece and Romania account for 14 of the 20 largest emitting plants, together representing 76 % of the total emissions. All 20 plants could be linked to E-PRTR facilities and, for most, the reported emissions compared reasonably well. The exception was for four plants in Bulgaria, where
(7) In Estonia, oil shale is the main fuel type used by power plants. There is no emission limit value for oil shale so the 'mixed coal'
factor was used for the comparisons against the three emission limits.
for three plants the reported LCP emissions were only 63–80 % of those reported to E-PRTR and one, 'Toplofikatsia Sliven', where the emissions were 73 % higher than E-PRTR. This most likely represents an error in either the E-PRTR or the LCPD reporting.
The 2009 SO2 emissions from the 'other solid fuels' plants are the highest (73 %) of total emissions followed by the 'multi-fuel' plants (24 %), which are dominated by the coal co-combustion plants. Therefore, the largest reduction potential can be found in the 'other solid fuels' and 'multi-fuel' plants. SO2 emissions from natural gas, other gases and biomass are negligible. Liquid fuel emissions are low and decreasing not just because of the lower S-content of the fuel, but also because of the limited utilisation of liquid fuels in power plants (Figure 3.1 and Figure 3.2).
Results and discussion
Figure 3.6 2009 SO2 emissions (kt) compared with the LCPD and IED emission limits, and the lower BAT AELs (1 595 plants)
Austria Belgium Bulgaria Cyprus Czech Republic Denmark Estonia Finland France Germany Greece Hungary Ireland Italy Latvia Lithuania Luxem-bourg Malta Netherlands Poland Portugal Romania Slovakia Slovenia Spain Sweden United Kingdom SO 2 emissions (kt) 2009 1.4 2.5 308.5 13.3 93. 82 .7 40.7 20.1 16. 91 21. 51 88. 19 .8 15.7 51.5 0. 04 .2 0. 03 .5 5. 92 37. 07 .1 327. 03 .2 6. 06 6.8 2. 61 11. 8 LCP EL V 1.3 2.3 68. 97 .5 81. 22 .7 15.2 19.1 11. 31 21. 16 5.7 9. 87 .4 47.7 0. 01 .1 0. 00 .6 5. 91 85. 27 .1 68.7 3. 06 .0 44.1 2. 69 0.5 IE D EL V 1.4 1.9 30. 12 .4 56. 62 .4 7.4 14. 17 .6 119. 43 7.6 9. 03 .7 27.8 0. 00 .6 0. 00 .6 5. 99 8.7 7. 13 2. 61 .7 5. 63 2.4 2. 06 3.8
Lower BAT AE
L 0.7 0.6 3.7 1. 09 .9 1. 50 .9 5. 72 .3 25.6 4. 52 .1 0. 55 .5 0. 00 .3 0. 00 .2 2. 11 1.1 0. 93 .7 0. 30 .9 5. 11 .4 7. 5 0 50 100 150 200 250 300 350
Results and discussion
Reported emissions
2009
Potential emissions based
on LCPD ELVs Potential emissions based on IED ELVs Potential emissions based on lower BAT AELs Emissions
(kt) Emissions (kt) compared to % reduction 2009 emissions
Emissions
(kt) compared to 2009 % reduction emissions
Emissions
(kt) compared to 2009 % reduction emissions
Dust 77.6 55.1 – 29 % 28.2 – 64 % 16.4 – 79 %
Table 3.4 Gap between 2009 dust emissions and emissions based on the LCP emission limits, the IED emission limits, and the lower BAT AELs
3.4 Comparison of 2009 dust emissions with LCPD and IED ELVs and lower BAT AELs
The effect on dust emissions of a hypothetical full implementation of the LCPD and IED ELVs and the BAT AELs has been estimated and is presented in Table 3.4. As for the other pollutants, if the estimated value (LCPD, IED or BAT) was higher than the 2009 emission at plant level, the latter was retained since this means that the current emission was already lower than the LCPD, IED or BAT emission limits. Dust emissions were not analysed in the previous report so no comparisons with the earlier study are made.
A 79 % reduction would potentially be realised if all plants achieve emissions consistent with the lower BAT AELs, and a smaller reduction (29 %) by achieving the LCPD ELV (Figure 3.7).
Bulgaria, Greece, Poland and Romania have the highest 2009 dust emissions (Figure 3.7), which were still above the LCPD ELVs for dust by 2009. In moving toward emissions at the level of the IED ELVs, the largest reduction effort in tonnes of dust will have to be realised by Bulgaria, Estonia, Greece, Poland and Romania.
Since the health impact of dust and dust fractions (PM10 and PM2.5) differs largely, it was decided to estimate the dust fractions even though they are not directly available from the LCP dataset used in this study (Figure 3.8). Details of the simple approach used to estimate the PM2.5 and PM10 fractions is provided in the methodology section of this report.
The results show that PM10 emissions account for 82 % (range 75–88 %) of total dust emissions on average, and PM2.5 account for 54 % (range 40–67 %) on average. For the plants where the 2009 emission was already lower than the emission
limits, the 'surplus reduction' was calculated to be 170 kt for LCPD, 21 kt for IED and 4 kt for lower BAT AELs. The surplus reductions are small compared with the lower BAT AEL values and high compared with the IED ELVs.
As with NOX and SO2, a very limited number of very large plants account for a very large share of the total emissions. Only 21 (1 %) of the 1 595 plants represent 50 % of the total 2009 dust emissions, while 175 (11 %) plants represent 90 % of the emissions. Bulgaria, Greece and Romania account for 17 of the top 21 emitting plants and these 17 together represent 82 % of emissions from the top 21 pants, or 40% of total emissions.
The disaggregation of the emissions per fuel type was calculated by linking the emissions to the 'single fuel type' reported in the LCP dataset. The results show that very large coal ('other solid fuels') plants and coal co-combustion ('multi-fuel') plants account for most of the dust emissions with 69 % and 26 %, respectively. Dust emissions are negligible from natural gas and other gases fuel types, and those from liquid fuels are also low, because of the limited utilisation of liquid fuels in power plants (Figure 3.1 and Figure 3.2). The largest reduction potential can therefore be found in the 'other solid fuels' and 'multi-fuel' plants. The lower BAT AELs are strict for existing and new coal-using plants, and so the theoretical achievement of levels of emissions consistent with the AELs would yield high emission reductions.