Career and Technical Education Course Taking Patterns of High School Graduates: Exploring the Participation in the Most Frequent Sets of Occupational Areas
Abstract
We analyze the sets of occupational areas that are more frequently
explored by CTE “experimenter” students in order to understand whether those patterns provide them a more meaningful way of articulating skills that better respond to their interests and objectives. In conducting these analyses, we define CTE “experimenter” students as those taking three or more CTE credits but yet not meeting the standard Perkins requirement of focusing on at least three credits in one occupational area. In this
descriptive study we analyzed these patterns and relate them to their postsecondary enrollment in 2-year colleges. For this study, we analyze data from the Education Longitudinal Study of 2002.
In this study we analyze the high school course taking pattern of those students who choose to take credits in Career and Technical Education (CTE) while in high school and yet do not reach the required threshold to be considered a CTE concentrator (i.e., CTE “experimenters”). It has often been the center of debate the question of why such students decide to come close to being a CTE concentrator but fail to do so. Moreover, whether there is any value in being a CTE
experimenter while in high school is a matter of policy concern. With a little over a quarter of all CTE students making up this group of CTE experimenters, analyzing their course taking patterns and subsequently their choice of most frequent sets of occupational areas together can provide indications of how this particular student trajectory proceeds forward into postsecondary education and the world of work.
General Approach
Despite the numerous efforts presented by researchers during the past decades, the definition of what a CTE student is has been elusive given the different ways studies have defined a CTE student. At the center of that discussion has been the required amount of credits. While some have used in the past 4 credits as a threshold, other have been using 3 credits, and some states have only required 2 credits. A second criteria used for classification was that those credits had to be taken in a single specific labor market preparation area (SLMP). Nevertheless, these varying definitions have been used repeatedly for the purpose of analyzing the school behaviors and outcomes of CTE students.
Whatever definition has been used, research on CTE students has usually compared them , as a group, to the other groups of high school students, particularly the academic or college
preparatory group. Other studies have compared CTE students to those categorized in the “general” track, and less frequently to those in the “dual” concentration (Delci & Stern, 1999; Levesque et al, 2000; Stone & Aliaga, 2003).
Since the introduction of the most recent legislation on CTE and its accountability measures (the Carl D. Perkins Career and Technical Education Improvement Act of 2006, also known as
Perkins IV), the definition that has widely prevailed among researchers and policy-makers is that that considers as CTE concentrator any student taking 3 or more credits in a specific labor
market preparation area (SLMP).
Past research has focused and continues to focus on these CTE students—CTE concentrators. However, little has been done in terms of analyzing those students that are not CTE
concentrators and yet decide to take an important amount of credits in CTE—the CTE “experimenter” students.
Table 1
Career and Technical Education Course Taking of Public High School Graduates. ELS:2002 (Percentages)
CTE Credit Taking %
1 No CTE credits 8.0
2 More than 0 and less than 1 CTE credits, no occupational area fulfilled 7.5
3 1 CTE credit, no occupational area fulfilled 10.7
4 More than 1 and less than 3 CTE credits, no occupational area fulfilled 29.9
5 3 CTE credits, no occupational area fulfilled 7.6
6 More than 3 CTE credits, no occupational area fulfilled 19.6
7 3 CTE credits, 1 occupational area fulfilled 0.8
8 More than 3 credits, at least 1 occupational area fulfilled 16.0 N= 2,698,609
Source: Kotamraju, Aliaga, & Dickinson (2011)
A recent proposition, that presents a categorization that departs from the traditional perspectives, provides a more comprehensive and meaningful way of approaching the experiences of those students (Kotamraju, Aliaga, & Dickinson, 2011). Rather than resorting to categorization based on the four traditional “tracks” or curriculum concentrations, the new categorization is based on actual CTE course taking patterns. The idea behind that typology is that students, throughout their high school experience relate to different interests and exhibit different scholastic behaviors based on their goals and individual plans for their post-secondary trajectories. Since it is entirely based on the CTE experience, this typology does not reference to academic courses required for graduation, because the academic requirements have become more standardized for all students.
The typology proposed by Kotamraju, Aliaga, and Dickinson (2011) is based on two elements: First, the amount of credits students took in CTE. Second, whether they met the threshold of accumulating 3 or more CTE credits in at least one occupational area. For this purpose, the typology followed the 13 occupational areas reported in Levesque, Wun, and Greene (2010). Table 1 reports the different categories of students based on their CTE course taking patterns and whether those students have taken those credits in at least one occupational area or not. This study focuses on the following categories: students taking 3 CTE credits without fulfilling the requirements an occupational area (i.e., taking the 3 credits in a single occupational area), and those taking more than 3 CTE credits without fulfilling any area. The former represents 7.6% of the total graduates of public high schools, and the latter represents 19.6% of the total population of graduates. Combined, both groups represent 27.2% of the total graduates of public high schools.
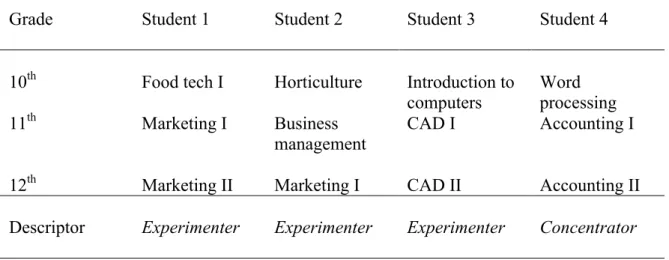
Table 2
Four students who take 3 credits of CTE: Who gets counted?
Grade Student 1 Student 2 Student 3 Student 4
10th Food tech I Horticulture Introduction to computers
Word processing
11th Marketing I Business
management CAD I Accounting I
12th Marketing II Marketing I CAD II Accounting II
Descriptor Experimenter Experimenter Experimenter Concentrator Adapted from: Stone and Aliaga (2007)
From policy, accountability and educational perspectives, this is a significant group of CTE “experimenter” students—over one-quarter of the total number of graduates (see categories 5 and 6 in Table 1). One issue that arises is whether the decision of taking the amount of CTE credits they take provides them any skills at all that can help them in their postsecondary experience, particularly if they choose to enter the world of work—but not only. Correspondingly, the second issue is whether by taking the CTE courses the way they do those students are actually responding to a more elaborate articulation that classifications cannot capture. In other words, whether the course taking patterns of the CTE “experimenter” students provide them a more meaningful way of articulating skills that better respond to their interests and objectives. Stone and Aliaga (2007) explored that same issue, indicating that the new way of categorizing students
will classify only Student 4 in Table 2 as a CTE student, yet Student 1, Student 2, and Student 3 could very well be packaging a CTE experience for their future labor market interests.
Purpose
The purpose of this study is to examine the course taking patterns and choices students take regarding CTE while in high school. Specifically, we examine the patterns associated with those students that decide to take 3 or more credits in CTE, and yet decide not to focus on an
occupational area—in other words, those students that decide to take 3 or more CTE credits in different occupational areas without reaching the threshold of accumulating those 3 credits (or more) in an occupational area. We labeled those students “CTE ‘experimenter’ students”. Current research establishes that for a student to be considered a CTE concentrator she or he needs to take 3 CTE credits or more in an occupational area.
Similarly, in this study we will explore the relationship between the set of patterns of occupational areas students select and enrollment in postsecondary education.
Research Questions In this study, we examined the following research questions:
1. What are the sets of occupational areas chosen by CTE “experimenter” students while in high school?
2. What is the relationship between those students in those patterns and their postsecondary education experience?
Data and Method
We conducted this descriptive study using data from the Education Longitudinal Study of 2002 (ELS:2002). The ELS:2002 has been described as a study that “follows a nationally
representative cohort of students from the time they were high school sophomores through the rest of their high school careers” and “continues to follow these students into postsecondary education and/or the labor market” (National Center for Education Statistics, 2010a). It is also a multilevel study, because it collects information from different respondent populations.
For this study, we used the Senior Cohort of 2004, which uses the sampled students in the Sophomore Cohort of 2002, and freshen up to include Seniors of 2004 (Ingels et al, 2007). In the analyses performed in this study, the reporting sample is only those graduates of public high schools, thus excluding students from private institutions.
We analyze data from the Base-Year, the First Follow-Up of 2004 and Second Follow-Up of 2006. Data used for this study contains information from surveys to students. However, the main features of these analyses are based on transcript data, which is data of restricted access. We use weighted data in order to calculate population estimates. In doing so, we use the strata, primary sampling unit, and weights information provided in ELS:2002.
Following Kotamraju, Aliaga, and Dickinson (2011) classification of CTE courses using the Classification of Secondary School Courses, or CSSC (National Center for Education Statistics, 2010b), we first compute the amount of total CTE credits—different courses CTE students take as identified in CSSC. Then, we categorize these total credits using the 13 occupational areas as reported by Levesque et al (2010).
Since our groups of interest are the students who took 3 CTE credits but did not fulfilled an occupational area, or those who took more than 3 CTE credits but also did not fulfilled an occupational area (27.2% of the total graduate students of public high schools), we include only them in our analyses (weighted N=733,003).
In this descriptive study we select the most common sets of occupational area combinations— which are based on course taking patterns—that have been the choice of at least one percent of the students. This requires working with a smaller sub-sample. We choose to do so since the aim for us in this study is to explore the basic relationships and associations for these groups.
Similarly, we use this approach in order to examine the enrollment in postsecondary education. Findings
When discussing the issue of CTE concentrator (hereafter, occupational concentrator), the two elements that are central are the amount of credits in CTE courses (3 credits or more), and that those credits are taken in an occupational area (usually following a sequence). This is supposed to build a set of skills that would eventually help with future plans around work or postsecondary education. In either case, certifications can also be issued on the basis of the type of
requirements related to the occupational area. This type of trajectory is related to current discussion about the value of programs of study (Lewis et al, 2010) and career pathways, which require focusing on an area and continuation in postsecondary programs.
In contrast, CTE experimenters (hereafter, occupational experimenters), take 3 credits in CTE courses or even more, but they do not focus on an occupational area. Instead, what they do is they take credits in courses in different occupational areas. Some may argue that there is a group of those students that do in fact take those credits in an occupational area in those states that require only 2 credits, but the issue remains—when examined from a more common perspective, they are occupational not concentrators. There is also the issue that in some districts little
availability of courses in an occupational area, and at the same time the availability of areas is small. Therefore, even if the student may wish to pursue a more structured and focused program, she or he may not be able to do so.
Therefore the question is whether they are building a set of skills that may be more meaningful to their own interests. But, what are they building? Is there any relationship between the occupational areas they choose?
To begin with, we examine the proportion of occupational experimenters that take courses in the different occupational areas. Data in Table 3 show the most prevalent occupational area is
Consumer Services, followed by Business Support and Management and Computer and Information Sciences.
Table 3
Proportions of Occupational Experimenter Students Taking Courses in Occupational Areas. ELS:2002 (Percentages)
Occupational Area Proportion
Agriculture and Natural Resources 17.7%
Business Finance 17.9%
Business Support and Management 56.9%
Communication and Design 43.2%
Computer and Information Sciences 55.4%
Construction and Architecture 10.7%
Consumer Services 57.7%
Culinary Arts 14.8%
Engineering Technology 21.7%
Health Sciences 14.3%
Manufacturing, Repair and Transportation 30.8%
Marketing 15.5%
Public Services 11.4%
N=733,003
To some extent that is not a surprise, since Consumer Services, Business Support and
Management, and Computer and Information Sciences have become more popular—and more available—across schools districts and states. Also, those are the areas for which there are more
options in postsecondary. Two-year colleges, but also 4-year colleges, have a better and larger offering in those areas so students can continue their education at the postsecondary education level. Similarly, industry and other private institutions (proprietary, in most cases) may offer certifications that do not require attendance to 2-year colleges.
Table 4
Most Frequent Combinations of Sets of Occupational Areas Among Occupational Experimenter Students in Public High Schools. ELS:2002 (Percentages)
Sets of Occupational Areas Combinations % Weighted N
Business Management, Computer Science, Consumer Services 1.88% 13746 Business Management, Communication, Consumer Services 1.78% 13054 Business Management, Communication, Computer Science,
Consumer Services
1.63% 11974
Communication, Computer Science, Consumer Services 1.59% 11646 Business Management, Communication, Computer Science 1.31% 9610
Business Management, Consumer Services 1.28% 9373
Computer Science, Consumer Services 1.15% 8460
Business Finance, Business Management, Computer Science, Consumer Services
1.03% 7540
Weighted N=733,009
As interesting, however, is to look at those occupational areas that have received little
participation, particularly Construction and Architecture, and Public Services and to some extent Culinary Arts, Health Sciences, Marketing, Agriculture and Natural Resources, and Business Finance. One argument that could once again made here is that in some districts there are no course offerings in those occupational areas. Also, areas like Business Finance maybe well related to Business Support and Management, thus resulting in a little proportion. There is a another possible explanation, which may point to the fact that if the students decide to take more credits in those particular areas they may decide to be fully compliant and become
concentrators—i.e., where they clearly see no value in staying as experimenters. That may be the case of Agriculture and Natural Resources, and Health Sciences, that show higher proportions of participation of occupational concentrators (Aliaga, 2011).
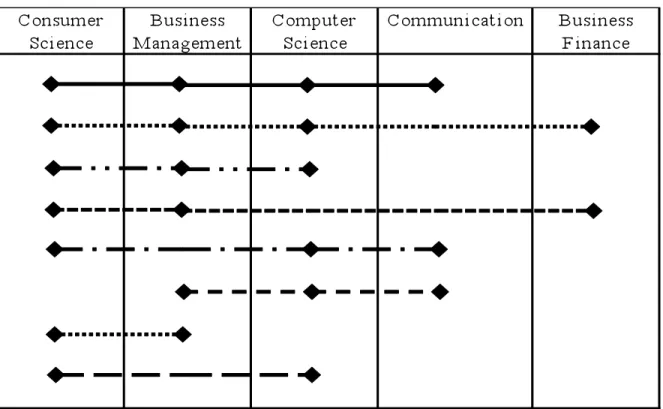
The choice of sets of occupational area combinations indicates there are eight sets of those combinations that are the most common among occupational experimenter students (see Table 4). Out of the eight sets of combinations, Consumer Services is present in seven of them, while Business Support and Management, and Computer and Information Sciences are present in six of them. Communication is present in four sets of combinations, and Business Finance is present in just one. Two of the eight sets of combinations involve four occupational areas, four connect three areas, whereas two sets relate two areas only.
Figure 1. Most Frequent Sets of Occupational Area Combinations Among Occupational Experimenter Students in Public High Schools. ELS:2002
The sets of combinations also reveal three of those sets involve the combination of three
occupational areas—Consumer Services, Business Support and Management, and Computer and Information Sciences (see Figure 1). Furthermore, the most frequent of all combinations occur between Consumer Services and Computer and Information Science—five sets of combinations. The second most frequent set of combination takes place between Business Support and
Management and Computer and Information Science.
What those sets of combinations are indicating is basically occupational experimenters do look to have a plan to articulate skills in complementary occupational areas. The recurrent emphasis on both Business Support and Management, Consumer Services, and Computer and Information
Sciences appear to suggest those students in this sub-group of most frequents sets would be trying to build programs that may be more related to their interests.
Table 5
Sets of Occupational Area Combinations and Postsecondary Outcomes of Occupational Experimenter Students in Public High Schools. ELS:2002 (Percentages)
CTE Sets of Occupational Area Combinations Less than 2-yr Enrolled in 2-yr College Enrolled in 4-yr College Weighted N
Business Management, Computer
Science, Consumer Services 32.4% 30.1% 37.5% 47,070
Business Management, Communication,
Consumer Services 27.5% 32.7% 39.8% 55,800
Business Management, Communication,
Computer Science, Consumer Services 25.2% 33.3% 41.4% 35,526 Communication, Computer Science,
Consumer Services 25.7% 31.5% 42.8% 47,479
Business Management, Communication,
Computer Science 14.8% 29.6% 55.6% 33,724
Business Management, Consumer
Services 31.9% 28.8% 39.2% 76,604
Computer Science, Consumer Services 32.5% 34.5% 33.0% 64,113 Business Finance, Business
Management, Computer Science,
Consumer Services 24.0% 23.1% 52.9% 25,845
Other CTE course-taking patterns 28.1% 28.4% 43.5% 343,880 Weighted N=730,041
In terms of enrollment in postsecondary education, findings are also revealing (see Table 5). In general, it appears to be this group of students are attending less than 2-year colleges, 2-year colleges, and 4-year colleges in about the same proportion—with notable exceptions, clearly. Those occupational experimenter students that more frequently have a set of combination that includes Computer and Information Sciences attend 4-year colleges in the largest proportion— which conversely is the group that attend less than 2-year colleges in the smallest proportion. Students in the sets of combination of four occupational areas are largely attending 4-year colleges, as are the group of other sets of combinations. The high enrollment of occupational concentrator and experimenter students in 4-year colleges has recently been analyzed
The largest proportion of those students attending 2-year colleges come from the set of
combination of Computer and Information Science, and Consumer Services, followed by those in Business Support and Management, Communication, Computer and Information Science, and Consumer Services.
Data indicate that enrollment in 2-year colleges for occupational experimenter students is a clear option for, generally speaking, a one-third of this group of students. That would also suggest that is that third of occupational experimenter students that may be building a program that fits their own interests.
Conclusions and Discussion
We started by saying that there is a significant group of students on which very little research has been done in the area of Career and Technical Education—those students taking 3 or more credits in CTE courses, yet failing to achieve the minimum requirement that those credits should focus on an occupational area in order to be considered an occupational concentrator. We have also stated that the high school experience of those students—called here occupational
experimenter students—in terms of the CTE credit taking may be responding to their interests, needs and plans for their postsecondary life.
One of the most important conclusions of this study is that the traditional definition of a CTE student needs to be modified, so as to be able to address the more complex experience of students while in high school. On the other hand, we can conclude that ignoring the caveats of the high school experience of the occupational experimenter students is not possible, and that on the contrary it requires continued work, starting as we have here with exploring their different high school pathways.
Based on the data analyzed in this study for that group of students, we can see that their
preferences are centered on those occupational areas that have expanded more and more rapidly in schools across the country. Similarly, the most frequent sets of combinations of occupational areas reveal the center role of participating in Consumer Services, Business Support and
Management, and Computer and Information Sciences. This may also reveal that tailoring a program according to their needs may be working for a smaller group of those students—not necessarily for all occupational experimenter students. If those individual plans were tied to their interest in postsecondary education in 2-year colleges, the analyses provided seem to indicate that that appears to be the case.
References
Aliaga, O. A. (2011, April). Career and technical education graduates and enrollment in 2-year colleges. Presentation at the Council for the Study of Community Colleges Annual Conference, New Orleans, LA.
Bersudskaya, V., Chen, X., & Hudson,L. (2011). Postsecondary and labor force transitions among public high school career and technical education participants. Issue Tables. Washington, DC: National Center for Education Statistics.
Delci, M., & Stern, D. (1999). Who participates in new vocational programs? A preliminary analysis of student data from NLSY97. Berkeley, CA: National Center for Research in Vocational Education.
Ingels, S. J., Pratt, D. J., Wilson, D., Burns, L. J., Currivan, D., Rogers, J. E., Hubbard-Bednasz, S., & Wirt, J. (2007). Education Longitudinal Study of 2002 (ELS:2002): Base-year to second follow-up data file documentation. Washington, DC: National Center for Education Statistics.
Kotamraju, P., Aliaga, O. A., & Dickinson, E. R. (2011, April). CTE accountability and evaluation: A comprehensive strategy for technical assistance. Presentation at the National Research Center for Career and Technical Education Spring Colloquium, Washington, DC.
Levesque, K., Lauen, D., Teitelbaum, P., Alt, M., Librera, S., & Nelson, D. (2000). Vocational education in the United States: Toward the year 2000. Washington, DC: National Center for Education Statistics.
Levesque, K, Wun, J., & Green, C. (2010, May). Science achievement and occupational career/technical education coursetaking in high school: The class of 2005. Statistics in Brief. Washington: National Center for Education Statistics.
Lewis, M. V., Alfeld, C., Hammond, C., Mobley, C., Withington, C., Sharp, J., Drew, S., Stringfield, S., Kosine, N., Castellano, M., Sundell, K., & Overman, L. T. (2010). Programs of study: Year 2 joint technical report. Louisville, KY: National Research Center for Career and Technical Education.
National Center for Education Statistics. (2010a). Education Longitudinal Study of 2002 (ELS:2002). Overview: Purpose. Retrieved November 16, 2010, from
http://nces.ed.gov/surveys/els2002/.
National Center for Education Statistics. (2010b). CSSC courses/Course codes. Retrieved October 18, 2010, from http://nces.ed.gov/surveys/hst/courses.asp.
Stone, J. R., III, & Aliaga, O. A. (2003). Career and technical education, career pathways, and work-based learning: Changes in participation 1997–1999. St. Paul, MN: National Research Center for Career and Technical Education.
Stone, J. R., III, & Aliaga, O. A. (2007, April). Re-defining career and technical education participation. Paper presented at the 2007 American Education Research Association Annual Meeting, Chicago, IL.