Legget al Discrepancies inthe calibration ofreaction rate analysers Many enzyme assays are linked to the formation or
utilisation of
NADH
so that reactionratescan be monitored at 340 nm. The absorbance spectrum of naphthol green is sufficiently different from that ofNADH
to render cali-bration using this substance undesirable, andNADH
or the particular chromophore used to monitor the reaction, e.g. p-nitrophenol, shouldbeused.The new calibration procedure confirmed the extent of the disparity between the two instruments noted when performing enzyme analyses and supportedtheviewthat the problem was one of instrumentation, possibly electronic in origin.
An
electronic calibration procedureproduced by the company was successful in bringing the instruments back into specification and cured the problem of the disparity betweenthe 0.05 and0.20 absorbance scales.Exactly what is accomplished when electroniccalibration is carried out remains uncertain. Certainly suchitemsas the ratio of the two absorbance scales and linearity across the recorder are correctly adjusted during this procedure, but the manner in which the photocell outputis linked to true absorbance is not clear. In the light of the authors’ experience, it is difficult to avoid the conclusion that electronic calibration merely succeededin ensuringthat both instruments investigated produced the same result. It may not ensure that the output froman instrument is linkedto true absorbance.
For this reason, a correction factormay still need to be applied to the results obtained after electronic and absorp-tiometric calibration has been carried out. It is suggested that results which are within +
5%
of the true absorbance need not be corrected, while instruments operating outside of these limits shouldhave a correction factorapplied untilthey can be serviced andthe error corrected. This may well depend on the type of analysis being performed on the instrument.
Thecalibration procedure outlinedcould be performed at intervals ofabout six months. It can be adapted tocalibrate any other type of reaction rate analyser and has been" used successfully in calibrating both the AKES (MSE Scientific
Instruments, Manor
Royal, Crawley,West Sussex),
and Centrifichem (Union Carbide(U.K.)
Ltd., MeteorHouse,
White Lion Road, Amersham, Bucks) systems. If such a proposal were generally adopted, better inter-laboratory agreement of enzyme results should occur.
For
future instruments, recommendations have been made which set veryhigh specifications.[5]
and which should renderfuture calibration amorepreciseandrapid exercise.ACKNOWLEDGMENT
Theauthorswould like to thankDr. H.G.Sammonsfor his interest and advice.
REFERENCES
[1] Instructionmanualto ReactionRateAnalyser2086 Appendix VIIILKBProdukterA.B.Sweden.
[2 Tietz,N. W.(Ed.), 1976, Fundamentals ofClinical Chemistry, 2ndEdition,W. B.Saunders&Co. Philadelphia.
[3] Moss, D.W.,1976,NewsSheetNo.159,Associationof Clinical Biochemists.
[4] Burke, R. W., Deardorff, E. R. and Menis, O. 1972, Liquid Absorbance Standards,J. Research. Nat. Bureau
of
Standards A.Physicsand Chemistry, 76A, 469.[5] Instrumentation Guidelines Study Group, 1977, Guidelines for photometric instruments for measuring enzyme reaction rates, Clinical Chemistry, 23,2160-2162.
An
evaluation
of
the
Nova
2
ionised
calcium instrument
J.A.
Fyffe, A.S.
JenkinsandH.N.
CohenUniversityDepartment
of
Medicine, Royal Infirmary, Glasgow G40SFF.J.
Dryburgh
andM.D.
GardnerDepartment
of
Biochemistry,Royal Infirmary, Glasgow G40SFIntroduction
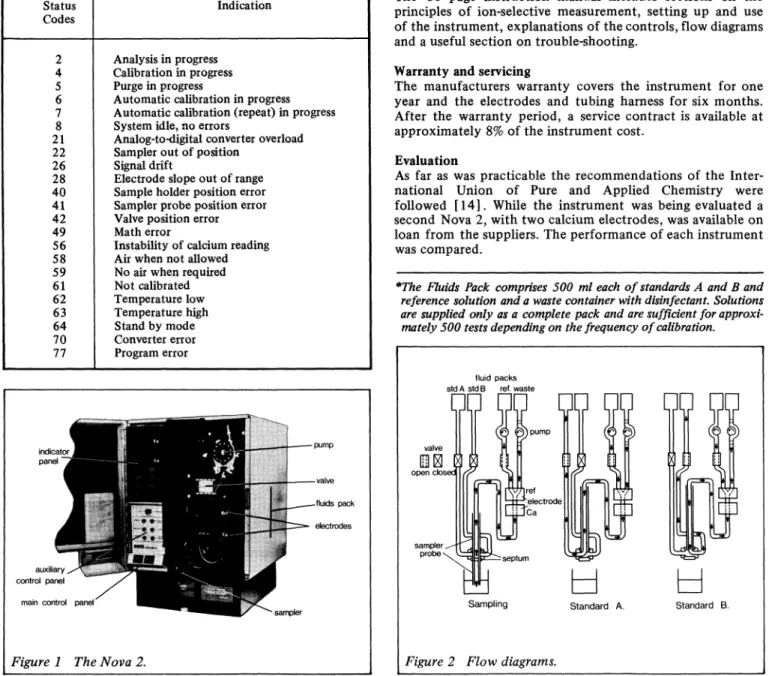
The hypothesis of McLean and Hastings [1] that free or ionised calcium is the physiologically active fraction of plasma calcium is now well accepted. Various methods of measuring this have been used including bioassay [1,2] bioluminescence [3,4] ultra-filtration [5] and ion-selective electrodes [6-13 I0n-selectiveelectrodes havebeen available for nearly twenty years and specific versions for use in the clinical laboratory for more than ten years. Many of these however have serious shortcomings. They are difficult to set up and have a short membrane life. Once set up they provide a simple and rapid measurement ofionised calcium. The Nova 2 instrument shown in Figure is manufact-ured byNovabiomedical,
Newton,
Mass. U.S.A.andmarketed in the United Kingdom by American HospitalSupply(U.K.) Ltd., Didcot, Oxon. The electrode assembly consists of a calcium selectiveelectrodeand a silver-silver chloridereference electrode with a KC1 bridge. Thecalciumselectiveelectrode is housed in a plastic box containing internal filling solution (calcium chloride) in a gel form. The standard and test solutions flow through the teflon tube whichpassesthrough the gel.In
the teflon tube is an ion-selective window whichacts as a membrane. The inner surface of thewindow is coated with a calciumpolyphosphateionexchangerin anon-aqueous medium.An
internalsilver/silver
chlorideelectrode connects the ion-selective electrode by a silver wire to the electronic circuit.The
silver/silver
chloride reference electrode consists of a silver wireembeddedin a silverchloride pellet. Theinternal reference aolution (2 M KC1) flows past this to meet the sample stream in a dynamic liquid junction. The reference electrode also incorporates a pair of platinum electrodes which sense the presence ofairor liquid and are usedbythe computer to monitor cycle performance. The electrodes are mounted by a simple plug-in device in aheated aluminium block which is maintained at a temperature of37C.
A
calcium electrode, a referenceelectrode and aspare calcium electrode (these are guaranteed forsix months use provided Nova fluids packs areused)are supplied withtheinstrument. The functions of the analyser arecontrolledby asmall in-built computer and selection of the ’calibrate’ or ’analyse’ cycle is by simple push buttons. The instrument has two operating modes,
’star’
and ’stand by’.In
the’star’
modetheinstrument automatically calibrates every two hours and is stated to be ready for immediate use. ’Stand by’ maintains temperature and slow circulation of fluidsin theanalytical section.
In
this mode, which is the more economical of reagents, it is necessaryto calibrate beforeusebut this takes onlyafewminutes.In
thecalibration
cycle, the computer controls andmonitors the flow of standards
A
andB (1.0
and 2.0mM
CaC12
respectively) and referencesolution(2M
KC1)
tothe electrodes.
To
maintain an ionic strength equivalent to thatofserum, the standards are dissolvedin 150mM
NaC1. Using the millivoltreadings ofthe two standards taken at a fixed time, the computer calculates acalibration line.Thisis compared with in-built criteria based on an unmodifiedNernst
equation and, if unsatisfactory, causes an error message to appear. If the slope and stability ofreadings are acceptable, the ’ready’ light comes on and the ’analyse’ cycle can be initiated. The first pushofthe ’analyse’ button causes the motor-driven probe to be presented and a second push aspirates the sample. The instrumentthen aspiratesstandardA
and uses the reading to alter the position (but not the slope) ofthe calibration line, if necessary, before calculatingTable 1
Nova
2instrumentstatuscodes Status Codes 2 4 6 8 21 22 26 28 40 41 42 49 56 58 59 61 62 63 64 70 Indication Analysis inprogress Calibrationinprogress PurgeinprogressAutomatic calibration inprogress
Automatic calibration(repeat)inprogress Systemidle,noerrors
Analog-to-digital converter overload Sampleroutof position
Signaldrift
Electrode slopeoutofrange Sample holder position error Sampler probe position error Valvepositionerror Matherror
Instabilityof calciumreading Air when not allowed Noairwhen required Notcalibrated Temperaturelow Temperaturehigh Standbymode Convertererror Programerror indicator panel pump pack electrodes auxiliary control panel
maincontrol panel
sampler
Figure 1 The
Nova
2.and presenting the result of the sample. This
aspiration
of standardA
also washes the sample through along with air segments.The probe has two sampling positions: in the first it aspirates from a syringe, capillary tube or open container and in the second willpierce the stopperofavacuum tube and, having vented thetube, will aspirate thesample. When retracted, standards
A
orB
can be sampled as shown in Figure 2.The flow of standard and reference solutions (providedin a Fluids Pack)* and air for segmentation is controlled and monitored by the computer via a variable speed peristaltic pump with planetary gears andafluidicvalve.
The sampler, electrodes and pump are connected by plastic tubing and the flow-through system, Figure 2, is designed so that the narrowest bore is in the probe. If a blockage occurs from fibrinthreads etc. it is easily removed from the probe. It is recommended that the tubing is changed everysix months and a complete systemis available from the manufacturers.
Results are displayed as mg/100 ml or
mmol/1.
As an alternative, the displays can showmV,
heating block temperature, electrode slope andinstrumentstatus code. The statuscodes of theinstrumentareshowninTable 1.Instructionmanual
The 80 page instruction manual includes sections on the principles of ion-selective measurement, setting up and use of the instrument,explanationsof thecontrols, flowdiagrams and a usefulsectionon trouble-shooting.
Warranty
and servicingThe manufacturers warranty covers the instrument for one year and the electrodes and tubing harness forsix months. After the warranty period, a service contract is availableat approximately
8%
of theinstrumentcost.Evaluation
As far as was practicablethe recommendations of the Inter-national Union of Pure and Applied Chemistry were followed 14]. While the instrument
was
beingevaluated a secondNova
2,with twocalciumelectrodes,wasavailableon loan from the suppliers. The performanceofeachinstrument wascompared.*The Fluids Pack comprises500 mleach
of
standardsAandBandreference
solution andawaste containerwithdisinfectant.Solutionsare suppliedonly asacompletepack and are
sufficient
for
approxi-mately 500 tests depending on the frequencyof
calibration.fluid packs
stdAstdB ref. waste
openalc
pump[I
"
ref
II II
II .:.:.eectroe
sampler probe septumSampling Standard A. Standard B.
Fyffe etal Evaluation of theNova2 ionisedcalcium instrument
Results
Aqueous
solutionsNo significant differencewasfoundinthe responseofanyof the four calcium electrodes to pure solutions whenused in eitherinstrument.
Calibration curve
A
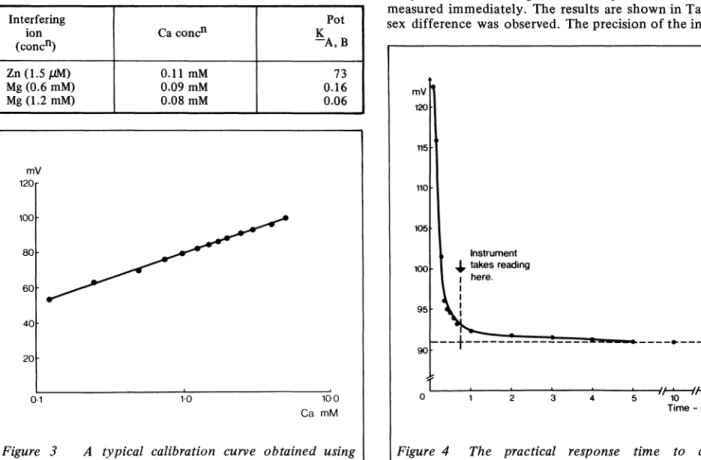
typical curve isshowninFigure 3 andis linear from 0.5 to 5.0 mM Ca. This covers the expected physiological range adequately. The calibration curve was preparedusing solutionsofCaC1:
in 150mM
NaC1.Limit
of
detection This was less than 0.05mM
for the electrodesexamined.Practical response time and
drift
These were measured by reading themVdisplayusing a 1.0mM
Castandard following an analyse cycle. The results are shown in Figure 4. The reading reaches90%
of its final value in approximately 33 seconds and theinstrumenttakesthereadingat44.5seconds. Stability isreachedafter 5minutesand thereafter the reading issteadyfor atleastafurther 10minutes.Interferingsubstances Potential interfering substances were selected following the criterion described byRobertson [5]. These were zinc, strontium, magnesium, barium, manganese, sodium and potassium. The effect of hydrogen ion was not studied as its relative concentration in blood
(nM)
would be expected to cause minimal interference. Since the standards supplied with theinstrument contain sodium (150 mM),the studies on the otherions were carried outon 150mM
NaC1 solutions.The electrodes responded to zinc (1.5
/aM),
and magnesium (1.2mM)
which gave apparent calcium results above the limit of detection for calcium. Responses for strontium (20/aM),
barium(20 /aM),
manganese (20/aM),
sodium (140 mM) and potassium (5mM) were below the detection limit for calcium. Further investigation of the Table 2. Potentiometricselectivity coefficients for electrode1
Interfering ion (conc
n)
Zn (1.5/aM) Mg(0.6mM) Mg(1.2 mM) Caconcn
0.11mM 0.09mM 0.08mM Pot K --A, B 73 0.16 0.06 mV 120 100 8O 6O 4O 2O 0.11’.0
10.0 Ca mMFigure 3
A
typical calibration curve obtained using solutionsof CaCl
in 150mMNaC1.effectsofzincand magnesium at approximately physiological levels were carried out using the fixed interference method where the e.m.f, of the cell is measured with solutions of constant level of interference
(Zn
1.5/aM, Mg0.6 and1.2mM) and varying concentration of calcium. The potentiometric co-efficientK
was calculated for each inter-selectivityfering ion and results for a typical electrode are shown in Table 2. While sodium (140 mM)didnot interfere abovethe detection limit for calcium and gave a very small
K
when used in the fixedinterference method, theappar’t’’calcium
result was increased by2-3%
on reducing the sodium concentration from the 150mM
used in the standards to 120 mM. Thismay be an ionicstrengtheffectsinceitiswell knownthat this alters the liquidjunctionpotential.The instrument does not compensate for alterations in liquid junction potential and the design of the instrument does not allowthisparameter to be investigated further. Precision The within batch coefficient of variation
(C.V.)
of a 1.5
mM
Ca standard was0.5%
andthat between batch was1.2%.
Blood,plasma and serum
Practical response time This was measured by detachingthe tubing from the probe and placing it in aserum sample so that serum wassampled at all stages of theanalytical cycle. The mV reading was taken as described above foraqueous standards and results for two electrodes are plottedin Figure 5. Compared with aqueous stardards the readingfell slowly andfailedto reachasteady rate evenafter45 minutes.Itwas not possible therefore tomeasurethe practical response time forserum.
In
contrastto their responses toaqueoussolutions, therewerealso marked differences between the two electrodes. Bloodfrom
laboratorystaff
Preliminarystudieswere carried out onhealthy laboratorystaffinthe age group 20-50 years.In
the first study (using one instrument only) heparinised blood samples (14 units lithium heparin/ml) were taken without venous stasis and measured immediately. The samples were centrifuged and the plasma ionised calcium measured immediately. The results are showninTable 3.No sex difference was observed. Theprecisionof theinstrument115 110 105 Instrument
I
takes reading 100 | here. 95. 0 2 3 4 5 10 15 Time mins Figure 4 standards.was established by dividing blood and plasma from asingle subject into 15 small containers. While thespecimens were not kept anaerobic, each was treated identically. Results are shownin Table4.
Duringthe next part ofthe study bothinstruments were used to establish provisional reference ranges. Blood was again taken from laboratory staff and analysed on each instrument. As well as heparinised blood and plasma, the ionised calcium of serum from blood which was allowed to clot for 30 minutes at room temperature was measured. Blood, plasmaand serum from eachsubjectwasavailableand these were analysedinduplicateon eachinstrumentwith less than minute delay between the measurements on each instrument. As no transport was involved,pH changes were minimised.The results(Table 5)showasignificant difference between the instrumentswhen measuringblood,plasma and serum and suggest that both. instrumentsgive results which vary with the type ofspecimen analysed. In orderto study this further,replicate specimens ofblood, plasma andserum from a single donor weremeasured onbothinstrumentsand the blood/plasma,
blood/serum
and plasma/serum results compared. All weresignificantly different(p<
0.001 ineach case) as shown in Table 6. The between instrument difference was again evident and on exchanging calcium selective electrodes between instruments it was established that thesedifferences were afunction of the electrodes. SamplesizeThis is quoted by the manufacturers as 350/al, however it was found to be larger (approximately 400 /al)in these experiments.
Subjective evaluation
The instrument was easy to use and robust. Duringtwelve months use no evidence was found of deterioration ofthe electrodes which appear to be unaffected by protein de-position. The electrodes are simple to change as they are merely plugged in, attached to the tubing harness and are ready to use as soon as they reach
37C
(about 10minutes). While the fluid packs are expensivethey containonly simple chemicals and could readily be prepared in the laboratory. The error code display, together with the table of status codes, obviates most spurious results which may arise(see
Table
1).
In the authors’ experience, most problems can be overcome by recalibration. The instructionmanual contains a large section on trouble-shootingbut this was not needed in this study. Difficulties were encountered when using vacutainers inthat standard solutions wereoccasionally sucked into the vacuum tube. This was due to a failure of the venting system which should fill the tube with air before theprobe aspiratesthe sample.Table 3.Results fromhealthy laboratorystaff
(Instrument 1)
n SD Range(+2SD) Blood 24 1.163 0.074 1.02 1.30 Plasma 24 1.083 0.061 0.96 1.20 II
40’
A mV 36 32 28 24 20 16 Serum electrode Serum electrode2 Aqueous solutiono
;
ao
20
Time minsFigure 5
Response
time to serum(two
electrodes) comparedwith aqueoussolution.Table4. PrecisionofInstrument1 Replicate analyseson blood andplasmafromasingle subject.
Blood Plasma 15 15 SD CV 1.226 0.036 2.9% 1.101 0.030 2.8%
Table 5. Betweeninstrument differences onresults from 20 subjects. Blood* Plasma** Serum* Instrument Range(+2SD) 1.16 1.06 1.26 1.07 1.00 1.14 1.16 1.11- 1.21 Instrument2 Range (+2SD) 1.24 1.13 1.32 1.09 1.00 1.17 1.21 1.15- 1.27 Pair difference test oneachgroupshowed that the between instru-ment differencesofreplicateswere significant
(*p
<
0.001 and**p<
0.1).Table6. Blood,plasma andserumfromasingle subject measuredontwoinstruments
20 18 15 Blood Plasma Serum 1.181 1.024 1.056 Instrument SD 0.021 0.017 0.007 CV 1.8% 1.7% 0.6% 19 20 20 Instrument2 1.253 1.073 1.101 SD 0.045 0.019 0.005 CV 3.6% 1.8% O.4%
Fyffe et al EvaluationoftheNova2ionised calcium instrument
Discussion
The authors were impressed by the speed and ease of use of the Nova 2. The electrodes appear robust and long lasting when compared with previous instruments [6-13 ]. The ion exchangerinthecalciumelectrodeisaffectedbythe presence ofmagnesium and zinc at physiologicallevels. Itissuggested that theseionsbeincluded inthe standards.
The practical response time is satisfactory for pure solutions but slow and variable for serum and this might account for the between electrode differences seen inTables 4 and5.
In the instruction manual the manufacturers quote the normal values found by Ladenson andBowers
[8]
measured at25C
on a’n Orion instrument and state thatthis range is for blood, plasma or serum thus taking no account of the heparin and erythrocyte effects, both of which are dis-cussed by these authors in the paper fromwhichthe normal range is quoted. Values obtained in this study clearly show the blood, plasmaandserumdifferences dueto these effects. The depression of free calcium by heparin, using aqueous calcium solutions, was also confirmed. The precision was less than the quoted 0.5% on blood and plasma and best on serum. To overcome these factors, specimen collection was standardised. Vacuum tubes were used without anti-coagulant. The blood was allowed to clot at room temperature and the serum sampled within anhour.A disquieting featureisthedifferencebetween electrodes. If this degree of change in measured values were to occur each time anelectrode wasreplaceditwould benecessaryto establish a reference range or a "correction factor" for each electrode. This was discussed with the manufacturers who have indicated that results on electrode response time are unacceptableand haveofferedto replacethe electrodes.
Whilst the reference ranges are ill defined, because they are derived from only a few subjects in a narrow age range, they compare well with those ofprevious authors [6,1 1,13,
16,17].
ACKNOWLEDGEMENT
The authorswish to acknowledge the financial support of theKidney Unit Fund, Glasgow Royal Inftrmary, towards the cost of the instrument.
REFERENCES
[1] McLean, F. C. and Hastings, A. B., Journal
of
Biological Chemistry,(1935),108,285.[2] Paupa,J.,These Medecine,Paris1955.
[3] Izutsu, K. T. and Felton,S.P.,ClinicalChemistry, 1972, 18, 77.
[4] Izutsu, K.T.,Felton,S.P.,Siegel,I.A.,Nicholls,J.I., Crawford, J., McGough, J. and Yoda,W. T.,Analytical Bio-chemistry, 1974, 58, 479.
[5] Robertson,W.G. and Peacock,M.,ClinicaChirnicaActa,1968, 20,315.
[6] Moore, E.W.,Journal
of
ClinicalInvestigation, 1970,49,318. [7] Pedersen, K. O., Scandinavian Journalof
ClinicalLaboratoryInvestigation, 1975,35,Supp1143, 57.
[8] Ladenson, J. H. andBowers, G.N.,Clinical Chemistry, 1973, 19,565.
[9] Ryden, S. E., Kirkish, L. S. and McCann, D. S.,American Journal
of
ClinicalPathology, 1976, 66, 634.[10] Fuchs, C., Dorn, D., Mclntosh, C. and Scheler, F., Clinica ChimicaActa, 1976, 67, 99.
[11] Madsen, S. and Olgaard, K., Clinical Chemistry, 1977, 23, 690.
[12] Fogh-Andersen, N., Christiansen, T. F., Komarmy, L. and Siggaard-Anderson,O.,ClinicalChemistry, 1978,24,1545. 13 Ferreira, P. and Bold, A. M., Journal
of
AutomaticChemistry,1979, 1, 94.
[14] IUPAC Information Bulletin,
1978,
No. 1, 29th General Assembly Council Meeting,Warsaw.15 Robertson, W.G.,Annals
of
Clinical Biochemistry, 1976, 13, 540.[16] Husdan, H., Leung, M., Orespoulos, D. and Rapoport, A.,
ClinicalChemistry, 1977, 23, 1775.
[17] Conceicao, S. C.,Ward,M.K.,Alvarez-Wde, F.,Aljamma,P., Smith,P. andKerr, D.N. S., ClinicaChimicaActa, 1978,86,
143.
Forthcoming
articles in
the Journal of Automatic Chemistry
The following papers are being considered for publication intheJournal ofAutomatic
Chemistry’-Anevaluation of theGemsaec centrifugalanalyser
Interfacing a titratortoamicrocomputerfor incrementalor continuousmodesofoperation
Direct flowautomatedserum iron determination Evaluation of the
LKB
Clinicon Chemcodesystem Anevaluationof the BeckmanAstra8 analyser Relative costingofanalytical systemsParticle counting immunoassay (PACIA) its application to thedeterminationof human placental lactogen
The flexible dialyser membrane a source of error in plasmacreatinine determination
An improved automated colorimetric analysis of fructose in fermentationmedia
An automated method for the determinationofbromide in water
A technical evaluation of the instrumentation laboratory Multistat analyser
Submit your manuscripts at
http://www.hindawi.com
Hindawi Publishing Corporation
http://www.hindawi.com Volume 2014 Inorganic Chemistry International Journal of
Hindawi Publishing Corporation
http://www.hindawi.com Volume 2014
Photoenergy
Hindawi Publishing Corporation
http://www.hindawi.com Volume 2014
Carbohydrate
Chemistry
International Journal of Journal ofChemistry
Hindawi Publishing Corporation
http://www.hindawi.com Volume 2014
Physical Chemistry
Hindawi Publishing Corporation http://www.hindawi.com Analytical Methods in Chemistry Journal of Volume 2014 Bioinorganic Chemistry and Applications
Hindawi Publishing Corporation
http://www.hindawi.com Volume 2014
Spectroscopy
International Journal ofThe Scientific
World Journal
Hindawi Publishing Corporationhttp://www.hindawi.com Volume 2014
Medicinal Chemistry Hindawi Publishing Corporation
http://www.hindawi.com Volume 2014
Chromatography Research International
Applied ChemistryJournal of
Hindawi Publishing Corporation
http://www.hindawi.com Volume 2014
Theoretical Chemistry Journal of
Hindawi Publishing Corporation
http://www.hindawi.com Volume 2014
Journal of
Spectroscopy
Analytical Chemistry
Hindawi Publishing Corporation
http://www.hindawi.com Volume 2014
Journal of
Hindawi Publishing Corporation
http://www.hindawi.com Volume 2014
Quantum Chemistry
Hindawi Publishing Corporation
http://www.hindawi.com Volume 2014
International
Electrochemistry
International Journal ofHindawi Publishing Corporation
http://www.hindawi.com Volume 2014