ABRAHAM MODEL CORRELATIONS FOR PREDICTING
GAS-TO-LIQUID PARTITION COEFFICIENTS AND ACTIVITY
COEFFICIENTS OF ORGANIC SOLUTES DISSOLVED IN
1-(2-METHOXYETHYL)-1-METHYLPYRROLIDINIUM
TRIS(PENTAFLUOROETHYL)TRIFLUOROPHOSPHATE
Rui Jiang
[a], Jared L. Anderson
[a], Timothy W. Stephens
[b], William E. Acree, Jr.
[b], and Michael
H. Abraham
[c]Keywords: chromatographic retention factors, partition coefficients, linear free energy relationships, ionic liquids.
Chromatographic retention factors were measured for 45 different organic solutes of varying polarity and hydrogen-bonding capability on an anhydrous 1-(2-methoxyethyl)-1-methylpyrrolidinium tris(pentafluoroethyl)trifluorophosphate, ([MeoeMPyrr]+[FAP]–), stationary
phase at both 323 K and 353 K. The experimental retention factor data were combined with recently published thermodynamic data for solutes dissolved in ([MeoeMPyrr]+[FAP]–) to give the corresponding gas-to-liquid partition
coefficients (log K). The water-to-anhydrous ([MeoeMPyrr]+[FAP]–) partition coefficients (log P) were also calculated using
published gas-to-water partition coefficient data for the solutes studied. The derived partition coefficients were analyzed in analyzed in accordance with the Abraham model. The Abraham model expressions that were obtained in the present study back-calculate the observed 105 log K and 102 log P values to within a standard deviation of 0.14 and 0.16 log units, respectively.
* Corresponding Authors Fax: 1-940-565-4318 E-Mail: [email protected]
[a] Department of Chemistry, The University of Toledo, 2801 W. Bancroft Street MS 602, Toledo, OH 43606 (USA). [b] Department of Chemistry, 1155 Union Circle Drive #305070,
University of North Texas, Denton, TX 76203-5017 (USA). [c] Department of Chemistry, University College London, 20
Gordon Street, London, WC1H 0AJ (UK).
Introduction
Ionic liquids (ILs) represent a novel class of non-molecular solvents exhibiting unique physical properties including high thermal stabilities, wide viscosity ranges, negligible vapor pressures, and varying solubilizing abilities that result from solvation interactions between the dissolved solute and surrounding solvent ions. The physical properties of ILs can be fine-tuned through judicious selection of the cation-anion pair combination and by introducing select functional groups into the structure of the IL, thus enabling one to design IL solvents for task-specific applications. Ionic liquids are employed numerous commercial manufacturing and engineering applications ranging from reaction solvent media for chemical syntheses, to stationary phases for gas chromatographic chemical separations, to liquid matrices for concentrating/isolating organic compounds in dispersive liquid-liquid micro-extractions, and to absorbent materials for removal of carbon dioxide, sulfur dioxide and ammonia from flue gases. Experimental studies have shown that the IL anion plays an important role in determining carbon dioxide adsorption, with fluorination serving to increase the solubility of CO2. For three ionic
liquid solvents having the common 1-butyl-3-methyl-
imidazolium cation, [BMIm]+, Gonzalez-Miguel et al.1
reported that carbon dioxide solubility increased with decreasing solution temperature, and followed the trend of ([BMIm]+[FAP]–) > ([BMIm]+[Tf
2N]–) > ([BMIm]+[PF6]–),
where [FAP]–, [Tf2N]–, and [PF6]– correspond to the tris(pentafluoroethyl)trifluorophosphate, bis (trifluoro-methanesulfonyl)imide, and hexafluorophosphate anions, respectively.
The solvation parameter model, developed by Abraham and co-workers2,3, has been used successfully to describe the
solubilising properties of traditional organic solvents3-9,
binary aqueous-ethanol solvent mixtures,10,11
aqueous-micellar surfactant solutions12,13, and several different
classes of ILs14-28. For IL solvents, Sprunger et al.16-18
expressed the logarithm of the water-to-ionic liquid partition coefficient, log P:
log P = cp,cation + cp,anion + (ep,cation + ep,anion)E
+ (sp,cation + sp,anion)S + (ap,cation + ap,anion)A
+ (bp,cation + bp,anion)B + (vp,cation + vp,anion)V (1)
and logarithm of the gas-to-ionic liquid partition coefficient, log K:
log K = ck,cation + ck,anion + (ek,cation + ek,anion)E
+ (sk,cation + sk,anion)S + (ak,cation + ak,anion)A
to include ion-specific equation coefficients. Numerical values of the two sets of equation coefficients are calculated as a paired cation-anion sum (e.g., cp,cation + cp,anion, ep,cation +
ep,anion, etc.) by regression analyses of experimental log P
and log K data for solutes having known solute descriptors in accorance with Eqns. 1 and 2. Solute descriptors are the capitalized quantities in the log P and log K expressions. To calculate equation coefficients for an individual ion, one must know the equation coefficients for the other ion in the IL. In other words, to calculate cp,cation the value of ck,anion
must be known, and vice versa. Numerical values of the first sets of ion-specific equation coefficients were obtained by setting the six coefficients of the [Tf2N]– anion equal to
zero. In many respects this is analogous to setting a reference point for calculating thermodynamic properties of single ions. To date equation coefficients have been published for 21 different cations and 14 different anions.
As noted above the capitalized letters on the right-hand side of Eqns. 1 and 2 are solute descriptors that describe the properties of the partitioned probe molecule. The solute descriptors are defined as follows: E denotes the solute excess molar refraction in units of cm3 mol-1/10 computed
from the solute’s refractive index; S corresponds to a combined dipolarity/polarizability descriptor; A and B
describe the overall hydrogen-bond donor and acceptor properties of the solute, respectively; V is the McGowan characteristic molecular volume in units of cm3 mol-1/100;
and L is the logarithm of the solute’s gas-to-hexadecane partition coefficient measured at 298 K. Solute descriptors when multiplied by the complementary solvent equation coefficient quantifies a given type of solute-solvent interaction. For example, the (ap,cation + ap,anion)A and (ak,cation
+ ak,anion)A terms in Eqns. 1 and 2 describe the hydrogen-bonding interactions between the H-bond donor sites on the solute and the H-bond acceptor sites on the solvent, while the (bp,cation + bp,anion)B and bk,cation + bk,anion)B terms involve interactions between the solute H-bond acceptor sites and solvent H-bond donor sites. Thus far solute descriptors have been determined for several thousand different organic compounds and inert gases from measured water-to-organic solvent partition coefficient data, from measured solubility data in organic solvents, from experimental infinite dilution activity coefficient for solutes dissolved in organic solvents, from measured Henry’s law constants, and from experimental gas chromatographic and high-performance liquid chromatographic retention factors. The calculation procedures for determining solute descriptors from available experimental are described in detail elsewhere.2,3,29-33
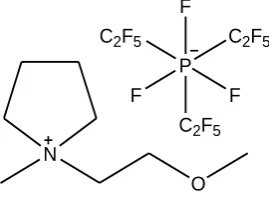
In the present communication, we report experimental gas-liquid chromatographic retention factor data for a set of 45 chemically diverse organic solutes on a 1-(2-methoxyethyl)-1-methylpyrrolidinium tris (pentafluoroet-hyl)trifluorophosphate, ([MeoeMPyrr]+[FAP]–), stationary
phase at 323 K and 353 K. See Figure 1 for the molecular structure of the ionic liquid solvent. Results of the chromatographic measurements are combined with the recently published gas-to-liquid partition coefficient data of Marciniak and Wlazlo34 for volatile organic solutes
dissolved in ([MeoeMPyrr]+[FAP]–) to derive Abraham
model log P correlations at 298 K and Abraham model log
K correlations at both 298 K and 323 K. As an information note Marciniak and Wlazlo determined the Abraham model log K correlations for ([MeoeMPyrr]+[FAP]–) at 318, 328,
338, 348, 358 and 368 K based on 62 probe molecules.
The authors did not report the log P correlation, nor did the authors give the ion-specific equation coefficients for the 1-(2-methoxyethyl)-1-methylpyrrolidinium cation. To our knowledge no one has yet reported equation coefficients for [MeoeMPyrr]+.
Figure 1. Molecular structure of 1-(2-methoxyethyl)-1-methylpyrrolidinium tris(pentafluoroethyl)trifluorophos-phate.
We further note that the datasets used in the present communication do contain a more chemically diverse set of probe molecules. The dataset used by Marciniak and Wlazlo34 did not contain the more acidic phenolic and
carboxylic acid solutes (solutes with larger A values) and the lesser volatile organic compounds considered here. An often voiced criticism in using derived log P and log K
correlations to predict values for additional solutes is that one should not make predictions for solutes whose descriptor values fall outside of the range of chemical space used in determining the equation coefficients.
By including the more acidic and less volatile solutes we were able to increase the expanse of predictive chemical space covered by the log P and log K predictive equations.
Experimental Methods and Partition Coefficient
Datasets
The sample of 1-(2-methoxyethyl)-1-methylpyrrolidinium
tris(pentafluoroethyl)trifluorophosphate studied in the present investigation was kindly donated as a gift from Merck KGaA (Darmstadt, Germany). The IL stationary phase was coated onto untreated fused silica capillary columns (5 m x 0.25 mm) purchased from Supelco (Bellefonte, PA). The IL coating solutions were prepared in dichloromethane using a 0.45% (w/v) concentration of ([MeoeMPyrr]+[FAP]–).
Forty-five (45) probe molecules were selected for the characterization of the ([MeoeMPyrr]+[FAP]–) stationary
phase. The names of the solutes, along with the chemical purities and suppliers, are given in Table 1. All solute molecules were used as received from the suppliers. The presence of trace impurities in the solutes would in no way affect the experimental results because the main chromatographic peak was easily distinguished from any minor impurity peak by its much larger intensity.
F
P
C2F5
C2F5 C2F5
F F
N
Table 1. List of organic solutes, chemical suppliers, and chemical purities
Solute Suppliera Purity
Acetic acid Supelco 99.7%
Acetophenone Sigma-Aldrich 99% Aniline Sigma-Aldrich 99.5% Benzaldehyde Sigma-Aldrich 99+% Benzene Sigma-Aldrich 99.8% Benzonitrile Sigma-Aldrich 99% Benzyl alcohol Sigma-Aldrich 99% 1-Bromooctane Sigma-Aldrich 99% 1-Butanol Fisher Scientific 99.9% Butyraldehyde Acros Organics 99% 2-Chloroaniline Sigma-Aldrich 98% 1-Chlorobutane Sigma-Aldrich 99% 1-Chlorohexane Sigma-Aldrich 99% 1-Chlorooctane Sigma-Aldrich 99%
p-Cresol Fluka 99%
Cyclohexanol J.T. Baker 99% Cyclohexanone Sigma-Aldrich 99.8% 1,2-Dichlorobenzene Sigma-Aldrich 99% N,N-Dimethylformamide Fisher Scientific 99.9% 1,4-Dioxane Sigma-Aldrich 99.8% Ethyl acetate Fisher Scientific 99.9% Ethylbenzene Eastman Kodak Co 95+% 1-Iodobutane Sigma-Aldrich 99% Methyl caproate Supelco 98%
Naphthalene Supelco 98%
Nitrobenzene Sigma-Aldrich 99+% 1-Nitropropane Sigma-Aldrich 99% 1-Octanol Sigma-Aldrich 99+% Octylaldehyde Sigma-Aldrich 99% 1-Pentanol Sigma-Aldrich 99+% 2-Pentanone Sigma-Aldrich 99+% Phenetole Sigma-Aldrich 99%
Phenol Sigma-Aldrich 99+%
Propionitrile Sigma-Aldrich 99% Pyridine Sigma-Aldrich 99.9%
Pyrrole Sigma-Aldrich 98%
Toluene Fisher Scientific 99.8%
m-Xylene Fluka 99.5%
o-Xylene Fluka 99.5%
p-Xylene Fluka 99.5%
2-Propanol Fisher Scientific 99.6 % 2-Nitrophenol Acros Organics 99% 1-Bromohexane Sigma-Aldrich 98%
Propanoic acid Supelco 99%
1-Decanol Sigma-Aldrich 99+% a Acros Organics (Morris Plains, NJ, USA); Eastman Kodak Company (Rochester, NY, USA); Fisher Scientific (Pittsburgh, PA, USA); Fluka (Steinheim, Germany); J.T. Baker (Phillipsburg, NJ, USA); Sigma-Aldrich (St. Louis, MO, USA); and Supelco (Bellefonte, PA, USA).
Chromatographic retention factors, k, were determined on a ([MeoeMPyrr]+[FAP]–) stationary phase at both 323 K and
353 K as part of the present investigation. The percent relative standard deviation (% RSD) in the experimental retention times for all solutes included in the present study was less than 1 %. The stationary phase integrity during the
course of the experimental measurements was verified by periodically monitoring the efficiency and retention factor of the naphthalene separation. The experimental log k values are tabulated in the second and third columns of Table 2. The log k values are 298 K were obtained from a linear plot of log k versus 1/T based on the measured data at 323 K and 353 K.
Table 2. Chromatographic retention factor data for solutes on 1-(2-methoxyethyl)-1-methylpyrrolidinium tris (pentafluoroethyl)-trifluorophosphate, ([MeoeMPyrr]+[FAP]–), stationary phase at 298, 323 and 353 K
Solute logk,
323 K
logk, 353 K
logk, 298 K
Acetic acid 0.409 -0.124 0.935 Acetophenone 2.110 1.412 2.800
Aniline 2.115 1.407 2.814
Benzaldehyde 1.616 0.992 2.231 Benzene -0.017 -0.439 0.399 Benzonitrile 1.781 1.152 2.403 Benzyl alcohol 2.094 1.368 2.811 1-Bromooctane 0.830 0.236 1.417 1-Butanol 0.097 -0.379 0.567 Butyraldehyde 0.057 -0.372 0.480 2-Chloroaniline 2.190 1.483 2.889 1-Chlorobutane -0.554
1-Chlorohexane 0.028 -0.439 0.490 1-Chlorooctane 0.607 0.038 1.169
p-Cresol 2.078 1.348 2.800 Cyclohexanol 0.865 0.293 1.430 Cyclohexanone 1.341 0.771 1.903 1,2-Dichlorobenzene 0.997 0.441 1.545 N,N-Dimethylformamide 1.869 1.245 2.486 1,4-Dioxane 0.528 0.026 1.024 Ethyl acetate 0.103 -0.360 0.561 Ethylbenzene 0.564 0.026 1.096 1-Iodobutane -0.123 -0.545 0.295 Methyl caproate 0.957 0.352 1.555 Naphthalene 2.195 1.492 2.889 Nitrobenzene 2.018 1.363 2.665 1-Nitropropane 0.926 0.406 1.439 1-Octanol 1.281 0.614 1.939 Octylaldehyde 1.244 0.612 1.866 1-Pentanol 0.412 -0.104 0.920 2-Pentanone 0.548 0.050 1.040 Phenetole 1.308 0.680 1.928
Phenol 1.769 1.094 2.434
Propionitrile 0.529 0.079 0.973 Pyridine 0.715 0.214 1.210
Pyrrole 1.290 0.688 1.884
Toluene 0.313 -0.172 0.792
m-Xylene 0.639 0.096 1.175
o-Xylene 0.748 0.194 1.294
p-Xylene 0.607 0.068 1.140 2-Propanol -0.414
The thermodynamic gas-to-ionic liquid partition coefficient, K, can be calculated from isothermal chromatographic measurements through K = VN/VL, where VN is the volume of the carrier gas needed to elute the solute,
and VL is the volume of the ionic liquid present as the
stationary phase.35 The retention factor, is defined as k = (t r
- tm)/tm,35 where tr is the retention time of the solute under
consideration and tm is the “void” retention time for an
unretained solute, which in the present study was methane. The corrected retention time, tr – tm, is directly proportional
to the corrected elution volume VN, hence the gas-to-ionic
liquid partition coefficients and retention factors on the ionic liquid stationary phase are related to each other through,
K = P* · k or log K = log P* + log k (3)
The proportionality constant in Eqn. 3, P*, is the phase ratio and depends only upon the chromatographic conditions. The numerical value of P* should remain essentially constant for a given column during the time that it takes to perform the experimental measurements.
Thermodynamic gas-to-liquid partition coefficients are required to compute the proportionality constants needed in Eqn. 3 for converting the observed log k values in Table 2 to log K data. Marciniak and Wlazlo34 recently published
infinite dilution activity coefficients, γsolute∞, and gas-to-IL
partition coefficients, K, of water and 61 organic solutes dissolved in ([MeoeMPyrr]+[FAP]–) at six temperatures
from 318 K to 368 K. Experimental uncertainties in the measured values K and γsolute∞ were reported to be less than
3 %. The published experimental data were extrapolated to 298 K and 323 K by assuming linear ln K versus 1/T
relationship. There should be very little uncertainty in the extrapolated values because the experimental measurements were performed not too far removed both desired temperatures, less than in 20 K in most instances. The proportionality constants needed in the Eqn. 7, log P* = 2.588 for 298 K and log P* = 2.526 for 323 K, for ([MeoeMPyrr]+[FAP]–) were the calcualted average between
the measured log k and log K values for 13 common organic comounds (e.g., benzene, toluene, ethylbenzene, m-xylene,
o-xylene, p-xylene, 1-butanol, 1,4-dioxane, ethyl acetate, butyraldehyde, 1,4-dioxane, 2-pentanone, 1-nitropropane, and pyridine) in the IL data set that were studied by both us and Marciniak and Wlazlo. The log P* values for each individual solute differed from the average values by less than ± 0.03 log units, further suggesting that the proportionality constants did remain constant during the course of the experimental measurements.
The Abraham model also describes solute transfer between two condensed phases, and in the case of IL solvents it is possible to construct a solute transfer process between water and the anhydrous IL solvent. The transfer process is akin to a partitioning process (or more specifically a hypothetical partitioning process) wherein the ionic liquid and water are not in physical contact with each other. In a direct practical partitioning process the two phases would be in physical contact, and the solute would be distributed between an aqueous phase (saturated with the IL solvent) and an IL phase (saturated with water). For some partitioning systems the organic solvent and water are almost completely immiscible with each other, and the presence of trace water in the organic solvent and trace organic solvent dissolved in water has a negligible affect on
the solute’s partitioning behavior. In other words, the direct practical partition coefficient and indirect hypothetical partition coefficient are nearly identical. There has been insufficient experimental studies on ionic liquid solvents to reach any meaningful conclusions at the present time. Hypothetical indirect partition coefficients are still useful in that predicted log P values can be converted to log K and
γsolute∞ values through standard thermodynamic relationships
log K = log P + log Kw (4)
and
(5)
where Kw is the solute’s gas-to-water partition coefficients, Psoluteo is the vapor pressure of the organic solute at the
system temperature (T), Vsolvent is the molar volume of the IL
solvent, and R is the universal gas constant. The solutes’ gas phase partition coefficients into water (KW) needed for these calculations are given elsewhere.15
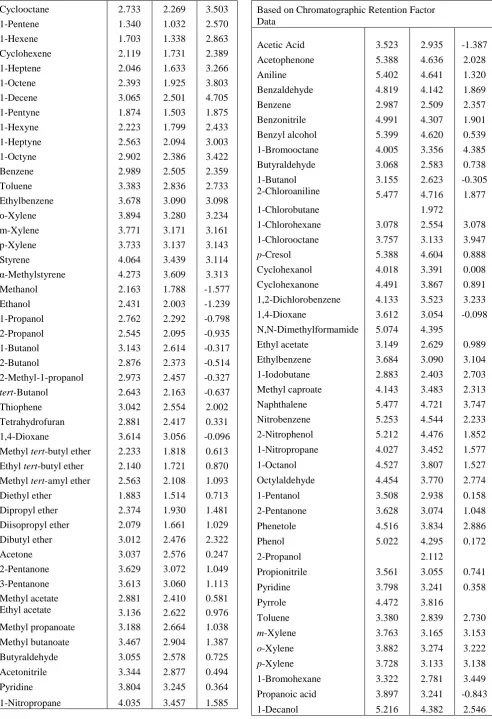
The calculated log K and log P values are compiled in Table 3 for solutes dissolved in ([MeoeMPyrr]+[FAP]–).
Log P values are tabulated only for 298 K as we do not have experimental values for the solutes’ gas-to-water partition coefficients, log Kw, at 323 K. The log Kw values that we
have compiled thus far pertain to gas-to-water partitioning at 298 K36 and 310 K.37 We have listed in Table 4 the
numerical solute descriptors for the 92 different organic compounds examined in the present communication. The solute descriptors are of experimental origin, and were determined from experimental gas-liquid and high-performance liquid chromatographic retention factor data, from measured solubility data and Henry’s law constants, and from observed practical partition coefficient measurements for the equilibrium solute distribution between water and an organic solvent.
Table 3. Logarithm of the gas-to-anhydrous IL partition coefficient, log K at 298 K and 323 K and logarithm of the water-anhydrous IL partition coefficient, log P, at 298 K for organic solutes dissolved in ([MeoeMPyrr]+[FAP]–)
Solute log K,
298 K
log K, 323 K
log P, 298 K
Based on Thermodynamic Data
Pentane 1.104 0.816 2.804 Hexane 1.449 1.120 3.269
3-Methylpentane 1.416 1.099 3.256 2,2-Dimethylbutane 1.261 0.966 3.101
Heptane 1.797 1.416 3.757 Octane 2.153 1.711 4.263
2,2,4-Trimethylpentane 1.831 1.446 3.951 Nonane 2.483 1.999 4.633
Decane 2.826 2.290 5.146 Cyclopentane 1.480 1.173 2.360
Cyclohexane 1.809 1.460 2.709 Methylcyclohexane 2.006 1.631 3.256 Cycloheptane 2.291 1.886 2.871
log log W log ( )
solute solute solven o
RT
P K
P V t
Table 3 (cont.)
Cyclooctane 2.733 2.269 3.503
1-Pentene 1.340 1.032 2.570 1-Hexene 1.703 1.338 2.863 Cyclohexene 2.119 1.731 2.389 1-Heptene 2.046 1.633 3.266 1-Octene 2.393 1.925 3.803 1-Decene 3.065 2.501 4.705 1-Pentyne 1.874 1.503 1.875
1-Hexyne 2.223 1.799 2.433 1-Heptyne 2.563 2.094 3.003 1-Octyne 2.902 2.386 3.422 Benzene 2.989 2.505 2.359 Toluene 3.383 2.836 2.733 Ethylbenzene 3.678 3.090 3.098 o-Xylene 3.894 3.280 3.234 m-Xylene 3.771 3.171 3.161
p-Xylene 3.733 3.137 3.143 Styrene 4.064 3.439 3.114 α-Methylstyrene 4.273 3.609 3.313 Methanol 2.163 1.788 -1.577 Ethanol 2.431 2.003 -1.239 1-Propanol 2.762 2.292 -0.798 2-Propanol 2.545 2.095 -0.935 1-Butanol 3.143 2.614 -0.317 2-Butanol 2.876 2.373 -0.514
2-Methyl-1-propanol 2.973 2.457 -0.327
tert-Butanol 2.643 2.163 -0.637 Thiophene 3.042 2.554 2.002 Tetrahydrofuran 2.881 2.417 0.331 1,4-Dioxane 3.614 3.056 -0.096 Methyl tert-butyl ether 2.233 1.818 0.613 Ethyl tert-butyl ether 2.140 1.721 0.870
Methyl tert-amyl ether 2.563 2.108 1.093 Diethyl ether 1.883 1.514 0.713 Dipropyl ether 2.374 1.930 1.481 Diisopropyl ether 2.079 1.661 1.029 Dibutyl ether 3.012 2.476 2.322 Acetone 3.037 2.576 0.247 2-Pentanone 3.629 3.072 1.049 3-Pentanone 3.613 3.060 1.113 Methyl acetate 2.881 2.410 0.581 Ethyl acetate 3.136 2.622 0.976
Methyl propanoate 3.188 2.664 1.038
Methyl butanoate 3.467 2.904 1.387 Butyraldehyde 3.055 2.578 0.725
Acetonitrile 3.344 2.877 0.494 Pyridine 3.804 3.245 0.364
1-Nitropropane 4.035 3.457 1.585
Based on Chromatographic Retention Factor Data
Acetic Acid 3.523 2.935 -1.387 Acetophenone 5.388 4.636 2.028
Aniline 5.402 4.641 1.320 Benzaldehyde 4.819 4.142 1.869
Benzene 2.987 2.509 2.357 Benzonitrile 4.991 4.307 1.901
Benzyl alcohol 5.399 4.620 0.539 1-Bromooctane 4.005 3.356 4.385
Butyraldehyde 3.068 2.583 0.738 1-Butanol 3.155 2.623 -0.305 2-Chloroaniline 5.477 4.716 1.877
1-Chlorobutane 1.972
1-Chlorohexane 3.078 2.554 3.078 1-Chlorooctane 3.757 3.133 3.947
p-Cresol 5.388 4.604 0.888 Cyclohexanol 4.018 3.391 0.008
Cyclohexanone 4.491 3.867 0.891 1,2-Dichlorobenzene 4.133 3.523 3.233
1,4-Dioxane 3.612 3.054 -0.098 N,N-Dimethylformamide 5.074 4.395
Ethyl acetate 3.149 2.629 0.989 Ethylbenzene 3.684 3.090 3.104
1-Iodobutane 2.883 2.403 2.703 Methyl caproate 4.143 3.483 2.313
Naphthalene 5.477 4.721 3.747 Nitrobenzene 5.253 4.544 2.233
2-Nitrophenol 5.212 4.476 1.852
1-Nitropropane 4.027 3.452 1.577
1-Octanol 4.527 3.807 1.527
Octylaldehyde 4.454 3.770 2.774
1-Pentanol 3.508 2.938 0.158
2-Pentanone 3.628 3.074 1.048
Phenetole 4.516 3.834 2.886
Phenol 5.022 4.295 0.172
2-Propanol 2.112
Propionitrile 3.561 3.055 0.741
Pyridine 3.798 3.241 0.358 Pyrrole 4.472 3.816
Toluene 3.380 2.839 2.730
m-Xylene 3.763 3.165 3.153
o-Xylene 3.882 3.274 3.222
p-Xylene 3.728 3.133 3.138
1-Bromohexane 3.322 2.781 3.449
Propanoic acid 3.897 3.241 -0.843
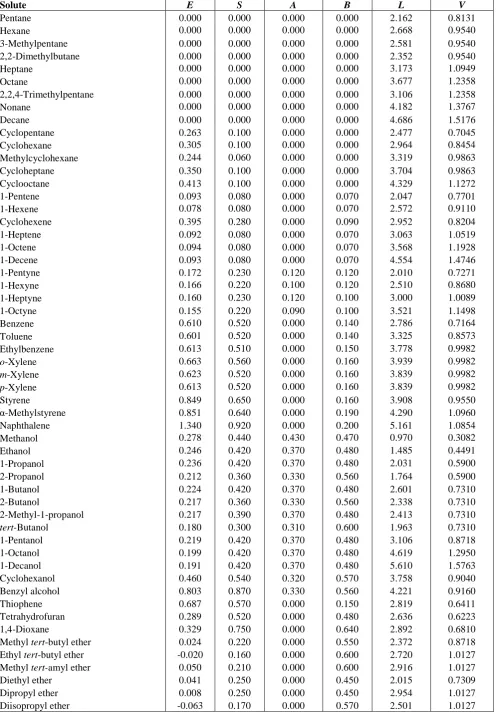
Table 4. Abraham model solute descriptors of the organic compounds considered in the present investigation
Solute E S A B L V
Pentane 0.000 0.000 0.000 0.000 2.162 0.8131
Hexane 0.000 0.000 0.000 0.000 2.668 0.9540
3-Methylpentane 0.000 0.000 0.000 0.000 2.581 0.9540 2,2-Dimethylbutane 0.000 0.000 0.000 0.000 2.352 0.9540
Heptane 0.000 0.000 0.000 0.000 3.173 1.0949
Octane 0.000 0.000 0.000 0.000 3.677 1.2358
2,2,4-Trimethylpentane 0.000 0.000 0.000 0.000 3.106 1.2358
Nonane 0.000 0.000 0.000 0.000 4.182 1.3767
Decane 0.000 0.000 0.000 0.000 4.686 1.5176
Cyclopentane 0.263 0.100 0.000 0.000 2.477 0.7045
Cyclohexane 0.305 0.100 0.000 0.000 2.964 0.8454
Methylcyclohexane 0.244 0.060 0.000 0.000 3.319 0.9863
Cycloheptane 0.350 0.100 0.000 0.000 3.704 0.9863
Cyclooctane 0.413 0.100 0.000 0.000 4.329 1.1272
1-Pentene 0.093 0.080 0.000 0.070 2.047 0.7701
1-Hexene 0.078 0.080 0.000 0.070 2.572 0.9110
Cyclohexene 0.395 0.280 0.000 0.090 2.952 0.8204
1-Heptene 0.092 0.080 0.000 0.070 3.063 1.0519
1-Octene 0.094 0.080 0.000 0.070 3.568 1.1928
1-Decene 0.093 0.080 0.000 0.070 4.554 1.4746
1-Pentyne 0.172 0.230 0.120 0.120 2.010 0.7271
1-Hexyne 0.166 0.220 0.100 0.120 2.510 0.8680
1-Heptyne 0.160 0.230 0.120 0.100 3.000 1.0089
1-Octyne 0.155 0.220 0.090 0.100 3.521 1.1498
Benzene 0.610 0.520 0.000 0.140 2.786 0.7164
Toluene 0.601 0.520 0.000 0.140 3.325 0.8573
Ethylbenzene 0.613 0.510 0.000 0.150 3.778 0.9982
o-Xylene 0.663 0.560 0.000 0.160 3.939 0.9982
m-Xylene 0.623 0.520 0.000 0.160 3.839 0.9982
p-Xylene 0.613 0.520 0.000 0.160 3.839 0.9982
Styrene 0.849 0.650 0.000 0.160 3.908 0.9550
α-Methylstyrene 0.851 0.640 0.000 0.190 4.290 1.0960
Naphthalene 1.340 0.920 0.000 0.200 5.161 1.0854
Methanol 0.278 0.440 0.430 0.470 0.970 0.3082
Ethanol 0.246 0.420 0.370 0.480 1.485 0.4491
1-Propanol 0.236 0.420 0.370 0.480 2.031 0.5900
2-Propanol 0.212 0.360 0.330 0.560 1.764 0.5900
1-Butanol 0.224 0.420 0.370 0.480 2.601 0.7310
2-Butanol 0.217 0.360 0.330 0.560 2.338 0.7310
2-Methyl-1-propanol 0.217 0.390 0.370 0.480 2.413 0.7310
tert-Butanol 0.180 0.300 0.310 0.600 1.963 0.7310
1-Pentanol 0.219 0.420 0.370 0.480 3.106 0.8718
1-Octanol 0.199 0.420 0.370 0.480 4.619 1.2950
1-Decanol 0.191 0.420 0.370 0.480 5.610 1.5763
Cyclohexanol 0.460 0.540 0.320 0.570 3.758 0.9040
Benzyl alcohol 0.803 0.870 0.330 0.560 4.221 0.9160
Thiophene 0.687 0.570 0.000 0.150 2.819 0.6411
Tetrahydrofuran 0.289 0.520 0.000 0.480 2.636 0.6223
1,4-Dioxane 0.329 0.750 0.000 0.640 2.892 0.6810
Table 4. (cont).
Dibutyl ether 0.000 0.250 0.000 0.450 3.924 1.2945
Acetone 0.179 0.700 0.040 0.490 1.696 0.5470
2-Pentanone 0.143 0.680 0.000 0.510 2.755 0.8288
3-Pentanone 0.154 0.660 0.000 0.510 2.811 0.8288
Cyclohexanone 0.403 0.860 0.000 0.560 3.792 0.8611 Methyl acetate 0.142 0.640 0.000 0.450 1.911 0.6057 Ethyl acetate 0.106 0.620 0.000 0.450 2.314 0.7466 Methyl propanoate 0.128 0.600 0.000 0.450 2.431 0.7470 Methyl butanoate 0.106 0.600 0.000 0.450 2.943 0.8880 Methyl caproate 0.080 0.600 0.000 0.450 3.874 1.1693 Butyraldehyde 0.187 0.650 0.000 0.450 2.270 0.6880
Acetonitrile 0.237 0.900 0.070 0.320 1.739 0.4040
Pyridine 0.631 0.840 0.000 0.520 3.022 0.6753
1-Nitropropane 0.242 0.950 0.000 0.310 2.894 0.7055
Acetic Acid 0.265 0.640 0.620 0.440 1.816 0.4648
Acetophenone 0.818 1.010 0.000 0.480 4.501 1.0139
Aniline 0.955 0.960 0.260 0.410 3.934 0.8162
Benzaldehyde 0.820 1.000 0.000 0.390 4.008 0.8730
Benzonitrile 0.742 1.110 0.000 0.330 4.039 0.8711
1-Bromohexane 0.349 0.400 0.000 0.120 4.130 1.1290 1-Bromooctane 0.339 0.400 0.000 0.120 5.143 1.4108 Butyraldehyde 0.187 0.650 0.000 0.450 2.270 0.6880 Octylaldehyde 0.160 0.650 0.000 0.450 4.380 1.2515 2-Chloroaniline 1.033 0.920 0.250 0.310 4.674 0.9390 1-Chlorohexane 0.201 0.390 0.000 0.090 3.708 1.0764 1-Chlorooctane 0.191 0.400 0.000 0.090 4.708 1.3582
p-Cresol 0.820 0.870 0.570 0.310 4.312 0.9160
1,2-Dichlorobenzene 0.872 0.780 0.000 0.040 4.318 0.9612 N,N-Dimethylformamide 0.367 1.310 0.000 0.740 3.173 0.6468
1-Iodobutane 0.628 0.400 0.000 0.150 3.628 0.9304
Nitrobenzene 0.871 1.110 0.000 0.280 4.557 0.8906
2-Nitrophenol 1.015 1.050 0.050 0.370 4.760 0.9493
Phenetole 0.681 0.700 0.000 0.320 4.242 1.0569
Phenol 0.805 0.890 0.600 0.300 3.766 0.7751
Propionitrile 0.162 0.900 0.020 0.360 2.082 0.5450
Pyrrole 0.613 0.910 0.220 0.250 2.792 0.5774
Propanoic acid 0.233 0.650 0.600 0.450 2.290 0.6057
Results and Discussion
Ionic liquids can be designed to posses specific physical properties and solubilizing abilities through judicious selection of the cation-anion pair combination and by adding functional groups to the cation alkyl chain. For instance, hydroxy- and ether functionalized ILs have been reported to exhibit especially large abilities in regards to solubilizing SO2 and CO2.38 Abraham model Eqns. 1 and 2 provide a
mathematical means to estimate how the partitioning behavior of organic compounds and inorganic gases changes as one varies the cation-anion combination in the IL. To estimate the partitioning behavior, however, one does need knowledge of the two sets of equation coefficients which can be obtained by regression analysis of experimental partititon coefficient data. Analysis of the log K and log P
values in Table 3 yielded the following three correlation expressions:
logK(298)=–0.145(0.060)+2.360(0.055)S + 1.248(0.090)A + 0.523(0.088)B + 0.629 (0.017)L (6)
(R2 = 0.984, SD = 0.137, N = 104, F = 1109)
logK(323)=–0.262(0.050)+2.158(0.046)S + 1.055(0.075)A + 0.442(0.073)B + 0.542(0.014)L (7)
(R2 = 0.986, SD = 0.115, N = 106, F = 1773)
logP(298)=0.130(0.089) + 0.168(0.089)E + 0.477(0.103)S – 2.483(0.111)A – 4.245(0.119)B + 3.215(0.077)V (8)
(R2 = 0.989, SD = 0.158, N = 102, F = 1778)
Preliminary analysis showed the (ek,cation + ek,anion)E term to be small in logK correlations at both 298 K, (ek,cation+ek,anion) =–0.031, and 323 K, (ek,cation + ek,anion)=0.005, and the standard error in the term were larger than the coefficient. The (ek,cation + ek,anion)E term was removed from the final log
K regression analyses. The relevant statistical information is given the respective correlation and is as follows: R2 refers
to the squared correlation coefficient, SD is the standard deviation, N represents the number of data points in the data set, and F denotes the Fisher F-statistic. The number of data points employed in the regression analyses is larger than the number of solutes studied. Remember that there were thirteen solutes common to our dataset and the dataset published by Marciniak and Wlazlo.34 The thirteen common
solutes were used to determine the proportionality constant,
P*, needed to convert the measured chromatographic retention factor data to gas-to-liquid partition coefficients. The derived Abraham model correlations given by Eqns. 6 – 8 are statistically quite good and back-calculate the observed partition coefficients to within 0.16 log units.
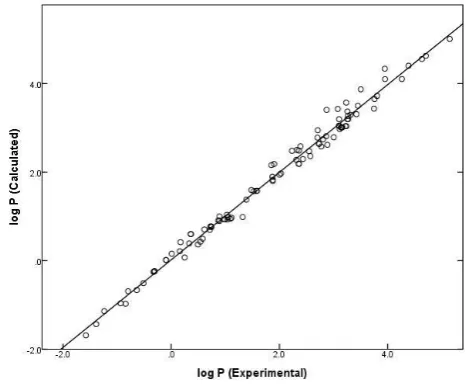
Figure 2 depicts a plot of log K (298 K) values back-calculated with Eqn. 6 against experimental values covering a range of approximately 4.373 log units, from log K=1.104 for pentane to log K=5.477 for 2-chloroaniline. A comparison of the back-calculated log P values versus measured log P data is shown in Figure 3. As expected the deviations in the back-calculated log P values are slightly larger than those for the log K correlations because the log P
values contain the additional experimental uncertainty in the gas-to-water data used in the log K to log P conversion.
Figure 2. Comparison between experimental log K (298 K) data and predicted values based on Eqn. 6
The derived log K (323 K) correlation can be compared to those reported by Marciniak and Wlazlo.34 As noted above
the authors determined log K correlations based on the experimental gas-to-IL partition coefficient data for water and 61 organic solutes dissolved in ([MeoeMPyrr]+[FAP]–)
at six temperatures from 318 K to 368 K. While 323 K was not one of the specific temperatures studied by the authors one should be able to reasonably assume that a log K correlation for 323 K should fall somewhere between the reported correlations
Figure 3. Comparison between experimental log P (298 K) data and predicted values based on Eqn. 8
logK(318)=–0.355(0.065) –0.049(0.080)E + 2.37(0.08)S + 1.15(0.12)A + 0.389(0.083)B + 0.580(0.020)L (9)
logK(328)=–0.379(0.061) – 0.039(0.074) + 2.28(0.07)S+ 1.07(0.11)A + 0.359(0.076)B + 0.552(0.018)L (10)
for 318 K and 328 K. Comparison of Eqns. 7, 9 and 10 shows that our calculated equation for the logK(323) correlation (Eqn. 7) does fall in between Eqns. 9 and 10 when the combined standard errors in the equation coefficients are taken into account. The slight difference between our coefficients and the arithmetic average of the coefficients of Eqns. 9 and 10 likely results for the more diverse set of solutes used in deriving Eqn. 7 and our decision to remove the (ek,cation + ek,anion)E term from the derived correlation. Our dataset (see Table 3) contains 104 experimental data points and includes two carboxylic acid solutes (acetic acid and propanoic acid), three phenolic compounds (phenol, 2-nitrophenol and p-cresol), two primary amine solutes (aniline and 2-chloroaniline), several halogenated alkanes (chlorobutane, chlorohexane, 1-chlorooctane, 1-iodobutane, 1-bromohexane, 1-bromo-octane), and several substituted aromatic benzene derivatives (acetophenone, benzaldehyde, phenetole, benzonitrile, nitrobenzene, phenetole, benzyl alcohol and 1,2-dichlorobenzene). Careful examination of Eqns. 9 and 10 shows that the summed (ek,cation + ek,anion) coefficient is small, and that the standard error in the coefficient is larger than the coefficient. Unlike us, Marciniak and Wlazlo34
elected to retain the term in their log K correlation.
In order to validate and to assess the predictive capabilities and limitations of Eqns. 6 – 8 we performed a training set and test set analysis by allowing the SPSS software to randomly select half of the experimental data values. The selected values became the training sets and the values that were left served as the test sets. By performing regression analyses on the experimental data in the two log K and one log P training sets, we obtained the following three mathematical correlations:
logK(298)=–0.257(0.075) + 2.466(0.077)S +1.469(0.174)A
+ 0.358(0.127)B + 0.661(0.021)L (11)
logK(323)=– 0.225(0.092) + 2.166(0.080)S+ 1.063(0.140)A
+ 0.407(0.119) B + 0.526(0.028)L (12) (R2 = 0.983, SD = 0.125, N = 53, F = 709)
logP(298)=0.220(0.120) + 0.156(0.117)E+ 0.472(0.140)S – 2.496(0.149)A– 4.292(0.158)B + 3.146(0.098)V (13) (R2 = 0.989, SD = 0.148, N = 51, F = 937)
Again the (ek,cation + ek,anion)E term was eliminated from the two log K correlations because the calculated coefficients were small.
Careful examination of Eqns. 6 – 8 and Eqns. 11 – 13 reveals that to within the standard errors in the equation coefficients, the training set equation coefficients are identical to the equation coefficients for the full data sets. The training set expression were then used to estimate the gas-to-IL partition coefficients for the 52 and 53 compounds in the log K test sets, and the water-to-IL partition coefficients of the 51 compounds in the log P test set. For the estimated and experimental values we found: SD values of 0.135, 0.102 and 0.170; average absolute error (AAE) values of 0.116, 0.090 and 0.125; and average error (AE) values of –0.025, 0.040 and –0.014 for Eqns. 11 – 13, respectively. The small AE values indicate that there is essentially no bias in predicting these log K and log P values. The training set and test set calculations were performed two more times with very similar statistical results.
The derived Abraham model correlations are expected to provide reasonably accurate partition coefficient predictions for additional organic compounds in anhydrous ([MeoeMPyrr]+[FAP]–) provided that the solute’s
descriptors values fall with the range of values defined by the compounds listed in Table 4. As an informational note, small gaseous solutes like methane, ethane, ethene, carbon dioxide, sulfur dioxide, etc. would not be included in the above descriptor range because their V and L solute descriptors are too small. We were not able to find gas solubility data for these small solutes dissolved in anhydrous ([MeoeMPyrr]+[FAP]–). In regards to the log P predictions
Eqn. 8 pertains to the hypothetical water-to-anhydrous ([MeoeMPyrr]+[FAP]–) partitioning process. We do not
know how effective the equation will be in predicting practical water-to-([MeoeMPyrr]+[FAP]–) partition
coefficients as there has been very little previous studies comparing direct practical partitioning processes against the indirect hypothetical paratitioning processes.
Nakamura et al.39 determined the partition coefficients of
several substituted benzenes between water and three ionic liquids (1-butyl-3-methylimidazolium bis(trifluoromethyl-sulfonyl)imide, ([BMIm]+[Tf
2N]–),
1-butyl-1-methylpyrroli-dinium bis(trifluoromethylsulfonyl)imide, ([BMPyrr]+
[Tf2N]–), and 1-butyl-3-methylimidazolium
hexafluoro-phosphate, ([BMIm]+[PF
6]–)) for use in liquid-liquid
extractions. There is hypothetical indirect partition coefficient data18,40 for several of the solutes studied by
Nakamura et al. in both ([BMIm]+[Tf
2N]–) and
([BMIm]+[PF
6]–) based on measured IL and
gas-to-water partition coefficient data. We have assembled in Table 5 the solutes for which we were able to find both direct and indirect log P values. There is an average difference between the two sets of log P values of 0.072 and
-0.104 log units, respectively, in the case of ([BMIm]+[Tf
2N]–) and ([BMIm]+[PF6]–). For ([BMIm]+
[Tf2N]–) the direct partition coefficients are slightly larger
than the indirect values, and for the ([BMIm]+[PF 6]–) the
indirect values are slightly larger. The water and ([BMIm]+
[PF6]–) system does exhibit some mutual solubility, the
solubility of water in ([BMIm]+[PF
6]–) is 0.26 mole fraction
and the solubility of ([BMIm]+[PF
6]–) in water is 0.00042
mole fraction.41 The water and ([BMIm]+[Tf
2N]–) system
exhibits similar mutual solubility. The solubility of water in ([BMIm]+[Tf
2N]–) is 0.26 mole fraction, while the solubility
of ([BMIm]+[Tf
2N]–) in water is 0.000307 mole fraction.42
While there is no published practical partition coefficient data for ([MeoeMPyrr]+[FAP]–) for us to compare our
experimental indirect and predicted indirect log P values against; however there is a reasonable possibility that, like water-to-organic solvent solute partitioning behavior, Eqn. 8 may provide reasonable predictions for direct water-to-([MeoeMPyrr]+[FAP]–) log P values, provided that the
mutual solubility in this partitioning system is not too large.
Table 5. Comparison of practical direct and hypothetical indirect water-to-([MeoeMPyrr]+[FAP]–) partition coefficients for select organic solutes at 298 K
Solute log P
(direct)
log P (indirect)
Diff.
IL = ([BMIm]+[Tf 2N]-)
Benzene 2.344 2.253 0.091
Toluene 2.700 2.553 0.147
o-Xylene 3.048 2.977 0.071
m-Xylene 3.060 2.985 0.075
p-Xylene 3.067 2.991 0.076
Acetophenone 1.987 2.011 -0.024
Aniline 1.550 1.478 0.072
Benzyl alcohol 0.940 0.874 0.066
1,2-Dichlorobenzene 3.200 3.290 -0.090
Nitrobenzene 2.257 2.091 0.166
IL = ([BMIm]+[PF 6]-)
Benzene 2.220 2.137 0.083
Toluene 2.480 2.402 0.078
o-Xylene 2.773 2.977 -0.204
m-Xylene 2.775 2.832 -0.057
p-Xylene 2.780 2.739 0.041
Acetophenone 1.924 2.056 -0.132
1,2-Dichlorobenzene 2.960 3.359 -0.399
Nitrobenzene 2.245 2.483 -0.238
As noted above, the equation coefficients represent a cation-anion sum. It is possible to calculate the equation coefficients for an individual cation if the anion values are known, and vice versa. In the present case the [FAP]– -specific equation coefficients of ck,anion = 0.179; ek,cation = – 0.015; sk,anion = 0.063; ak,anion = –1.314; bk,anion = 0.328 and
lk,anion = –0.053 are known from a previous study.43 The
subtracting the existing [FAP]–-specific equation coefficients from the values given in Eqn. 6. Performing the indicated subtractions, the following numerical values are computed: ck,cation = –0.324; ek,cation = 0.015; sk,cation = 2.297;
ak,cation = 2.562; bk,cation = 0.285; and lk,cation = 0.682 for the [MeoeMPyrr]+ cation. Similarly, numerical values for the
[MeoeMPyrr]+ cation for the log P(298 K) correlation would
be calculated by subtracting the published values43 of cp,anion
= 0.132; ep,anion = –0.171; sp,anion = 0.121; ap,anion = –1.314;
bp,anion = 0.244; and vp,anion = –0.107 for the [FAP]– anion from the coefficients given in Eqn. 8.
Conclusion
The present study increases the number of cations for which we have calculated ion-specific equation coefficients by one, from 21 different cations to 22 different cations, and permits the estimation of log K and log P values for an additional 14 ILs. We can now predict the partitioning behaviour of organic solutes dissolved in 1-(2-methoxyethyl)-1-methylpyrrolidinium bis(trifluoromethyl-sulfonyl)imide, 1-(2-methoxyethyl)-1-methylpyrrolidinium tetrafluoroborate, 1-(2-methoxyethyl)-1-methylpyrrolidi-nium hexafluorophosphate, 1-(2-methoxyethyl)-1-methyl-pyrrolidinium trifluoroacetate, 1-methylpyrrolidinium tetracyanoborate, methylpyrrolidinium dicyanamide, 1-(2-methoxyethyl)-1-methylpyrrolidinium tris(pentafluoroethyl)trifluorophos-phate, 1-(2-methoxyethyl)-1-methylpyrrolidinium bis(penta-fluoroethylsulfonyl)imide, pyrrolidinium thiocyanate, 1-(2-methoxyethyl)-1-methyl-pyrrolidinium nitrate, dinium ethylsulfate, dinium octylsulfate, 1-(2-methoxyethyl)-1-methylpyrroli-dinium diethylphosphate, and 1-(2-methoxyethyl)-1-methyl-pyrrolidinium methanesulfonate. Future studies will measure chromatographic retention factors for solutes on more ionic liquid stationary phases in order to determine ion-specific equation coefficients for additional cations and anions.
References
1Gonzalez-Miguel, M., Bedia, J., Abrusci, C., Palomar, J., Rodriquez, F. J. Phys. Chem. B, 2013, 117, 3398.
2Abraham, M. H. Chem. Soc. Rev.,1993, 22, 73.
3Abraham, M. H., Ibrahim, A., Zissimos, A. M. J. Chromatogr. A, 2004, 1037, 29.
4Abraham, M. H., Smith, R. L., Luchtefld, R., Boorem, A. J., Luo, R., Acree, W. E. Jr. J. Pharm. Sci., 2010, 99, 1500.
5Abraham, M. H., Acree, W. E. Jr. New J. Chem., 2010, 34, 2298.
6Saifullah, M., Ye, S., Grubbs, L. M., De La Rosa, N. E., Acree, W. E. Jr., Abraham, M. H. J. Solution Chem., 2011, 40, 2082.
7Abraham, M. H., Acree, W. E. Jr. Thermochim. Acta, 2011, 526, 22.
8Stephens, T. W., Wilson, A., Dabadge, N., Tian, A., Hensley, H. J., Zimmerman, M., Acree, W. E. Jr., Abraham, M. H. Glob. J. Phys. Chem., 2012,3, 9/1.
9Stephens, T. W., De La Rosa, N. E., Saifullah, M., Ye, S., Chou, V., Quay, A. N., Acree, W. E. Jr., Abraham, M. H. Fluid Phase Equilibr., 2011, 308, 64.
10Abraham, M. H., Acree, W. E. Jr. J. Solution Chem., 2011, 40, 1279.
11Abraham, M. H., Acree, W. E. Jr. J. Solution Chem., 2012, 41, 730.
12Sprunger, L., Acree, W. E. Jr., Abraham, M. H. J. Chem. Inf.
Model., 2007, 47, 1808.
13Sprunger, L. M., Gibbs, J., Acree, W. E. Jr., Abraham, M. H.
QSAR Comb. Sci., 2009, 28, 72.
14Acree, W. E. Jr., Abraham, M. H. J. Chem. Technol. Biotechnol., 2006, 81, 1441.
15Abraham, M. H., Acree, W. E. Jr. Green Chem., 2006, 8, 906.
16Sprunger, L., Clark, M., Acree, W. E. Jr., Abraham, M. H. J.
Chem. Inf. Model., 2007, 47, 1123.
17Sprunger, L. M., Proctor, A., Acree, W. E. Jr., Abraham, M. H.
Fluid Phase Equilibr., 2008, 265, 104.
18Sprunger, L. M., Gibbs, J., Proctor, A., Acree, W. E. Jr., Abraham, M. H., Meng, Y., Yao, C., Anderson, J. L. Ind. Eng. Chem. Res., 2009, 48, 4145.
19Mutelet, F., Revelli, A.-L., Jaubert, J.-N., Sprunger, L. M., Acree, W. E. Jr., Baker, G. A. J. Chem. Eng. Data, 2010, 55, 234.
20Revelli, A.-L., Mutelet, F., Jaubert, J.-N., Garcia-Martinez, M., Sprunger, L. M., Acree, W. E. Jr., Baker, G. A. J. Chem. Eng. Data, 2010, 55, 2434.
21Domańska, U., Królikowska, M., Acree, W. E. Jr., Baker, G. A. J.
Chem. Thermodyn., 2011, 43, 1050.
22 Grubbs, L. M., Ye, S., Saifullah, M., Acree, W. E. Jr., Twu, P., Anderson, J. L., Baker, G. A., Abraham, M. H. J. Solution Chem., 2011, 40, 2000.
23Moise, J.-C., Mutelet, F., Jaubert, J.-N., Gubbs, L. M., Acree, W. E. Jr., Baker, G. A. J. Chem. Eng. Data, 2011, 56, 3106.
24Domańska, U., Królikowska, M., Acree, W. E. Jr. J. Chem.
Thermodyn., 2011, 43, 1810.
25Acree, W. E. Jr., Baker, G. A., Mutelet, F., Moise, J.-C. J. Chem.
Eng. Data, 2011, 56, 3106.
26Stephens, T. W., Acree, W. E. Jr., Twu, P., Anderson, J. L., Baker, G. A., Abraham, M. H. J. Solution Chem., 2012, 41, 1165.
27Twu, P., Anderson, J. L., Stephens, T. W., Acree, W. E. Jr., Abraham, M. H. Eur. Chem. Bull., 2012, 1, 212.
28Acree, W. E. Jr., Baker, G. A., Revelli, A.-L., Moise, J.- C., Mutelet, F. J. Chem. Eng. Data, 2012, 57, 3510.
29Zissimos, A. M., Abraham, M. H., Du, C. M., Valko, K., Bevan, C., Reynolds, D., Wood, J., Tam, K. Y. J. Chem. Soc., Perkin Trans. 2, 2002, 2001.
30Zissimos, A. M., Abraham, M. H., Barker, M. C., Box, K. J., Tam, K. Y. J. Chem. Soc., Perkin Trans. 2, 2002, 470.
31Green, C. E., Abraham, M. H., Acree, W. E. Jr., De Fina, K. M., Sharp, T. L. Pest Manage. Sci., 2000, 56, 1043.
32Abraham, M. H., Green, C. E., Acree, W. E. Jr., Hernandez, C. E., Roy, L. E. J. Chem. Soc., Perkin Trans. 2, 1998, 2677.
33Bowen, K. R., Stephens, T. W., Lu, H., Shan, D., Satish, K., Acree, W. E. Jr., Abraham, M. H. Eur. Chem. Bull., 2013, 2, 577.
34Marciniak, A., Wlazlo, M. J. Chem. Thermodyn., 2013, 60, 57.
35Baltazar, Q. Q., Leininger, S. K., Anderson, J. L. J. Chromatogr.
A, 2008, 1182, 119.
36Abraham, M. H., Andonian-Haftvan, J., Whiting, G. S., Leo, A., Taft, R. W. J. Chem. Soc., Perkin Trans. 2, 1994, 1971.
37Abraham, M. H., Ibrahim, A., Acree, W. E. Jr. Fluid Phase
38Tang, S., Baker, G. A., Zhao, H. Chem. Soc. Rev., 2012, 41, 4030.
39Nakamura, K., Kudo, Y., Takeda, Y., Katsuta, S. J. Chem. Eng.
Data, 2011, 56, 2160.
40Sprunger, L. M., Gibbs, J., Baltazar, Q. W., Acree, W. E. Jr., Abraham, M. H., Anderson, J. L. Phys. Chem. Liq., 2009, 47, 74.
41Li, J., Wang, L.-S., Cai, S.-F. J. Chem. Eng. Data, 2010, 55, 5289.
42Freire, M. G., Carvalho, P. J., Gardas, R. L., Marrucho, I. M., Santos, L. M. N. B. F., Coutinho, J. A. P. J. Phys. Chem. B,
2008, 112, 1604.
43Acree, W. E. Jr., Grubbs, L. M., Abraham, M. H., Selection of
Ionic Liquid Solvents for Chemical Separations Based on the Abraham Model in Ionic Liquids: Applications and Perspectives (Book 2), Kokorin, A. (Editor) INTECH Publishers, 2011, Chapter 13, 273.

![Table 3. Logarithm of the gas-to-anhydrous IL partition coefficient, log K at 298 K and 323 K and logarithm of the water-anhydrous IL partition coefficient, log P, at 298 K for organic solutes dissolved in ([MeoeMPyrr]+[FAP]–)](https://thumb-us.123doks.com/thumbv2/123dok_us/7835171.2089926/4.595.307.548.546.783/logarithm-anhydrous-partition-coefficient-anhydrous-coefficient-dissolved-meoempyrr.webp)

![Table 5. Comparison of practical direct and hypothetical indirect water-to-([MeoeMPyrr]+[FAP]–) partition coefficients for select organic solutes at 298 K](https://thumb-us.123doks.com/thumbv2/123dok_us/7835171.2089926/9.595.304.554.323.660/comparison-practical-hypothetical-indirect-meoempyrr-partition-coefficients-organic.webp)
