Clinical Anatomy: Anthropometry for
Nutritional Assessment of 367 Adults who
Underwent Endoscopic Gastrostomy
Anatomia Aplicada à Clínica: Antropometria na Avaliação Nutricional de 367
Adultos Submetidos a Gastrostomia Endoscópica
1. Serviço de Gastrenterologia. Grupo de Estudo de Nutrição Entérica. Hospital Garcia de Orta. Almada. Portugal. 2. Instituto Superior de Ciências da Saúde Egas Moniz. Centro de Investigação Interdisciplinar Egas Moniz. Lisboa. Portugal. Recebido: 21 de Dezembro de 2012 - Aceite: 05 de Março de 2013 | Copyright © Ordem dos Médicos 2013
Jorge FONSECA1,2, Carla Adriana SANTOS1
Acta Med Port 2013 May-Jun;26(3):212-218
RESUMO
Introdução: Doentes com disfagia prolongada necessitam de nutrição entérica por gastrostomia. A avaliação nutricional destes doen-tes é difícil, apoiando-se em dados objetivos, incluindo dados antropométricos.
Objetivo: Avaliar a utilidade da antropometria na identificação e graduação da gravidade da desnutrição, como parte da avaliação inicial de doentes submetidos a gastrostomia endoscópica.
Material e Métodos: Avaliaram-se processos de adultos consecutivos submetidos a gastrostomia. Selecionaram-se doentes com reg-isto prévio à gastrostomia: Índice de Massa Corporal, Perímetro Braquial, Prega Cutânea Tricipital e Circunferência Muscular do Braço. O estado nutricional foi classificado pelo Índice de Massa Corporal de acordo com a Organização Mundial de Saúde e pelo Perímetro Braquial, Prega Cutânea Tricipital e Circunferência Muscular do Braço pela adequação por comparação com tabelas de referência.
Resultados: Selecionaram-se 367 doentes (idade mediana: 74,1 anos): doença neurológica: 172; neoplasia cervicofacial: 176; outras doenças: 19. O Índice de Massa Corporal identificou 136 doentes com magreza e 231 eutróficos ou com peso excessivo. O Perímetro Braquial identificou 310 desnutridos e 57 eutróficos ou com peso excessivo. Prega Cutânea Tricipital identificou 301 desnutridos e 66 eutróficos ou com peso excessivo. A Circunferência Muscular do Braço identificou 269 desnutridos, 97 eutróficos, um com Circunferência Muscular do Braço acima do normal.
Discussão e Conclusões: A antropometria na avaliação inicial de doentes gastrostomizados permitiu identificar desnutrição, clas-sificar a gravidade e estimar o seu impacto. Perímetro Braquial, Prega Cutânea Tricipital e Circunferência Muscular do Braço identifi-caram desnutrição em cerca de 80% dos doentes, mais na massa adiposa que na muscular. Acessível e não dispendiosa, a antropo-metria permitiu adequar o suporte nutricional. Deve ser encarada como um instrumento de trabalho fundamental para as equipas de nutrição clínica.
Palavras-chave: Adulto; Antropometria; Avaliação Nutricional; Distúrbios Alimentares; Gastrostomia; Índice de Massa Corporal.
ABSTRACT
Introduction: Patients suffering from long standing dysphagia need tube feeding through gastrostomy. Nutritional assessment of these patients is challenging and must be supported on objective data, including anthropometric evaluation.
Aim: The aim of this study was the evaluation of the usefulness of anthropometry for identifying and grading malnutrition, as part of the initial assessment of patients that underwent endoscopic gastrostomy.
Material and Methods: From the files of consecutive adults underwent gastrostomy we selected patients with anthropometric data obtained before the procedure: Body Mass Index, Mid Upper Arm Circumference, Triceps Skinfold Thickness and Mid Arm Muscle Cir-cumference. Nutritional status was classified according with World Health Organization criteria for Body Mass Index, and for Mid Upper Arm Circumference, Triceps Skinfold Thickness and Mid Arm Muscle Circumference using comparison with Frisancho reference-tables.
Results: Were selected 367 patients (median of ages: 74.1 years): neurological disease: 172; head and neck cancer: 176; other diseases: 19. Body Mass Index identified 136 underweight and 231 eutrophic or overweight patients. Mid Upper Arm Circumference identified 310 malnourished and 57 eutrophic or overweight patients. Triceps Skinfold Thickness identified 301 malnourished and 66 eutrophic or overweight patients. Mid Arm Muscle Circumference identified 269 malnourished, 97 eutrophic and one with MAMC above normal.
Discussion and Conclusions: Anthropometry identified the malnourished endoscopic gastrostomy-patients, contributed for malnutri-tion grading and demonstrated the impact on muscle and fat reserves. Mid Upper Arm Circumference, Triceps Skinfold Thickness and Mid Arm Muscle Circumference identified malnutrition in nearly 80% of the patients, most clearly with fat tissue wasting than muscle. Easily accessible e inexpensive, anthropometry allowed personalized nutritional therapy. Anthropometry must be recognized as a fundamental tool for enteral feeding teams.
Keywords: Adult; Anthropometry ; Body Mass Index; Gastrostomy; Nutrition Assessment; Nutrition Disorders.
INTRODUCTION
The overall nutritional status of healthy individuals is composed of several processes including food ingestion, reserve formation and mobilization and nutrient consump-tion to keep homeostasis, produce heat and daily activities. In patients, it also reflects the changes induced by disease, with a trend towards anorexia, use of storage energy
re-serves and increased catabolism. As a consequence of these multiple influences the nutritional evaluation of pa-tients and healthy individual is complex. There is no test or method that may be considered a gold standard. In pa-tients, for nutritional assessment, we utilize the clinical his-tory, physical examination, anthropometric and laboratory
data including immunological parameters. To these, body composition data and muscle strength functional assess-ment may be added. There are several validated compound assessment tools, of a clinical, anthropometric and labora-tory nature, which allow for a nutritional status classifica-tion.1,2 Nevertheless, although it would be desirable for an
assessment to include as many parameters as possible, reflecting different influences, it is often impossible in clini-cal practice to obtain reliable cliniclini-cal data or to perform a functional assessment.
Patients with dysphagia need appropriate nutritional support with a diet of modified consistency or tube feeding enteral nutrition, the latter placing food directly in the stomach, bypassing oral ingestion and swallowing mechanism. In the presence of a severe long-term dysphagia, lasting for more than 3-4 weeks, the preferred enteral nutrition access is via percutaneous endoscopic gastrostomy (PEG).3 The
access is performed under endoscopic guidance, placing a feeding tube in the stomach through the abdominal wall. It helps to maintain physiologic nutrition during long periods of time, as a transitional measure or as a permanent option. This approach benefits patients with dysphagia due to a neurological disorder or due to head and neck neoplasms, usually mouth, pharyngeal, laryngeal or cervical oesophageal tumors.4,5 Nevertheless, disorders
that cause a long-term dysphagia also tend to hinder verbal expression, impairing clinical assessment and recording of the patient´s history. Nutrition assessment tools based on subjective information provided by patients are inadequate when verbal communication is difficult or impossible. Therefore, clinical teams assisting patients with dysphagia must rely on objective data, including anthropometric and laboratory parameters.
Anthropometry is the branch of morphology aiming to study measurable characters in human anatomy. The clinical use of anthropometry is based on objective data including weight (or body mass) and linear measurements such as body height, skinfold thickness, bone segment width and circumferences obtained from several body segments. Some of these are clinically useful when used in a direct and immediate way. For example, abdominal circumference has been designed as an important parameter in individual vascular risk definition.6 Nevertheless, much directly
obtained data may be used to calculate indirect or composite measurements, allowing for better assessment and/or specific morphological and functional sector evaluation. Classically, Body Mass Index (BMI) correlates weight with height, allowing an individual to be classified as thin, eutrophic, overweight/obese, which would not be possible based on body weight alone. Triceps Skinfold Thickness (TST) reflects subcutaneous adipose tissue. Knowing the Mid Upper Arm Circumference (MUAC) and the TST, we may obtain the Mid Arm Muscle Circumference (MAMC) or the Arm Muscle Area, which reflects skeletal muscle mass. A great number of anthropometric parameters with direct or indirect measurement have been described, but each field of research and clinical practice tends to use a small
number of these parameters, according to specific study requirements.
Body Mass Index (BMI) or the Quételet Index is the most well-known anthropometric parameter. It was devised by Lambert Quételet, a XIX century mathematician with an interest in social sciences and public health. It is defined as the body weight divided by the square of the height: BMI = weight / (height).2 The classification proposed by
Garrow and Webster is based on BMI7 and was later adapted
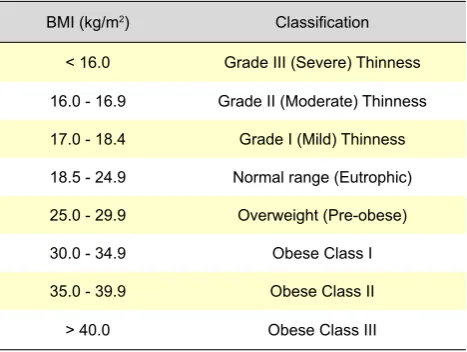
by the World Health Organization, classifying individuals in eutrophic (normal) or suffering from thinness or overweight/ obesity with several degrees of severity (Table 1). This a very useful classification due to its simplicity, although it has several limitations. It varies significantly according to the age of the individual and it requires a special adaptation for the paediatric population. In the elderly, it has been suggested that higher values should be used.8
Even in young adults, BMI does not distinguish changes due to body composition variations: a muscled adult may be classified as obese or a patient with excessive adipose tissue but with reduced muscle mass may be considered as eutrophic. These, although formally correct according to BMI measurement, are clinically erroneous. Therefore, in individual clinical assessments, the BMI rather than being used in isolation, should be combined with tools that allow for body composition and clinical status to be addressed. Circumferences are circular measurements made in the horizontal plane, measured perpendicular to the longitudinal axis of the segment that we need to measure. Circumferences measure the whole segment, including bone, muscle, adipose tissue and skin. Mid Upper Arm Circumference (MUAC) and Calf Circumference (CC) are easy to obtain, even in very dependent or bedridden patients. Skinfold Thickness is a measurement of the double adipose layer of skin and subcutaneous tissues.
It allows the evaluation of subcutaneous adipose tissue and the estimation of fat reserves. Triceps Skinfold Thickness is measured in the posterior aspect the arm, along the longitudinal axis, halfway between the acromial superolateral border and the olecranon.9
Table 1 - BMI classification according to WHO
BMI (kg/m2) Classification
< 16.0 Grade III (Severe) Thinness
16.0 - 16.9 Grade II (Moderate) Thinness
17.0 - 18.4 Grade I (Mild) Thinness
18.5 - 24.9 Normal range (Eutrophic)
25.0 - 29.9 Overweight (Pre-obese)
30.0 - 34.9 Obese Class I
35.0 - 39.9 Obese Class II
> 40.0 Obese Class III
MUAC and TST measurements allow for the calculation of the Arm Fat Area, another option to evaluate subcutaneous adipose tissue, to estimate fat reserve and obtain the Mid Arm Muscle Circumference (MAMC) and the Arm Muscle Area, allowing for an estimation of muscle mass.
In our Enteral Nutrition Unit, patients submitted to gastrostomy were evaluated recording BMI whenever patients were able to assume an orthostatic position and, in all patients, through CC, MUAC, TST and calculating the MAMC. We chose these parameters as they are easy to measure in bedridden patients, unable to rise or difficult to mobilise. Anthropometric, clinical and laboratory data collection was systematically obtained on the day prior to or on the day of gastrostomy and after that, on every visit, in order to monitor clinical and nutritional progress. Nevertheless, the present work was focused on the initial evaluation, at the time of gastrostomy, considered crucial for nutritional evaluation, for identification of any sign of malnutrition, severity classification and required nutritional approach
OBJECTIVE
The present work aimed to retrospectively obtain an assessment of the usefulness of anthropometric methods in malnutrition identification and its severity assignment, as part of the initial evaluation of patients submitted to endoscopic gastrostomy.
MATERIAL AND METHODS
A retrospective evaluation of all adult patients submitted to endoscopic gastrostomy for long-term enteral nutrition was carried out through a survey of Hospital Garcia de Orta Enteric Nutrition Department clinical records, between the 1st December 2003 and the 30th November 2012. Demographic, clinical and anthropometric data were
collected. The anthropometric evaluation was carried out according to the procedures described in manual ISAK9 of the International Society for the Advancement of
Kinanthropometry. Within 24 hours or at the time of the endoscopic procedure all patients were submitted to an evaluation that included MUAC, TST and MAMC, referred to the non-dominant limb. The BMI was determined in all the patients able to assume an orthostatic position. Patients in whom it was not possible to determine the BMI were excluded from the study. Height was determined with a stadiometer, with a 1 mm resolution. Weight was determined with a calibrated scale, with a 0.1 kg resolution. MUAC was evaluated using an inextensible measuring tape, with a 1 mm resolution. TST was measured using a Lange Skinfold caliper with a 1 mm resolution. Measurements were obtained by the same group of researchers working together for more than a decade, in order to minimize inter-observer variations, to assure similar methodologies and the use of the same instruments. Each parameter was measured three times and each value represents individual value averages. MAMC was calculated according to the equation: MAMC = MUAC (cm) –3.14 x TST (cm) or MAMC = MUAC (cm) – 0,314 x TST (mm).
BMI and MUAC were derived from the joint assessment of several tissues, globally representing fat body mass and lean body mass. Patients were classified as presented in Table 1, according to the BMI. Each patient’s MUAC was compared with reference values of the NHANES (National Health and Nutrition Examination Survey), through the comparison with the Frisancho reference tables.10 MUAC
adequacy was determined using the following equation: MUAC Adequacy(%) = Obtained MUAC / MUAC 50 percentile x 100. Nutritional status was classified as presented in Table 2, following the criteria described by Blackburn and Thornton.11
Table 2 - Nutritional status according to Mid-Upper Arm Circumference
Severe malnutrition Moderate malnutrition Mild malnutrition Eutrophic Overweight Obese
MUAC < 70% 70 - 80% 80 - 90% 90 - 110% 110 - 120% > 120 %
Reference: BLACKBURN. G.L.& THORNTON. P.A. 1979
Table 3 - Nutritional status according to Triceps Skinfold Thickness
Severe malnutrition Moderate malnutrition Mild malnutrition Eutrophic Overweight Obese
TST < 70% 70 - 80% 80 - 90% 90 - 110% 110 - 120% > 120 %
Reference: BLACKBURN. G.L.& THORNTON. P.A. 1979
Table 4 - Nutritional status according to Mid-Arm Muscle Circumference
Severe malnutrition Moderate malnutrition Mild malnutrition Eutrophic
MAMC < 70% 70 - 80% 80 - 90% > 90%
Reference: BLACKBURN. G.L.& THORNTON. P.A. 1979
TST reflects subcutaneous adipose tissue and estimates fat reserves. Each patient’s TST has been compared with the NHANES reference values, through comparison with the Frisancho reference tables.10 TST adequacy was
determined using the following equation: TST adequacy (%) = Obtained TST / TST 50 percentile x 100. Nutritional status was classified as presented in Table 3.11 Of note,
malnutrition signalled by TST is particularly indicative of fat reserve depletion.
MAMC suggests and estimates muscle mass. Each patient’s MAMC was compared with the NHANES reference values, through the comparison with the Frisancho reference tables.10 MAMC adequacy was determined using
the following equation:
MAMC adequacy (%) = Obtained MAMC / MAMC 50 percentile x 100.
Nutritional status was classified as presented in Table 4.11 Malnutrition suggested by MAMC being indicative of fat
reserve depletion.
Descriptive statistics calculations were performed using Excel software and the SPSS version 19.0 software used for comparison of malnutrition indicators suggested by TST and MAMC.
RESULTS
Four-hundred and eighty two adult dysphagia patients were submitted to endoscopic gastrostomy between the 1st December 2003 and the 30th November 2012. From these, 115 were excluded from the study as BMI could be not obtained through the described methodology, due to the fact that patients were unable to assume the orthostatic position. The remaining parameters were obtained in all patients, within 24 hours or at the time of the gastrostomy procedure. A total of 367 patients were included in the study including 273 males with ages between 18 and 94 (average: 62.3 years; median age: 74.1). Of these, 172 presented with a neurological disorder, 176 with a cervicofacial tumor and 19 with other disorders requiring gastrostomy.
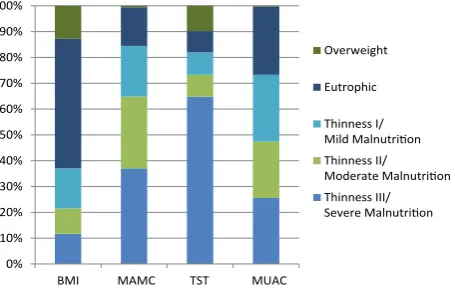
Using BMI, it was possible to identify 43 patients with Grade III Thinness, 36 with Grade II Thinness and 57 with Grade I Thinness. One-hundred and eighty four patients were considered eutrophic and 47 were overweight. Using MUAC, it was possible to identify 136 patients with Severe Malnutrition, 102 with Moderate Malnutrition and 72 with Mild Malnutrition. Only 55 patients were eutrophic and two were overweight. Using TST, it was possible to identify 238 patients with Severe Malnutrition, 31 with Moderate Malnutrition and 32 with Mild Malnutrition. Only 30 were eutrophic while 36 were overweight. Using MAMC, it was possible to identify 94 patients with Severe Malnutrition, 80 with Moderate Malnutrition and 95 with Mild Malnutrition. Only 97 were eutrophic and 1 patient had a MAMC above normal (Figure 1).
Non-parametric Kruskal-Wallis test was used to test if MAMC and TST also identified malnutrition in these patients. Malnutrition was present in more patients, using TST and this difference was statistically significant
(p < 0.001).
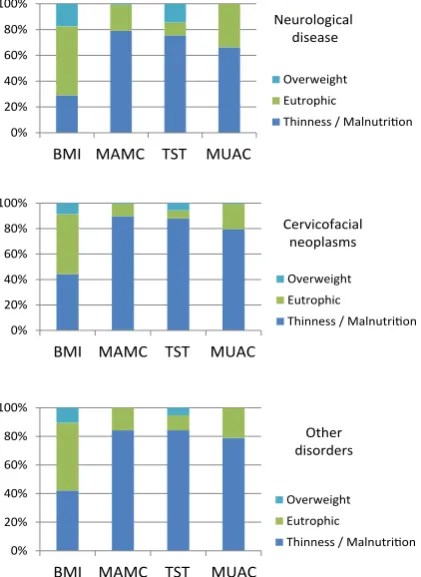
Malnutrition was analysed according to the dysphagia-related pathology. In the group of patients with a neurologic disorder, BMI allowed for the identification of 50 thin patients, 92 were eutrophic and 30 overweight. MUAC allowed for the identification of malnutrition in 136 patients, 35 were eutrophic and one overweight. TST allowed for the identification of malnutrition in 130 patients, 17 were eutrophic and 25 overweight. MAMC allowed for the identification of malnutrition in 114 patients while 58 were eutrophic. In the group of patients with a cervicofacial neoplasm, BMI allowed for the identification of 78 thin patients, 83 were eutrophic and 15 overweight. MUAC allowed for the identification of malnutrition in 158 patients, 17 were eutrophic and one patient was overweight. TST allowed for the identification of malnutrition in 155 patients, 11 were eutrophic and 10 overweight. MAMC allowed for the identification of malnutrition in 140 patients, 35 were eutrophic and one patient overweight. In the group of patients with other pathologies, BMI allowed for the identification of eight thin patients, nine eutrophic and two overweight. MUAC allowed for the identification of malnutrition in 16 patients and three eutrophic patients. TST allowed for the identification of malnutrition in 16 patients, two eutrophic and one overweight. MAMC allowed for the identification of malnutrition in 15 patients and four eutrophic patients (Figure 2).
DISCUSSION
According to the protocol used by our group, time criterion of severe dysphagia duration requiring tube-feeding nutrition, is fundamental to achieve a gastrostomy indication. Patients with long-term dysphagia either present a high risk of malnutrition or already present with malnutrition criteria. Therefore, the decision of proposing a gastrostomy depends on dysphagia duration and perspective of duration, irrespectively of whether patients present with malnutrition.
0% 10% 20% 30% 40% 50% 60% 70% 80% 90% 100%
BMI MAMC TST MUAC
Overweight
Eutrophic
Thinness I/ Mild Malnutrition Thinness II/ Moderate Malnutrition Thinness III/ Severe Malnutrition
Figure 1 – Classification of nutritional status of the 367 patients,
according with anthropometric parameters.
0% 20% 40% 60% 80% 100%
BMI MAMC TST MUAC
Overweight Eutrophic
Thinness / Malnutrition
0% 20% 40% 60% 80% 100%
BMI MAMC TST MUAC
Overweight Eutrophic
Thinness / Malnutrition Other
disorders
0% 20% 40% 60% 80% 100%
BMI MAMC TST MUAC
Overweight Eutrophic
Thinness / Malnutrition Cervicofacial
neoplasms Neurological
disease
Figure 2 – Simplified classification of nutritional status of patients
distributed by underlying disorders, according with anthropometric parameters.
Gastrostomy allows for reversion of malnutrition or its prevention. Whenever a patient is a candidate for tube-feeding enteral nutrition for more than 3-4 weeks, the indication for gastrostomy should be analysed between the assisting physician, the enteral nutrition team, the patient’s family and when possible, the patient himself. All decisions are obviously individualized and should take into account the clinical, social and psychological aspects of the patient and his family.
In our experience, the patients referred and submitted to endoscopic gastrostomy for long-term enteral nutrition present, in most cases, with a severe disorder with systemic compromise. More frequently, patients present a neurological cause for a swallowing compromise, either with a sudden presentation, as in the case of a stroke, or with a progressive presentation, as in neurodegenerative disorders most frequently, in our experience due to Amyotrophic Lateral Sclerosis.4 The second group of
patients that most commonly need PEG is the group of patients with cervicofacial neoplasms.4 In this series, patients
with a tumor are the most represented, as the inability of assuming orthostatic position for BMI determination was an exclusion criteria and almost all 115 patients in whom it was not possible to determine BMI, presented a neurological disorder compromising mobilization. The exclusion of neurological patients also explains male predominance. Among us, cervicofacial tumors occur mainly in men due to their etiological connection with tobacco and high
alcoholic consumption. Cervicofacial tumor predominance also explains the male predominance in the present study. The group of ages of treated patients is very wide, from 18 to 94, despite the fact that this study excluded many bedridden elderly patients.. Despite a medium age of 62.3, the median age of 74.1 reflects the advanced age of most of the patients.
Given a difficult or impossible oral communication with a great number of patients, nutritional assessment tools depending on patients´ history were frequently not included in the assessment.. Clinical teams responsible for long-term enteral nutrition in dysphagia patients should therefore rely on objective data. These include anthropometric and laboratory parameters.
Serum proteins, mainly albumin, transferrin and prealbumin (transthyretin), have been used as a laboratory contribution for malnutrition identification. Serum proteins are subject to several influences, nutritional and non-nutritional, behaving as acute phase proteins, decreasing their concentration in a clinical context of systemic inflammation. Furthermore, their plasma half-lives are approximately 20, 8-10 and 2-3 days, respectively.12,13 They
are more sensitive to short and medium-term variations than to changes that develop during months or years. On the contrary, anthropometric variations tend to be progressive, developing over long periods, more representative of the expected time horizon of enteral nutrition via endoscopic gastrostomy. An anthropometric assessment is much more adequate in this group of patients.
The obtained BMI and MUAC composed the joint evaluation of fat and lean body mass, globally representing the patient. TST and MAMC allowed for a focused perspective in different aspects of malnutrition: TST evaluation reflected fat reserve depletion, while MAMC showed muscle mass reduction. Alternatives to anthropometric assessment are modern image techniques, namely the Computerized Tomography (CT) and Magnetic Resonance Imaging (MRI).14 MRI allows a precise assessment of muscle,
adipose and bone components, although not easily available in every centre and with costs which are not compatible with a regular clinical evaluation. Anthropometry is the adequate option for clinical practice and the use of several parameters provided not only a global and quantitative nutritional status overview, but also a malnutrition qualitative perspective, with the identification of its impact on lean body mass and on fat reserves.
With the exception of BMI, all parameters were easily obtained in all patients and allowed for the identification of the presence of malnutrition in most. Considering the results and nutritional status classifications, only the BMI failed to identify thinness/malnutrition as the predominant category. Using BMI criteria alone, two thirds of the patients would be considered as eutrophic or overweight. Using MUAC, TST and MAMC, about 80% of the patients presented malnutrition to a greater or lesser degree (Figure 1). This divergence persists when we analyse patients according to their pathology (Figure 2) with no correlation with the underlying
disease. This difference could be explained as follows. BMI is a worldwide tool, recommended by WHO for studies in populations with very different morphological and nutritional characteristics from those that we observe in developed countries including the Portuguese population. It is probably more important to consider that our patients, although with a wide age variation, tend to be elderly. The median of our group of patients was 74.1 years. It was our option to use the described classification as it is more comprehensive and it separates malnutrition in mild, moderate and severe. Nevertheless, many authors recommend the use of higher normal values in the elderly. The American Dietetic Association suggests to consider thinness any BMI < 22 kg/m2.8 Once this trend is established and if a specific
graduation for malnutrition in mild, moderate and severe is defined, this tool may become more adequate in the elderly and consequently in our group of patients. When we compare the remaining anthropometric parameters, we observe that MUAC, which globally represents the fat and lean body mass, identifies malnutrition in about 85% of the cases. TST, which mainly represents subcutaneous adipose tissue, also identifies malnutrition in about 82%. As to the MAMC, which represents the lean body mass and skeletal muscle mass, it only identifies malnutrition in 72% and less severe malnutrition. This is a relevant difference and may have consequences, at least in part of the patients, inducing a reduction of food ingestion due to dysphagia and fat reserve consumption, with a relative sparing of muscle mass, an adequate physiological response in progressive malnutrition.
The anthropometric data and nutritional status classifications obtained according to the etiological groups related with dysphagia are described in Figure 2. Worse anthropometric parameters and more severe malnutrition would be expected in patients with cervicofacial neoplasms, due to the proinflammatory and consumptive nature of this disorder. As shown in Figure 2, this has not happened, as we unexpectedly obtained overlapping data in the different groups of disorders. This similarity is probably due to the fact that many neurological and other disorders also present with systemic inflammatory activity and with a similar burden
on the evaluated parameters. The changes that have been found in anthropometric parameters seem to depend mainly on a previous short period of nutritional support to the gastrostomy and not on the underlying disorder.
Naturally, the nutritional support was monitored by data collected in subsequent visits. Nevertheless, the initial anthropometry assessment that defined the support according to the presence of malnutrition or to a “patient at risk” situation, proved fundamental. In this group of 367 patients, we should emphasize that the feasibility of obtaining anthropometric parameters in all patients and its simple and immediate interpretation in each case allowed for a definition of an individualized and early nutritional support plan, taking into account malnutrition severity and degree of impact on fat reserve and/or on muscle mass. When anthropometric parameters identify malnutrition at the time of gastrostomy, the nutritional support was calculated based on this reality, higher in severity than in patients at nutritional risk.
CONCLUSIONS
In our experience, the use of anthropometric methods for an initial assessment of patients who are submitted to endoscopic gastrostomy allows for the identification of malnourished patients, for defining patients according to a malnutrition classification and to estimate its impact on fat reserve and muscle mass. Individual anthropometric data measurement has been possible in all included patients and demanded only low-cost resources, coherent anatomic knowledge and quantitative as well as qualitative technical rigor from health professionals,. Anthropometry should be considered a fundamental instrument for the work of clinical nutrition teams.
CONFLICT OF INTERESTS
There is no conflict of interests, from any of the authors, in the writing this manuscript.
FUNDING SOURCES
No source of funding has been identified as having contributed for the writing of this manuscript.
REFERENCES
1. Bauer J, Capra S, Ferguson M. Use of the scored Patient-Generated Subjective Global Assessment (PG-SGA) as a nutrition assessment tool in patients with cancer. Eur J Clin Nutr. 2002;56:779-85.
2. Vellas B, Abellan G, Soto ME, Rolland Y, Guigoz Y, Morley JE, et al. Overview of the MNA - Its history and challenges. J Nutr Health Aging. 2006;10:456-63.
3. Löser C, Aschl G, Hébuterne X, Mathus-Vliegen EM, Muscaritoli M, Niv Y, et al. ESPEN guidelines on artificial enteral nutrition--percutaneous endoscopic gastrostomy (PEG). Clin Nutr. 2005;24:848-61.
4. Fonseca J, Santos C. Clinical data, evolution and survival of 200 con-secutive PEG patients. Clin Nutr. 2009;4Suppl:122.
5. Grilo A, Santos CA, Fonseca J. Percutaneous endoscopic gastrostomy for nutritional palliation of upper esophageal cancer unsuitable for es-ophageal stenting. Arq Gastroenterol. 2012;49:227-31.
6. Klein S, Allison DB, Heymsfield SB, Kelley DE, Leibel RL, Nonas C, et
al. Waist circumference and cardiometabolic risk: a consensus
state-ment from Shaping America’s Health: Association for Weight Manage-ment and Obesity Prevention; NAASO, The Obesity Society; the Ameri-can Society for Nutrition; and the AmeriAmeri-can Diabetes Association. Am J Clin Nutr. 2007;85:1197-202.
7. Garrow JS, Webster J. Quetelet’s index (W/H2) as a measure of fatness. Int J Obes. 1985;9:147-53.
8. American Dietetic Association, American Academy of Family Physi-cians, National Council on the Aging. Nutrition Interventions Manual for Professionals Caring for Older Americans. Washington: Greer, Margolis, Mitchell, Grunwald & Associates;1992.
9. Stewart A, Marfell-Jones M, Olds T, de Ridder H. International standards for anthropometric assessment. Lower Hutt: International Society for the Advancement of Kinanthropometry; 2011.
10. Frisancho AR. New standards of weight and body composition by frame size and height for assessment of nutritional status of adults and the
elderly. Am J Clin Nutr. 1984;40:808-19.
11. Blackburn GL, Thornton PA. Nutritional assessment of the hospitalized patient. Med Clin North Am. 1979;63:11103-15.
12. Fuhrman MP, Charney P, Mueller CM. Hepatic proteins and nutrition as-sessment. J Am Diet Assoc. 2004;104:1258-64.
13. Huckleberry Y. Nutritional support and the surgical patient. Am J Health Syst Pharm. 2004;61:671-82.
14. Heymsfield SB. Development of imaging methods to assess adiposity and metabolism. Int J Obes . 2008;32(Suppl 7):S76-82.