ARTIGO ORIGINAL
Indications for Cesarean Deliveries
during a 7-Year Period in a Tertiary Hospital
Indicações para Cesarianas num Hospital Terciário durante Sete Anos
1. Departamento de Obstetrícia, Ginecologia e Medicina da Reprodução. Hospital de Santa Maria (Centro Hospitalar Lisboa Norte). Lisboa. Portugal. Recebido: 08 de Fevereiro de 2013 - Aceite: 30 de Abril de 2013 | Copyright © Ordem dos Médicos 2013
Ana COSTA1, Catarina POLICIANO1, Nuno CLODE1, Luís M. GRAÇA1 Acta Med Port 2013 Nov-Dec;26(6):649-654
RESUMO
Introdução: Analisar a evolução da taxa de cesarianas e as principais indicações para cesariana num centro terciário.
Material e Métodos: Estudo retrospectivo conduzido num hospital universitário que incluiu 5751 grávidas submetidas a cesariana entre 2005 e 2011. Analisaram-se as taxas de cesarianas, incluindo a taxa de primeiras cesarianas e de cesarianas repetidas. Para avaliar a contribuição relativa de cada uma das indicações na variação da taxa de primeiras cesarianas recorreu-se à regressão linear e determinou-se o valor do r2 ajustado.
Resultados: Durante o período do estudo a taxa de cesarianas diminuiu de 30,9% para 27,6%. Esta descida deveu-se à diminuição da taxa de primeiras cesarianas (21,9% para 18,2%), apesar de se ter constatado um ligeiro aumento da taxa de cesarianas repetidas (9,0 para 9,4%). Entre as indicações para primeiras cesarianas, as causas materno-fetais e de apresentação anómala foram as que diminuiram mais, com valores de r2 ajustado de 0,70 e 0,55, respectivamente.
Discussão: Os dados coligidos permitiram identificar a hipótese de que a diminuição da taxa de cesarianas se deveria a uma ret-ração detectada sobretudo a nível das primeiras cesarianas, em particular as decorrentes de causas materno-fetais e apresentação anómala.
Conclusão: A diminuição da taxa de primeiras cesarianas pode ser atribuída a várias modificações na prática clínica do Departa-mento, como a implementação da versão cefálica externa, a indução do trabalho de parto a partir das 41 semanas de gestação, em gravidezes de baixo risco e da realização de provas de trabalho de parto em casos de patologia materno-fetal. No entanto, indicações subjectivas, como a paragem de progressão do trabalho de parto e a suspeita de sofrimento fetal são ainda causas major de primeiras cesarianas.
Palavras-chave: Cesarianas; Gravidez; Complicações da Gravidez; Hospital Terciário; Portugal.
AbSTRACT
Introduction: To analyze the cesarean section rate evolution in a tertiary hospital and the main indications for cesarean section. Material and Methods: A retrospective study was conducted at a major academic hospital and included 5 751 women who had a ce-sarean section from 2005 to 2011. The rates of overall, primary and repeat cece-sarean sections were analyzed. A linear regression and adjusted R-square were used to access the relative contribution of each indication to the variation in primary cesarean section.
Results: During the 7-year period of the study the cesarean section rate decreased from 30.9% to 27.6%. This was due to a decrease in primary cesarean section (21.9% to 18.2%), although an increase in repeat cesarean section was observed (9.0% to 9.4%). Among the indications for primary cesarean section, maternal-fetal indications and malpresentation were the ones that decreased the most with adjusted R-square of 0.70 and 0.55, respectively.
Discussion: The collected data identified that the decrease in the cesarean section rate at the hospital resulted from a decrease in primary cesarean section deliveries, especially the ones performed for maternal-fetal indications and malpresentation.
Conclusion: The decrease in primary cesarean section rate may be attributed to several changes in medical policies in the Depart-ment, such as the implementation of an external fetal version program, the induction of labor only after the 41st week of gestation in low-risk pregnancies and the trial for vaginal birth in maternal-fetal disease. Nevertheless subjective indications such as labor arrest disorders and nonreassuring fetal heart rate are still major contributors for primary cesarean section rate.
Keywords: Cesarean Section; Pregnancy; Pregnancy Complications; Portugal; Tertiary Care Centers.
INTRODUCTION
Cesarean section (CS) rates have been rising worldwide over the past decades. Concern regarding this increase is due to potential maternal and perinatal risks, the possibility of obstetric complications in future pregnancies and finan-cial issues.Therefore, there has been an attempt to define the ideal CS rate but there is no general consensus on this issue. In 1985, the World Health Organization recommen-ded that it should not exceed 15%.1 Nonetheless, differenc-es among countridifferenc-es, primary and tertiary hospitals, such as the resources and the population characteristics, demand that this rate should be adapted to each reality.1
In Portugal, according to the National Institute of Statis-tics, the CS rate per live births has increased from 28.0% to 36.4% between 2001 and 2009. The National Health Plan estimates that in 2016 this rate might reach 45.7%.2
ARTIGO ORIGINAL in primary CS, since a first cesarean usually determines that subsequent deliveries will be abdominal deliveries.5
The objectives of this study were to analyze the CS rate evolution in our Department between 2005 and 2011, to identify the factors that contributed to this evolution and the main indications for primary CS deliveries.
MATERIAL AND METHODS
We conducted a retrospective study at the Department of Obstetrics, Gynecology and Medicine of Reproduction of Centro Hospitalar Lisboa Norte (CHLN) – Hospital de Santa Maria (HSM), a tertiary hospital that holds an agreement with the University of Lisbon working as a University/Public Hospital.
This study was approved by the Ethics Committee of the institution.
Data was collected about all the CS performed during a 7-year period (2005-2011) from medical records of the De-livery Room and Postpartum Ward. We included informa-tion about parity, previous CS, number of fetus in present gestation (single vs. multiple), and the primary indication for CS.
Rates of overall, primary and repeat CS were calculated for each year. CS rates were calculated as the number of cesarean births divided by total live births. Rates for each primary CS indications were calculated annually as the number of primary CS deliveries performed for each indica-tion per 1,000 eligible live births (adjusted for repeat cesa-rean delivery rate).
In order to facilitate data analysis we combined indica-tions for CS in nine larger representative categories: labor arrest disorders (including arrest of dilation or descent and failure of a trial for instrumental vaginal delivery), suspected fetal distress (in fetal heart tracings or ultrasound evalua-tions), malpresentation, macrosomia, multiple gestations, maternal-fetal indications, hypertensive disease in pre-gnancy, repeat cesarean section and other causes. Malpre-sentation included breech preMalpre-sentation, nonvertex cephalic
presentations and transverse lie. Macrosomia was defined as an estimated fetal weight of more than 4,500 g for non-diabetic women and more than 4,000 g for non-diabetic women, which were the thresholds for elective CS. Maternal-fetal indications included fetal, maternal or obstetric conditions that contraindicated vaginal birth such as some fetal con-genital malformations, cardiac or orthopedic maternal di-. seases and placenta previa or cord prolapsed. Although hypertensive disease in pregnancy (chronic hypertension predating the pregnancy, preeclampsia and eclampsia) is not an isolated indication for elective CS and the decision should take into account obstetric criteria, it was considered a category because of its high frequency. Other causes in-cluded all the indications that could not be grouped into one of the other eight categories, such as failed labor induction. We calculated the relative variation of primary CS and their indications for each year of the study. We assessed the contribution of each indication to the variation in primary CS linear regression and by calculating the adjusted R-square (r2).
Data analysis was performed using the SPSS version 19.0 (IBM, Armonk, NY, USA).
RESULTS
From January 2005 to December 2011 there were a to-tal of 19,471 live births in the Hospito-tal de Santa Maria. Of these 5,751 were delivered by CS (29.5%).
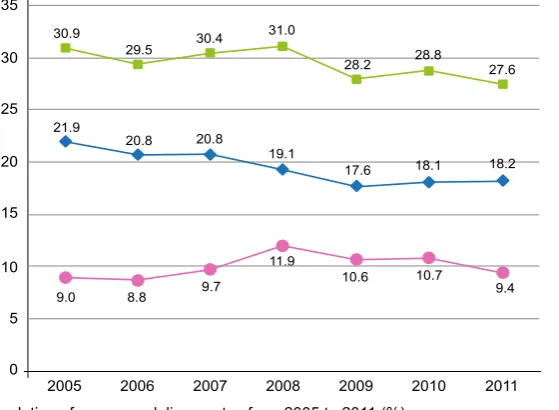
The evolution of the CS delivery rate during that pe-riod of time is shown in Fig. 1. The overall CS delivery rate decreased from 30.9% in 2005 to 27.6% in 2011. During the 7-year period of the study, the CS rate decreased each year except for the years 2008 and 2010, when there was a slight increase (from 30.4% in 2007 to 31.0% in 2008 and from 28.2% in 2009 to 28.8% in 2010, Fig. 1).
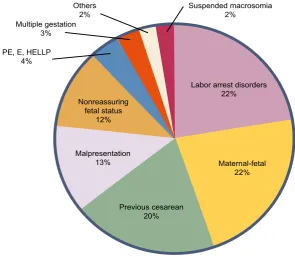
The main indications for CS were labor arrest disorders and maternal-fetal indications (which contributed to 44% of all CS), followed by repeat CS (20%), malpresentation (13%) and nonreassuring fetal status (12%). Hypertensive
9.4 10.7
10.6 11.9
9.7 8.8
9.0
2011 2010
2009 2008
2007 2006
35
30
25
20
15
10
5
0 2005
Repeat cesarean delivery rate Primary cesarean delivery rate Overall cesarean delivery rate 18.2
18.1 17.6
19.1 20.8
20.8 21.9
27.6 28.8
28.2 31.0
30.4 29.5
30.9
ARTIGO ORIGINAL
disorders, multiple gestation and suspected macrosomia accounted for about 9% of the CS delivery rate (Fig. 2). The overall repeat CS rate increased from 9.0% in 2005 to 9.4% in 2011 (Fig.1). There was an increase of the repeat CS rate from 2006 (8.8%) to 2008 (11.9%), but after that it decreased to 10.6% in 2009 and to 9.4% in 2011.
The primary CS rate decreased steadily from 2005 to 2009, followed by a small increase until 2011 (from 17.6% in 2009 to 18.2% in 2011). Despite this, from 2005 to 2011 there was a decrease in the overall primary CS rate from 21.9% to 18.2%.
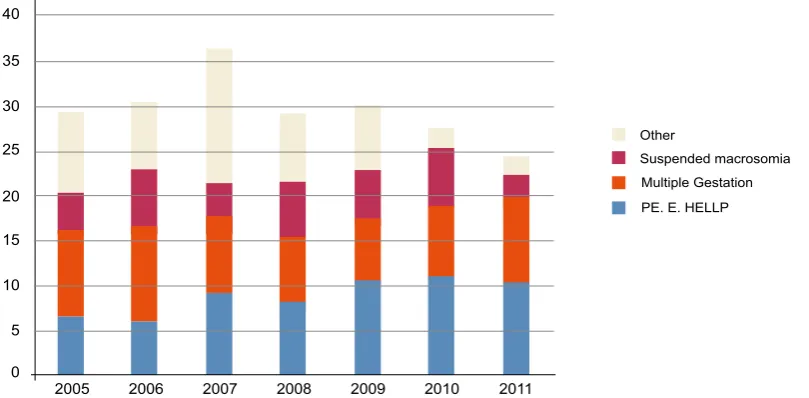
Since the primary CS deliveries were responsible for the decrease in the CS rate we analyzed the variation of primary CS performed by all indications (Fig.s 3a and 3b). The main indications for primary CS prevailed during this period and were labor arrest disorders, maternal-fetal in-dications, malpresentation and nonreassuring fetal status. From 2005 to 2011 the primary CS deliveries had a mean annual relative decrease of 2.83%, (95% confidence inter-val [CI] -6.51 to 0.85) (Table 1). Among all the indications for CS, maternal-fetal conditions and malpresentation were the ones that decreased the most with an average annual decrease of 6.40% (95% confidence interval [CI] -16.88 to 4.08) and 1.84% (95% confidence interval [CI] -14.29 to 10.62), respectively. We verified an increase in primary CS performed for hypertensive disorders (average annual increase 10.12% (95% confidence interval [CI] -11.94 to 32.17).
Among the documented causes for primary CS, mater-nal-fetal indications and malpresentation where the ones which correlated the better with the decrease in the primary
CS rate, with adjusted R-square of 0.70 and 0.55, respec-tively.
DISCUSSION
According to our data the decrease in the CS rate at our hospital was due to a decrease in primary CS deliveries, especially the ones performed for maternal-fetal indications and malpresentation.
During the study period a series of measures were implemented in our department to decrease the CS rate. These include the practice of external cephalic version (ECV), the induction of labor only after the 41th week of
ges-tation in low-risk pregnancies and the trial of vaginal birth after a cesarean section (VBAC). The continuous training of the residents in the use of forceps and vacuum extractor and a more expectant management of labor may have also contributed to our results.
The decrease of CS performed for maternal-fetal indica-tions might be due to the use of induction of labor for some obstetric indications such as colesthasis of pregnancy, olygoamnios and fetal growth restriction, when there was no contraindication for vaginal delivery. Therefore, by indu-cing these women in a tertiary center, we ensured that labor would occur with maximum support of the obstetric team and allowed a vaginal birth.
The reduction of CS delivery for malpresentation could be due to the practice of external cephalic version. In our Department, the procedure is done after the 36th week and
the success rate of ECV is 44.4%.7
The criteria for diagnosing labor arrest disorders in the first and second stage of labor remains controversial.3-8
Labor arrest disorders 22%
Maternal-fetal 22%
Previous cesarean 20% Malpresentation
13% Nonreassuring
fetal status 12%
Suspended macrosomia 2%
Others 2% Multiple gestation
3%
PE, E, HELLP 4%
Figure 2 - Distribution of all indications for overall cesarean deliveries.
ARTIGO ORIGINAL
During the study period, the relative contribution of labor arrest disorders for CS has decreased. We were not able to verify which CS were performed for arrest of dilation, a more subjective indication, or arrest of descent. However, a more expectant management of labor in order to achieve vaginal delivery could explain this decrease.8-10 This may be
important since many women may not be in active phase until 6 cm of dilatation.8,11 Furthermore, we frequently used
oxytocin whether to induce or enhance labor, while continu-ously monitoring the fetal heart rate. Also, when indicated, we performed instrumental deliveries in cases of arrest of descend to avoid potential risks associated with full dilata-tion CS.3
Cesarean deliveries performed for macrosomia have had a mean annual decrease of only 0.32%. Although there has been a great variation through the years in the CS
per-formed for macrosomia, the overall relative decrease of CS due to macrosomia might be because physicians follow specific criteria to deliver suspected macrosomic fetus. During the time period of our study, CS performed for nonreassuring fetal status, hypertensive disorders, and multiple gestations have increased. The high variability in the interpretation of fetal heart tracings and fear of litigation could have influenced the decision for a CS in these situ-ations. As for preeclampsia, international guidelines state that labor should be induced, unless there is any obstetric indication for CS.12,13 Still, the relative contribution of these
indications for primary CS rate might indicate the use of CS rather than induction of labor to manage these situations. The increasing incidence of twins and higher-order multiple gestations over the past years due to medically assisted reproductive techniques might explain the increase in the
2011 2010
2009 2008
2007 2006
300
250
200
150
100
50
0
2005
Labor arretsed disorders Maternal-fetal Malpresentation Nonreassuring fetal status Other
Figure 3a - Number of primary cesarean deliveries performed for 1,000 eligible live births. Primary cesarean sections performed from 2005 to 2011 for each indication. The ‘other’ category is described in (b).
5 10
2011 2010
2009 2008
2007 2006
40
35
30
25
20
15
0
2005
PE. E. HELLP Multiple Gestation Suspended macrosomia Other
Figure 3b - Number of primary cesarean deliveries performed for 1,000 eligible live births. Primary cesarean sections performed from 2005 to 2011 for each indication. The ‘other’ category represented in (a) is described, with a smaller scale. Eligible live births were births to women with no previous cesarean delivery.
ARTIGO ORIGINAL
Table 1
- Primary Cesarean Delivery Rates per 1,000 eligible births and Mean
Annual Increase by Indication from 2005 to 201
1
(Adjusted for Repeat Cesarean Delivery Rate)
*
2005
(
n
= 2 698)
2006
(
n
= 2 549)
2007
(
n
= 2 522)
2008
(
n
= 2 503)
2009
(
n
= 2 461)
2010
(
n
= 2 362)
201
1
(
n
= 2 429)
Absolute Increase 2005 - 201
1
†
Mean
Annual Increase [%(95% CI)]
‡
Primary cesarean deliveries
240.5 227.5 230.0 216.9 197.1 202.4 201.3 -39.2 -2.83 (-6.51-0.85)
Labor arrest disorders
63.0 69.0 64.2 59.9 63.8 58.4 60.5 -2.5 -0.41 (-6.71-5.88) Maternal-fetal ‖ 67.5 54.9 53.1 55.5 45.5 51.2 43.2 -24.2 -6.40 (-16.88-4.08) Malpresentation § 46.0 36.9 39.7 34.8 31.7 31.3 38.7 -7.3 -1.84 (-14.29-10.62)
Nonreassuring fetal status
34.8 36.1 36.5 37.6 26.0 33.9 34.6 -0.3 1.53 (-13.95-17.02)
PE, E, HELLP
¶ 6.7 5.9 9.1 8.0 10.6 11.0 10.3 3.6 10.12 (-1 1.94-32.17) Multiple Gestation 9.3 11.0 8.3 7.6 6.9 8.0 9.5 0.2 1.78 (-12.77-16.33) Suspected macrosomia ** 4.4 5.9 4.0 6.0 5.3 6.4 2.5 -2.0 -0.32 (-34.28-33.64) Others †† 8.9 7.8 15.1 7.6 7.3 2.1 2.1 -6.8 -7.81 (-52.75-37.14)
CI, confidence interval; *all repeat cesarean deliveries were excluded from the analysis †Dif
ference in primary cesarean rate per 1,000 eligible births (rate in 201
1 minus rate in 2003)
‡Estimated mean annual increase calculated by linear regression using data from all years ‖Includes fetal, maternal or obstetric conditions that contraindicate vaginal birth §Includes breech presentation, nonvertex cephalic presentations and transverse lie ¶PE, preeclampsia; E, eclampsia; HELLP
, hemolysis, elevated liver enzymes and low platelets
ARTIGO ORIGINAL
REFERENCES
1. Gibbons L, Belizan JM, Lauer JA, Betran AP, Merialdi M, Althabe F. Ine-quities in the use of cesarean section deliveries in the world. Am J Ob-stet Gynecol. 2012;206:331.e1-19.
2. General Health Department. National Health Plan 2012-2016: Health Indicators and goals. [Accessed 2012 Nov 15]. Available at URL: http://pns.dgs.pt/files/2012/02/Indicadores_e_Metas_em_Saude1.pdf Published 2011.
3. Untersheider J, McMenamin M, Cullinane F. Rising rates of cesarean deliveries at full dilatation: a concerning trend. Eur J Obstet Gynecol Reprod Biol. 2001;157:141–4.
4. Dresang TL, Leeman L. Cesarean delivery. Prim Care Clin Office Pract. 2012;39:145-65.
5. MacDorman M, Declerq E, Menacker F. Recent trends and patterns in cesarean and vaginal birth after cesarean (VBAC) deliveries in the United States. Clin Perinatol. 2011;38:179-92.
6. Robson MS. Can we reduce the caesarean section rate? Best Pract Res Clin Obstet Gynaecol. 2001;15:179-94.
7. Fadigas C, Santo S, Clode N, Pinto L, Graça LM. External cephalic version: experience of a maternal-fetal unit. Acta Obstet Ginecol Port. 2011;5:3-7.
8. Zhang J, Troendle J, Reddy UM, Laughon SK, Branch DW, Burkman R, et al. Contemporary cesarean delivery practice in the United States. Am J Obstet Gynec. 2010;203:326.e1-10.
9. Mancuso MS, Dwight JR. Cesarean delivery for abnormal labor. Clin Perinatol. 2008;35:479-90.
10. Delbaere I, Cammu H, Martens E, Tengy I, Martens G, Temmerman M. Limiting the caesarean section rate in low risk pregnancies is a key to
lowering the trend of increased abdominal deliveries: an observational study. BMC Pregnancy Childbirth. 2012;12:3.
11. Zhang J, Troendle J, Mikolajczyk R, Sundaram R, Beaver J, Fraser W. The natural history of the normal first stage of labor. Obstet Gynecol. 2010;115:705–10.
12. American College of Obstetrics and Gynecologists. ACOG Commit-tee on Obstetric Practice. ACOG Practice Bulletin. Diagnosis and management of preeclampsia and eclampsia. Int J Gynaecol Obstet. 2002;77:67-75.
13. Sibai BM. Management of late preterm and early-term pregnancies complicated by mild gestacional hypertension/ pre-eclampsia. Semin Perinatol. 2011;35:292-6.
14. Torloni MR, Betran AP, Souza JP, Widmer M, Allen T, Gulmezoglu M, et al. Classifications for cesarean section: a systematic review. PLoS ONE. 2011;6:e14566.
15. Robson MS. Classification of cesarean section. Fetal Maternal Med Rev. 2001;12:23-39.
16. Jackson S, Fleege L, Fridman M, Gregory K, Zelop C, Olsen J. Morbidity following primary cesarean delivery in the Danish National Birth Cohort. Am J Obstet Gynecol. 2012;206:139.e1-5.
17. Marshall NE, Fu R, Guise J-M. Impact of multiple cesarean deli-veries on maternal morbidity: a systematic review. Am J Obstet Gynecol. 2011;205:262.e1-8.
18. Barber EL, Lundsberg LS, Belanger K, Pettker CM, Funai EF, Illuzi JL. Indications contributing to the increasing cesarean delivery rate. Obstet Gynecol. 2011;118:29-38.
CS performed for these indications.
Finally, from 2005 to 2011 we verified an increase in the repeat cesarean rate, despite there is general con-sensus that the benefits of VBAC outweigh the risk of re-peated CS in most women.5 Since it is a safe procedure
when performed in selected patients, we offered VBAC to all pregnant women who were eligible for a trial of labor. Nonetheless, we did not induce labor in women with a prior abdominal delivery and a CS was performed systematically after the 41th week of pregnancy if labor didn’t occur spon-taneously. This might explain the increase in the repeated CS.
As this is a retrospective study and data was collected from medical records, there could have been errors in the classification of CS. We used a classification based on the indications to the CS to analyze the specific contribution of each indication to the variation in the CS rate. However, this is a highly subjective classification system and CS might have been performed for more than one indication.14 Other classification systems could have been used such as the ten-group classification, proposed by Robson, which is use-ful to assess the characteristics of the women that contri-bute the most to the CS rate.6,15 Also, we could not analyze
the demographic and obstetrics characteristics of our popu-lation. The data collected represents a single institution in Portugal so cannot be generalized to other populations.
CONCLUSION
Despite the mentioned limitations, this study is impor-tant as it reflects the efforts of one-single institution in reduc-ing CS rates. Avoidreduc-ing the first CS increases the probability of a vaginal birth in a subsequent pregnancy and decreases
the adverse events associated with cesarean delivery.16,17
Although this study was not able to assess the causal effect of all the measures implemented in our department to decrease CS rates, we could infer that they had a benefi-cial impact in the CS rate. Practice in operative deliveries, vaginal twin deliveries and external cephalic version should continue and VBAC should be offered to selected patients. Efforts should be done to improve the interpretation of fetal heart tracings, to assess labor arrest disorders and to esti-mate fetal weight accurately. Hypertensive disorders should be managed correctly and elective CS should be performed only if induction of labor is contraindicated. Regular audits must be made to assess whether abdominal deliveries were appropriated in each case.6,10
Although it is important to reduce CS rates in order to improve maternal and neonatal outcomes, CS rates that are too low may be associated to increased adverse events, especially when we consider tertiary and referral centers, such as our institution. Therefore, caution should be ta-ken when considering a 15% CS rate, as this may be too low.6,10,18 Finally, it is important to involve the patient in all
medical decisions whenever possible and to increase pa-tient education in order to avoid litigation.17
CONFLICT OF INTERESTS None stated.
FUNDING SOURCES AND FURTHER INFORMATION This work was previously delivered as a Poster at the 17th World Congress on Controversies in Obstetrics,