PICTORIAL REVIEW
MR imaging of ovarian masses: classification
and differential diagnosis
Pietro Valerio Foti1&Giancarlo Attinà1&Saveria Spadola2&Rosario Caltabiano2&
Renato Farina1&Stefano Palmucci1&Giuseppe Zarbo3&Rosario Zarbo3&
Maria D’Arrigo4&Pietro Milone1&Giovanni Carlo Ettorre1
Received: 13 August 2015 / Revised: 18 November 2015 / Accepted: 27 November 2015 / Published online: 16 December 2015 #The Author(s) 2015. This article is published with open access at Springerlink.com
Abstract
Objective We propose a Magnetic Resonance Imaging (MRI) guided approach to differential diagnosis of ovarian tumours based on morphological appearance.
BackgroundCharacterization of ovarian lesions is of great importance in order to plan adequate therapeutic procedures,
and may influence patient’s management. Optimal assessment
of adnexal masses requires a multidisciplinary approach, based on physical examination, laboratory tests and imaging techniques. Primary ovarian tumours can be classified into three main categories according to tumour origin: epithelial, germ cell and sex cord-stromal tumours. Ovarian neoplasms may be benign, borderline or malignant. Using an imaging-guided approach based on morphological appearance, we classified adnexal masses into four main groups: unilocular cyst, multilocular cyst, cystic and solid, predominantly solid. We describe MR signal intensity features and enhancement behaviour of ovarian lesions using pathologically proven ex-amples from our institution.
ConclusionMRI is an essential problem-solving tool to de-termine the site of origin of a pelvic mass, to characterize an
adnexal mass, and to detect local invasion. The main advan-tages of MRI are the high contrast resolution and lack of ionizing radiation exposure. Although different pathological conditions may show similar radiologic manifestations, radi-ologists should be aware of MRI features of ovarian lesions that may orientate differential diagnosis.
Teaching Points
•Diagnostic imaging plays a crucial role in detection, char-acterization and staging of adnexal masses.
• Characterization of an ovarian lesion may influence pa-tient’s management.
• Different pathological conditions may have similar radio-logic manifestations.
• Non-neoplastic lesions should always be taken into consideration.
Keywords Ovary . Magnetic resonance imaging . TNM
staging . Ovarian cancer . Tumour staging
Introduction
Ovarian masses are a common finding in daily clinical prac-tice and may be incidentally detected or identified in symp-tomatic patients. Characterization of an ovarian lesion repre-sents a diagnostic challenge; it is of great importance in the preoperative setting in order to plan adequate therapeutic
pro-cedures and may influence patient’s management.
Magnetic resonance (MR) imaging may provide useful in-formation for the characterization of ovarian masses as non-neoplastic or non-neoplastic, and, in the latter case, as benign or malignant. Therefore, radiologists play an important role in the multidisciplinary approach of ovarian mass, and, though different pathological conditions may have similar radiologic * Pietro Valerio Foti
1 Radiodiagnostic and Radiotherapy Unit, University Hospital
BPoliclinico-Vittorio Emanuele^, Via Santa Sofia 78, 95123 Catania, Italy
2
Department G.F. Ingrassia–Institute of Pathology, University of Catania, Catania, Italy
3
Department of General Surgery and Medical-Surgical Specialties– Institute of Obstetrics and Ginecology, University of Catania, Catania, Italy
4 Pathology Unit, University HospitalBPoliclinico-Vittorio
manifestations, they should be aware of MR imaging features of ovarian lesions that may orientate the differential diagnosis. In this article, we review epidemiology, etiopathogenesis, classification, staging and diagnostic approaches to ovarian masses. We propose an MR imaging-guided approach to the differential diagnosis of ovarian tumours based on morpho-logical appearance. We describe MR signal intensity features (e.g., haemorrhagic areas, elevated protein content, fat and collagenous tissue) and enhancement behaviour of each lesion using pathologically proven examples from our institution. Our MR protocol is also included.
Epidemiology
Ovarian cancer is currently one of the most common forms of cancer among women worldwide, responsible for 3.6 % of all cases, with a mortality of 4.3 %. In Europe, it is the leading cause of cancer death among gynaecologic malignancies, ranking fifth in incidence (exceeded only by breast, colorectum, lung and corpus uteri) and sixth in mortality
among all women’s cancer (exceeded by breast, colorectum,
lung, pancreas and stomach) [1]. An important reason for the
high mortality rates of this cancer is the late diagnosis. Many patients present in advanced stage, mostly because the disease is often asymptomatic or associated with nonspecific symp-toms in the early stage. Incidental detection of adnexal mass is very common in clinical practice.
Etiopathogenesis
Etiopathogenesis of ovarian tumours is not fully understood; however, it appears to be multifactorial. The leading risk fac-tor is familiarity; namely, hisfac-tory of ovarian cancer in a
first-degree relative. However, only 5–10 % of cases are related to
hereditary syndromes: the main one is the breast-ovarian can-cer syndrome, due to mutations in the BRCA1 and BRCA2
tumour suppressor genes. Approximately 90–95 % of cases
are sporadic, with an increasing risk related to nulliparity, early menarche and late menopause, while pregnancy, lacta-tion, early menopause and use of oral contraceptives appear to
be protective factors [2]. Hereditary cases occur
predominant-ly in premenopausal age, while the sporadic ones affect mostpredominant-ly older women.
Classification
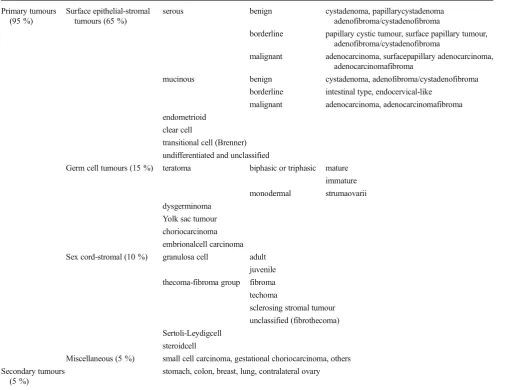
Primary ovarian tumours can be classified into three main categories according to tumour origin: epithelial, germ cell and sex cord-stromal tumours; ovaries are also affected by
metastastic tumours (Table1) [3]. Epithelial tumours account
for approximately 85 % of ovarian malignancy: the most com-mon type is serous carcinoma. Dermoid cyst (mature cystic teratoma) is the most common benign ovarian neoplasm. Sex
cord-stromal neoplasms may produce hormones, both oestrogen and androgens, resulting in endocrinological symp-toms. Ovarian neoplasms may be benign, borderline or malig-nant. In addition, several benign lesions should also be con-sidered, namely functional and haemorrhagic cyst, as well as endometriomas.
Staging
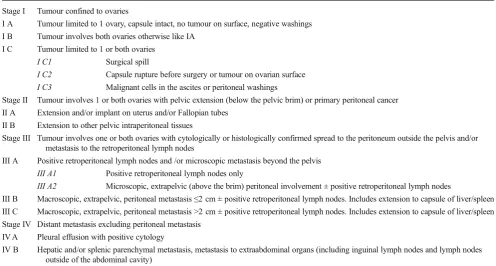
There are two staging systems to describe the spread of ovarian tumours: the TNM (tumour, node, metastasis) and the International Federation of Gynecology and Obstetrics (FIGO). The FIGO system has been recently revised and
went into effect on 1 January 2014 (Table 2). Basically,
stage I describes tumours confined to ovaries, stage II reflects pelvic extension or primary peritoneal cancer, stage III indicates spread to the peritoneum outside the pelvis and/or metastasis to the retroperitoneal lymph nodes, while stage IV refers to distant metastasis. Ovarian cancer may show direct extension to surrounding pelvic structures, as well as intraperitoneal, lymphatic and hema-togenous spread. Local invasion of uterus, fallopian tubes and contralateral adnexa can be found, while the involve-ment of bladder and rectum is less frequent. One of the most important features of ovarian cancer is intraperitone-al dissemination by exfoliation of cells, often associated with a variable amount of ascites: pouch of Douglas, greater omentum and subphrenic region are the most com-mon sites of implantation, probably because of the pref-erential circulatory path of peritoneal fluid. Lymphatic dissemination is most common to para-aortic and paracaval lymph nodes, following the ovarian veins; path-ologic lymph nodes can also be found in pelvic (external iliac, hypogastric and obturatory) and inguinal chains. In-cidence of lymph node metastasis has been estimated to be about 25 % in stage I patients, about 50 % in patients with stage II disease and about 74 % in advanced stages. In addition, in patients with intraperitoneal disseminated disease, there is a possibility of approximately 30 % of pelvic, para-aortic or inguinal lymph nodes involvement
[4]. Hematogenous metastases are less frequent and most
often tend to involve liver and lung; however spleen, bone, brain and other locations may be affected.
Approach to adnexal masses
be performed in ovarian masses, particularly if the mass ap-pears to be surgically resectable at the moment, as this inva-sive procedure raises the risk of spreading cancer cells and potentially leads to iatrogenic upstaging worsening the prognosis.
Serum markers
The most commonly used serum tumour marker for epithelial tumours is cancer antigen (CA)-125. In postmenopausal wom-en, CA-125 has high sensitivity as well as high specificity, while in premenopausal women, it has an high sensitivity but low specificity, because it may also be elevated in other conditions (e.g., peritoneal inflammation, endometriosis, etc.). Human epididymis protein 4 (HE4) is a recently added tumour marker and several studies have shown his usefulness in dis-criminating between benign and malignant adnexal masses in
premenopausal women [5,6].
Diagnostic imaging
Diagnostic imaging plays a crucial role in detection, charac-terization and staging of adnexal masses.
Ultrasound (US)is often the first imaging study performed
in the evaluation of a suspected ovarian lesion because it’s
widely available, well accepted by patients, non-invasive and of low cost. A combination of greyscale and colour Dopp-ler features, obtained with transabdominal and/or endovaginal scanning, allow for investigation of both morphological struc-ture and vascular organization of the ovarian mass. Morpho-logical features suggestive of malignancy include thickness
(>2–3 mm) and irregularity of walls and septa, the presence
of solid areas and papillary projections, as well as other evi-dence of malignant activity, namely ascites, peritoneal nodules and metastatic lesions. Regarding the vascularization, colour Doppler study is able to demonstrate both the presence and the localization of new tumour blood vessel: a predominantly central blood flow is more often associated with malignancy,
Table 1 Histological classification of ovarian tumours adapted from WHO
Primary tumours (95 %)
Surface epithelial-stromal tumours (65 %)
serous benign cystadenoma, papillarycystadenoma adenofibroma/cystadenofibroma
borderline papillary cystic tumour, surface papillary tumour, adenofibroma/cystadenofibroma
malignant adenocarcinoma, surfacepapillary adenocarcinoma, adenocarcinomafibroma
mucinous benign cystadenoma, adenofibroma/cystadenofibroma borderline intestinal type, endocervical-like
malignant adenocarcinoma, adenocarcinomafibroma endometrioid
clear cell
transitional cell (Brenner) undifferentiated and unclassified
Germ cell tumours (15 %) teratoma biphasic or triphasic mature immature monodermal strumaovarii dysgerminoma
Yolk sac tumour choriocarcinoma embrionalcell carcinoma Sex cord-stromal (10 %) granulosa cell adult
juvenile thecoma-fibroma group fibroma techoma
sclerosing stromal tumour unclassified (fibrothecoma) Sertoli-Leydigcell
steroidcell
Miscellaneous (5 %) small cell carcinoma, gestational choriocarcinoma, others Secondary tumours
(5 %)
while a peripheral one is more typical of a benign lesion [7]. In an ultrasound-indeterminate adnexal mass, Doppler ultra-sound has shown a sensitivity of 84 % and a specificity of
82 % in diagnosing cancer [8]. Wu et al., on a recent
meta-analysis of ten independent studies, reported a high diagnostic accuracy of contrast-enhanced ultrasound in distinguishing
between benign and malignant ovarian masses [9]. However,
unless morphological and vascularity features clearly indicate a benign lesion, further assessment is mandatory. Levine et al., in a consensus statement (2009) for the Society of Radiolo-gists in Ultrasound, made recommendations about
manage-ment of adnexal masses:BAdnexal masses in the physiologic
range in terms of size and appearance in a woman of menstrual age or a simple adnexal cyst less than or equal to 1 cm in a postmenopausal woman are likely benign; these findings are almost always of no clinical importance in asymptomatic
women and can be safely ignored^[10].
Computed Tomography (CT)of the abdomen and pelvis after contrast administration is important both in evaluation of spread of malignant lesions and in detection of recurrence after therapy, whereas it has a limited value in primary detec-tion and characterizadetec-tion of an ovarian mass. With CT scans, only lesions containing fat tissue and calcifications, like ma-t u r e ma-t e r a ma-t o m a , c a n b e e a s i l y c h a r a c ma-t e r i z e d . I n a sonographically indeterminate adnexal mass, CT has shown a sensitivity of 81 % and a specificity of 87 % in ovarian
cancer diagnosis [8]. CT is the imaging technique of choice
in staging: looking for omental and peritoneal implants,
ascites and lymphadenopathy is very important to assess the
extension of the disease [8]. Therapy response evaluation is
usually performed with CT, comparing pre-treatment with post-treatment scans (preferably after six cycles of chemother-apy). An interval between the CT scans of only three cycles of chemotherapy is indicated if serum markers are negative or
their levels are not decreasing [11].
18
F-FDG PET/CTis being increasingly used and its role in the evaluation of ovarian tumours appears to be crucial in the postoperative follow-up of patients with suspected recurrence
[8,12]. This imaging modality demonstrated a sensitivity of
up to 91 % and a specificity up to 100 % in the detection of cancer recurrence, and plays a crucial role especially when CT
scans are negative but serum marker levels increase [11]. PET/
CT is not usually performed in the initial evaluation of these patients, mostly because it may lead both to false-positive and false-negative results. It has to be considered that several be-nign lesions, particularly teratomas and endometriomas, may show FDG uptake, whereas small (<1 cm), necrotic and
low-grade tumour may not [4]. However, finding an increased
FDG uptake in postmenopausal women has always to be con-sidered an abnormality.
Magnetic Resonance Imaging (MRI)is an essential prob-lem solving tool to determine the site of origin of a pelvic mass and then to characterize an adnexal mass, especially in
pa-tients with indeterminate lesions [13,14]. MRI is also reliable
in detecting local invasion. The main advantages of MRI are the high contrast resolution with excellent soft tissue contrast
Table 2 FIGO system for ovarian cancer staging
Stage I Tumour confined to ovaries
I A Tumour limited to 1 ovary, capsule intact, no tumour on surface, negative washings I B Tumour involves both ovaries otherwise like IA
I C Tumour limited to 1 or both ovaries I C1 Surgical spill
I C2 Capsule rupture before surgery or tumour on ovarian surface I C3 Malignant cells in the ascites or peritoneal washings
Stage II Tumour involves 1 or both ovaries with pelvic extension (below the pelvic brim) or primary peritoneal cancer II A Extension and/or implant on uterus and/or Fallopian tubes
II B Extension to other pelvic intraperitoneal tissues
Stage III Tumour involves one or both ovaries with cytologically or histologically confirmed spread to the peritoneum outside the pelvis and/or metastasis to the retroperitoneal lymph nodes
III A Positive retroperitoneal lymph nodes and /or microscopic metastasis beyond the pelvis III A1 Positive retroperitoneal lymph nodes only
III A2 Microscopic, extrapelvic (above the brim) peritoneal involvement ± positive retroperitoneal lymph nodes
III B Macroscopic, extrapelvic, peritoneal metastasis≤2 cm ± positive retroperitoneal lymph nodes. Includes extension to capsule of liver/spleen III C Macroscopic, extrapelvic, peritoneal metastasis >2 cm ± positive retroperitoneal lymph nodes. Includes extension to capsule of liver/spleen Stage IV Distant metastasis excluding peritoneal metastasis
IV A Pleural effusion with positive cytology
and lack of ionizing radiation exposure, which is particularly important in young female patients.
In order to obtain anatomic information and to study mor-phological and signal intensity characteristics of the mass, both T1- and T2-weighted sequences are needed. Fat-saturated T1-weighted images are helpful to detect haemorrhagic areas and fat tissue. The use of intravenous gadolinium improves detection of enhancing septa and solid components within the mass and of peritoneal and omental implants.
In the evaluation of adnexal masses indeterminate on ultra-sound, unenhanced MRI has shown a sensitivity and a spec-ificity of 76 and 97 %, respectively, in the diagnosis of ovarian cancer; assessment with contrast-enhanced MRI increases
sensitivity to 81 % and specificity to 98 % [8].
Diffusion-weighted imaging (DWI) is a potentially useful technique in the assessment of adnexal masses; however, its role has been controversial in literature. For Katayama et al.
[15] and Fujii et al., [16], DWI respectivelyBis not useful^and
Bprovide no additional information^in discriminating benign
from malignant ovarian masses. In 2009, Thomassin-Naggara et al. demonstrated that the combination of diffusion-weighted and T2-weighted images is helpful in predicting benignity and malignancy: masses with low signal intensity on both se-quences were more likely benign, while lesions with high signal intensity on DWI and intermediate signal on
T2-weighted images were more likely malignant [17]. Recently,
other studies [18,19] have shown that high signal intensity on
DWI is more frequent within malignant lesions and is useful for differentiating them from benign ones. It has to be consid-ered that several benign lesions, namely endometriomas, ter-atomas and fibrothecomas, may also show restricted diffusion; however, a confident diagnosis of these lesions can usually be done with T1-weighted, T1-weighted fat-suppressed and
T2-weighted standard sequences [20]. In a paper published in
2010, Kyriazi et al. investigated the role of DWI in the imag-ing of peritoneal carcinomatosis in patients with advanced ovarian cancer, showing that it could be helpful in the assess-ment of volume and location of disease sites, as well as in
monitoring recurrence [21]. In 2014, Zhao et al. demonstrated
that DWI is useful in the differentiation of borderline and
malignant epithelial ovarian tumours [22]. In our opinion,
diffusion-weighted images should be included in MRI protocol.
The role of 1.5 T MRI in the assessment of ovarian masses has been widely established, but only in recent years have 3 T MR systems been applied in the study of gynaecologic diseases.
As for the magnetic field strength, the main advantage of 3 T MR systems is the expected increase in MR signal-to-noise ratio (SNR) of up to twofold as compared with standard 1.5 T MR scanners; this gain in SNR can be used to improve either speed or spatial resolution, or both. Nevertheless pulse
sequence parameters at 3 T need to be reoptimized from 1.5 T values in order to maintain desired image contrast. Image artefacts due to changes in tissue susceptibility, chemical shift, radiofrequency effects, and/or pulse sequence physics may be
more noticeable and harder to suppress at 3 T [23]. In
partic-ular, DWI sequences can suffer from increased warping and
susceptibility artefacts at 3 T [23]. Previous studies [24] have
shown that when body DWMRI protocols are transferred from 1.5 to 3 T without further modifications, image quality is seriously degraded and images suffer from severe distor-tions and signal losses, so qualitative assessment and quanti-tative analysis can be problematic. Therefore, protocol adjust-ment at 3 T is mandatory because compromised image quality may have serious implications in diagnosis.
Proton MR spectroscopy is a non-invasive diagnostic tool that may contribute to the differential diagnosis of subtypes in ovarian tumours. In addition to the 1.5 T system, the superior spectral separation and increased signal-to-noise ratio offered by 3 T systems allow high quality MR spectroscopy. The various subtypes of malignant epithelial ovarian tumours (se-rous, clear cell, endometrioid, and mucinous) respond differ-ently to chemotherapy. In particular, serous adenocarcinoma may have a good response to chemotherapy, whereas clear cell and mucinous adenocarcinomas may show poor response to chemotherapy. Proton MR spectroscopy may identify the presence of mucinous material containing N-acetyl mucinous compounds, and can provide helpful information in distinguishing mucinous and nonmucinous ovarian tumours. Therefore, MR spectroscopy helps to diagnose the subtypes of ovarian tumours and may contribute to the adequate treatment,
thus improving management of these patients [25].
Compared with 1.5 T, the increased signal-to-noise ratio and improved background suppression at 3 T may allow better categorization of variable components (fluid, blood, lipid, etc.). In addition, in the study of complex adnexal masses, dynamic contrast-enhanced MRI is especially effective for increasing the conspicuity of findings that are predictive of malignancy. Owing to its higher diagnostic performance, 3 T MRIs categorize and characterize the primary adnexal lesions well, and could be regarded as a reliable non-invasive modal-ity method for distinguishing malignancies from benign tu-mours, though histological examination is needed to
deter-mine the final diagnosis [26].
Our MR protocol
The MR imaging protocol we use in our institution to study patients with ovarian masses is as follows.
torso coil with array spatial sensitivity technique (ASSET) parallel acquisition.
MR sequences
– Localizer sequence in the three spatial planes;
– axial T2-weighted single-shot fast spin-echo (SSFSE)
se-quence [time to repetition (TR)/time to echo (TE) range 765/59; flip angle 90°; section thickness 6 mm; interslice gap 0.6 mm; bandwidth 31.25 kHz; field of view (FOV) 38 cm; matrix 320×288; number of averages 0.54; num-ber of images 30; acquisition time 24 s] used as second localiser to identify the longitudinal axis of the uterus in the case of laterally deviated uterus;
– sagittal T2-weighted fast spin-echo (FSE) sequence
par-allel to the longitudinal axis of the uterus (identified on the previous SSFSE sequence) (TR/TE range 4675/100; flip angle 90°; section thickness 4 mm; interslice gap 1 mm; bandwidth 41.67 kHz; FOV 32 cm; matrix 320× 224; number of averages 4; number of images 26; acqui-sition time 3 min 49 s);
– oblique coronal T2-weighted FSE sequence parallel to
the longitudinal axis of the uterus (TR/TE range 4675/100; flip angle 90°; section thickness 4 mm; interslice gap 1 mm; bandwidth 41.67 kHz; FOV 32 cm; matrix 320×224; number of averages 4; number of images 26; acquisition time 3 min 49 s);
– oblique axial T2-weighted FSE sequence perpendicular
to the longitudinal axis of the uterus (TR/TE range 4675/100; flip angle 90°; section thickness 4 mm; interslice gap 1 mm; bandwidth 41.67 kHz; FOV 32 cm; matrix 320×224; number of averages 4; number of images 26; acquisition time 3 min 49 s);
– sagittal or axial oblique or coronal oblique fat suppressed
T2-weighted FSE sequence (TR/TE range 4675/100; flip angle 90°; section thickness 4 mm; interslice gap 1 mm; bandwidth 41.67 kHz; FOV 32 cm; matrix 320×224; number of averages 4; number of images 24; acquisition time 3 min 49 s);
– axial T1-weighted gradient-echo (GRE) sequence in-out
(chemical-shift imaging) (TR/TE 180/2,1; flip angle 80°; section thickness 6 mm; interslice gap 0,6 mm; band-width 62,5 kHz; field of view 38 cm; matrix 256×224; number of averages 1; number of images 20; acquisition time 22 s);
– axial DWI SE EPI (TR/TE 3000/74,1; flip angle 90°;
section thickness 5 mm; interslice gap 1 mm; bandwidth 250 kHz; field of view 45 cm; matrix 160×160; number of averages 16; number of images 14; b-value 0 e 800 s/
mm2; acquisition time 1 min e 40 s);
– sagittal, coronal oblique, axial oblique T1-weighted 3D
gradient-echo liver acquisition with volume acquisition (LAVA) sequence with fat suppression (TRe/TE range 4.4/2.1; flip angle 12°; section thickness 3.4 mm; overlap
locations −1.7 mm; bandwidth 62.5 kHz; FOV 40 cm;
matrix 320×192; number of averages 0.75; number of images 104; acquisition time 22 s).
After i.v. administration of 0.1 mmol/kg paramagnetic con-trast agent (Dotarem, Guerbet, Roissy, France) at a flow rate of 2 ml/s, followed by 20 ml of saline solution at the same flow rate, the following sequences are acquired:
– dynamic sagittal T1-weighted 3D gradient-echo LAVA
with fat suppression (TR/TE range 4.4/2.1; flip angle 12°; section thickness 3.4 mm; overlap locations
−1.7 mm; bandwidth 62.5 kHz; FOV 40 cm; matrix
320×192; number of averages 0.75; number of images 104; acquisition time 22 s) acquired at 60 and 120 s after contrast administration;
– T1-weighted 3D gradient echo LAVA fat-suppressed
se-quence, in the coronal oblique (parallel to the longitudinal axis of the uterus), axial oblique (perpendicular to the longitudinal axis of the uterus) and axial planes (TR/TE range 4.4/2.1; flip angle 12°; section thickness 3.4 mm;
overlap locations −1.7 mm; bandwidth 62.5 kHz; FOV
40 cm; matrix 320×192; number of averages 0.75; num-ber of images 104; acquisition time 22 s).
MR imaging is performed with the patient lying in the supine position (feet first). T2-weighted FSE sequences and DW sequences are acquired with patient breathing freely, T1-weighted 3D gradient echo LAVA fat-suppressed sequence are acquired in breath hold.
In case of voluminous ovarian masses that exceed the FOV of the above-mentioned sequences, we use the following MR protocol.
– Standard three-plane scout image;
– coronal T2-weighted SSFSE with and without fat
sup-pression (TR range/TE range 705/90; flip angle 90°; sec-tion thickness 6 mm; interslice gap 0.6 mm; bandwidth
83.33 kHz; field of view 44–48 cm; matrix 384×224;
number of signals acquired 0.57; number of images 28; acquisition time 24 s);
– axial T2-weighted SSFSE with and without fat
suppres-sion [time to repetition (TR)/time to echo (TE) range 765/ 59; flip angle 90°; section thickness 6 mm; interslice gap 0.6 mm; bandwidth 31.25 kHz; field of view (FOV) 38 cm; matrix 320×288; number of averages 0.54; num-ber of images 30; acquisition time 24 s];
– fast imaging employing steady-state acquisition
(FIESTA) in the coronal, axial and sagittal planes (TR range/TE range 4/1.7; flip angle 75°; section thickness 6 mm; interslice gap 0.6 mm; bandwidth 100 kHz; field
of view 44–48 cm; matrix 320×224; number of signals
– axial DWI SE EPI [TR range/TE range 3000/74; flip angle 90°; section thickness 8 mm; interslice gap 2 mm; field of view 42 cm; matrix 160×160; number of signals acquired 2; number of images 15; b-value 0 and 800 s/
mm2that represent the best compromise between signal
to noise ratio (SNR) and lesion detection sensitivity on our MR system; ASSET 2; acquisition time 27 s];
– sagittal, axial and coronal T1-weighted 3D gradient echo
LAVA fat-suppressed sequence (TR range/TE range 4.1/ 1.9; flip angle 12°; section thickness 3.4 mm; overlap locs
−1.7 mm; bandwidth 62.5 kHz; field of view 44–48 cm;
matrix 320×192; number of signals acquired 0.70; num-ber of images 120; acquisition time 23 s).
After i.v. administration of 0.1 mmol/kg paramagnetic contrast agent (Dotarem, Guerbet, Roissy, France) at a flow rate of 2 ml/s, followed by 20 ml of saline solution at the same flow rate, the following sequences are acquired:
– sagittal T1-weighted 3D gradient echo LAVA
fat-suppressed sequence (TR range/TE range 4.1/1.9; flip angle 12°; section thickness 3.4 mm; overlap locs
−1.7 mm; bandwidth 62.5 kHz; field of view 44–48 cm;
matrix 320×192; number of signals acquired 0.70; num-ber of images 120; acquisition time 23 s) acquired at 60 and 120 s after contrast administration;
– axial T1-weighted 3D gradient echo LAVA
fat-suppressed sequence (TR range/TE range 4.2/2; flip
an-gle 12°; section thickness 3.4 mm; overlap locs−1.7 mm;
bandwidth 62.5 kHz; FOV 40 cm; matrix 320 × 192; number of signals acquired 0.70; number of images 120; acquisition time 23 s);
– coronal T1-weighted 3D gradient echo LAVA
fat-suppressed sequence (TR range/TE range 4.1/1.9; flip angle 12°; section thickness 3.4 mm; overlap locs
−1.7 mm; bandwidth 62.5 kHz; field of view 44–48 cm;
matrix 320×192; number of signals acquired 0.70; num-ber of images 120; acquisition time 23 s).
MR imaging is performed with the patient lying in the supine position (feet first). All sequences are acquired in breath hold.
Imaging findings
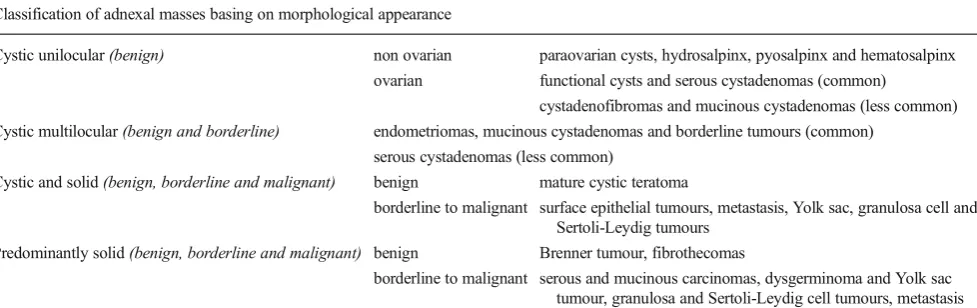
Using an imaging guided approach based on morphological appearance, we classified adnexal masses into four main
groups (Table3):
– unilocular cyst;
– multilocular cyst;
– cystic and solid;
– predominantly solid.
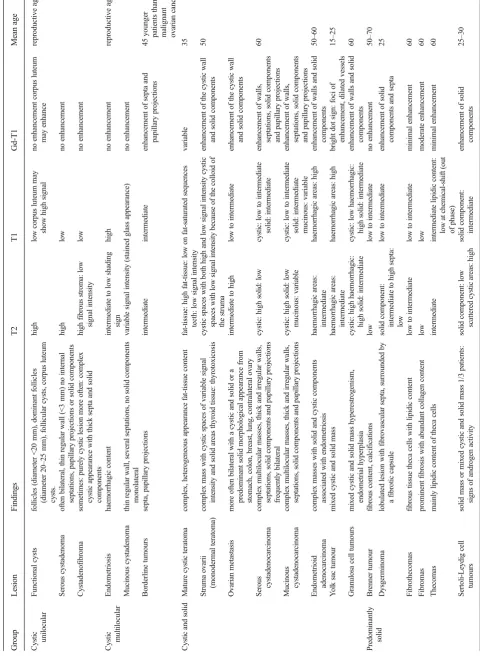
Then we evaluated signal intensity features (e.g., haemorrhagic areas, elevated protein content, fat and collage-nous tissue) and enhancement behaviour for each lesion
(Table4).
Unilocular cystic masses
Unilocular cystic masses in the adnexal region are more likely benign and can have both non-ovarian or ovarian origin. P a r a o va r i a n c y s t s , hy d r o s a l p i n x, p y o s al p i n x a n d hematosalpinx are the most common extraovarian lesions, whereas ovarian lesions are usually represented by functional cysts and serous cystadenomas; less common unilocular ovar-ian cystic masses are cystadenofibromas and mucinous cystadenomas (more often multilocular). Most unilocular cys-tic masses have low signal intensity on T1-weighted images and high signal intensity on T2-weighted images.
Paraovarian cysts(or paratubal cysts or hydatid cysts of Morgagni) arise from mesothelial, paramesonephric or meso-nephric remnants. It is important to identify the ipsilateral ovary as a separate structure in order to avoid
misinterpreta-tion; however, sometimes aBbeak sign^can be found [27].
Hydrosalpinxis a fluid filled fallopian tube; it may assume a cystic appearance on some scans mimicking an ovarian le-sion, but multiplanar visualization is usually able to demon-strate its sausage-like C-shape or S-shape tubular structure. Fallopian tubes can also be distended by pus or blood,
respec-tivelypyosalpinx(high signal intensity on diffusion-weighted
images) and hematosalpinx(high signal intensity on
T1-weighted images) [28].
Functional cystsare the most commonly encountered cys-tic masses in women of reproductive age as a normal part of the menstrual cycle, including follicles (diameter <20 mm),
dominant follicles (diameter 20–25 mm), follicular cysts
(resulting from persistence of an unruptured follicle) and cor-pus luteum cysts (resulting from a failure of the corcor-pus luteum to regress). The latter one may enlarge because of an internal bleeding, showing high signal on T1-weighted images: follow-up is able to differentiate haemorrhagic corpus luteum cysts from endometrioma considering complete resolution of the functional cyst.
Serous cystadenomais a benign tumour that usually pres-ent as an unilocular cyst with a thin regular wall (less than 3 mm); the lining is flat without internal septations, papillary projections or solid components, showing no significative contrast enhancement. Serous fluid shows low signal intensity on T1-weighted and high signal intensity on T2-weighted
im-ages (Fig.1). They are usually smaller and more often bilateral
borderline malignancy may show some small papillary projections.
Cystadenofibroma is an uncommon benign epithelial ovarian tumour containing both epithelial and fibrous stromal components. This tumour may present as a purely cystic lesion, almost indistinguishable at MRI from a cystadenoma, although it more often shows a complex cystic appearance with thick septa and solid components. Foci of fibrous stroma have low signal intensity on
T2-weighted images (Figs.2 and3) [29–31].
Multilocular cystic masses
Multilocular cystic adnexal masses can be both benign or borderline and are represented by endometriomas, mucinous cystadenomas and tumours of borderline malignancy. Serous cystadenomas may rarely be multilocular.
Endometriosisis characterized by ectopic implantation of endometrial tissue outside the uterus, often involving the ova-ries. Endometriotic cysts (or endometriomas or chocolate cysts) are often multifocal and bilateral, and usually appear as cystic to complex adnexal masses with high signal intensity on T1-weighted and intermediate to low signal intensity on T2-weighted images. Fat saturated T1-weighted sequences are helpful to rule out a fat-containing lesion and to confirm the presence of blood. On T2-weighted sequences, a gradual loss
of signal intensity is calledBshading sign^and is caused by
repeated bleeding within the cyst. It has to be remembered that patients with endometriosis are at risk for developing ovarian
malignancy (estimated risk about 2.5 %) [32]. Both
endometrioid and clear cell tumours may be associated with endometriosis.
Mucinous cystadenomais a benign mucin-containing tu-mour, often larger than serous cystadenoma and monolateral rather than bilateral. It usually appears as a multilocular cystic lesion with a thin regular wall and several septations, lacking solid components and showing no significant enhancement
after contrast administration (Fig.4). The cystic loculi may
have variable signal intensity on both T1-weighted and
T2-weighted images, namelyBstained glass appearance^, based
on different mucin concentrations. It has to be remembered that pseudomyxoma peritonei can result from rupture of a mucinous cystadenoma.
Borderline tumoursare a group of ovarian neoplasms
his-tologically characterized by epithelial anaplasia [33].
Com-pared to malignant ovarian cancer, they occur in younger pa-tients. Serous and mucinous cystadenoma account for most borderline tumours; however, other histological types, such as endometrioid and clear cell tumours, are sometimes seen. These tumours usually show non-invasive behaviour, but it is also possible for them to present with lymph node involve-ment and peritoneal implants; however, they are associated with a better prognosis than cystoadenocarcinomas. The mor-phological appearance of borderline tumours is between be-nign and malignant ones. Borderline serous cystadenoma usu-ally manifest as a complex cystic lesion with some septa and
papillary projections (Fig.5). Both benign and borderline
mu-cinous cystadenomas have a multilocular appearance, and it is
impossible to make a differential diagnosis at MRI (Fig.6).
Cystic and solid masses
A mixed cystic and solid appearance of an ovarian mass should raise a suspicion of malignancy, like surface epithelial tumours and metastasic lesions. However, a benign lesion like mature cystic teratoma (or ovarian dermoid cyst) also appears as a complex mass. A germ cell tumour (Yolk sac tumour) and sex cord-stromal tumours (granulosa cell) are also described in this section.
Mature cystic teratomais the most common ovarian neo-plasm and affects mostly young patients. It is a benign germ cell tumour consisting of at least two of the three embryogenic germ cell layers, and usually contains ectodermal (skin, brain), mesodermal (fat, bone) and/or endodermal (thyroid tissue,
Table 3 Classification of adnexal masses based on morphological appearance
Classification of adnexal masses basing on morphological appearance
Cystic unilocular(benign) non ovarian paraovarian cysts, hydrosalpinx, pyosalpinx and hematosalpinx ovarian functional cysts and serous cystadenomas (common)
cystadenofibromas and mucinous cystadenomas (less common) Cystic multilocular(benign and borderline) endometriomas, mucinous cystadenomas and borderline tumours (common)
serous cystadenomas (less common)
Cystic and solid(benign, borderline and malignant) benign mature cystic teratoma
borderline to malignant surface epithelial tumours, metastasis, Yolk sac, granulosa cell and Sertoli-Leydig tumours
Predominantly solid(benign, borderline and malignant) benign Brenner tumour, fibrothecomas
gastrointestinal and bronchial epithelium) mature tissue [34]. Simultaneous presence of these components leads to a com-plex and heterogeneous appearance; however, the key to a correct diagnosis is detection of fat-tissue within the mass. MRI usually demonstrates tissue with high signal intensity both on T1-weighted and T2-weighted images and signal loss
on fat suppression sequences (Fig.7). A T1-weighted
fat-sat-urated sequence is also able to make differential diagnosis between fat-tissue and haemorrhagic lesions, namely endome-trial cysts. A fat-fluid interface may also be found, and is typical of mature cystic teratoma. Other features are areas of low signal intensity (teeth), soft-tissue protuberances
(Rokitansky nodules) and floating debris [35]. Malignant
transformation of mature cystic teratomas is rare (1–2 % of
cases), and usually occurs in postmenopausal women due to a squamous cell carcinoma arising from the cyst wall. In addi-tion, it has to be known that there are other less common types of ovarian teratomas, such as the malignant immature terato-ma, which may have less cystic elements or be completely solid, and the benign monodermal teratoma, in which one of
the three germ cell layers is predominant.Struma ovariiis one
of the main subtypes of ovarian monodermal teratomas
(approximately 3 % of all mature teratomas). It is mainly composed of thyroid tissue; thus, it may be associated with symptoms or signs of thyrotoxicosis. MRI demonstrates a complex mass with multiple cystic and solid areas. Cystic spaces may show variable signal intensity demonstrating both high and low signal intensity on T1-weighted and T2-weighted images; in particular, some cystic spaces demon-strate low signal intensity on both T1-weighted and T2-weighted images because of the colloid of the struma
(Fig.8) [36,37]. No fat-tissue can be found in this lesion.
Ovarian metastasisaccount for about 5 % of malignant ovarian tumours, and there is a potential risk of misjudgment if the primary tumour is not known. Stomach, colon, breast, lung and contralateral ovary are the most frequent neoplasms to metastasize to the ovaries. These tumours can spread to the ovaries by direct invasion, transcoelomic dissemination, hematogeneous and lymphatic spread. Krukenberg tumours are defined as metastatic lesions to the ovary from a gastroin-testinal cancer and characterized by mucin-producing
signet-ring cells (Fig.9). Ovarian metastasis are more often bilateral
with a cystic and solid or a predominant solid morphological appearance. An important enhancement of the cystic wall and
Fig. 1 Serous cystadenoma in a 64-year-old woman. (a) Sagittal and (b) axial T2-weighted images show a hyperintense unilocular cystic mass (white arrows). On (c) sagittal and (d) axial contrast-enhanced fat-suppressed T1-weighted images, the cyst wall shows poor contrast enhancement (white arrows) without
of the solid component is usually seen after gadolinium ad-ministration. It is very difficult to distinguish between primary and secondary ovarian malignancy on diagnostic imaging, mostly because of the absence of typical features helping the
differential diagnosis [38].
Surface epithelial-stromal tumoursaccount for 65 % of all ovarian tumours and represent 85 % of ovarian malignancies. In this section, we describe serous cystadenocarcinoma, mu-cinous cystadenocarcinoma, endometrioid tumours and clear cell tumours, whereas transitional cell (Brenner) tumours will
Fig. 2 Cystadenofibroma in a 54-year-old woman. (a) Axial and (b) coronal T2-weighted images show a predominantly cystic mass with small areas of fibrous stroma along the wall characterized by homogeneous low signal intensity (white arrows). (c) Axial and (d) coronal contrast-enhanced fat-suppressed T1-weighted images show minimum enhancement of the cystic wall and of the fibrous component (white arrows)
Fig. 3 Cystadenofibroma in a 29-year-old woman. (a) Axial and (b) coronal T2-weighted images show a predominantly solid mass with prevalence of the fibrous stroma characterized by homogeneous low signal intensity (white arrows). (c) Axial and (d) coronal
Fig. 4 Mucinous cystadenoma in a 44-year-old woman. (a) Axial, (b) coronal and (c) sagittal T2-weighted images show a voluminous multilocular cystic mass with several septations. (d) Axial and (e) coronal contrast-enhanced fat-suppressed T1-weighted images demonstrate poor
enhancement of the tumour wall and septa. (f) Photomicrograph (H&E X400) shows cystic spaces lined by columnar cells of intestinal type with mucinous secretion
Fig. 5 Borderline papillary-cystic serous tumour in a 43-year-old woman. (a) Axial and (b) coronal T2-weighted images show a cystic mass with papillary projections arising from the medial wall (white arrows). (c) Axial and (d) coronal contrast-enhanced fat-suppressed
be described in the next one because of their predominantly solid appearance.
Serous cystadenocarcinomais the most common, and is responsible for about 40 % of malignant ovarian neoplasms,
whereasmucinous cystadenocarcinomais less common and
accounts for about 10 % of ovarian malignancies. These
tumours are seen as complex multilocular masses, usually with thick and irregular walls, septations, solid components and papillary projections of low signal intensity on T2-weighted images with contrast enhancement after gadolinium
administration (Figs.10and11). The serous fluid of the cystic
components has low to intermediate signal intensity on
T1-Fig. 6 Borderline mucinous ovarian tumour in a 49-year-old woman. (a) Axial T2-weighted and (b) coronal fat-suppressed T2-weighted images show a multiloculated cystic ovarian tumour with intermediate (*) to high (white arrowheads) signal intensity of the loculi and solid parietal component (white arrows). (c) Axial contrast-enhanced fat-suppressed T1-weighted image demonstrates enhancement of the wall and of the solid component (black arrow). (d) Photomicrograph (H&E X300) shows neoplastic glands lined by columnar cells of intestinal-type with mucinous secretion
Fig. 8 Struma ovarii in a 32-year-old woman. (a) Axial T2-weighted, (b) coronal T2-weighted and (c) axial fat-suppressed T1-weighted images show a predominantly solid mass (white arrows) with multiple cystic spaces of variable signal intensity, some of which show high signal intensity on T1-weighted image (white arrowhead). (d) Axial contrast-enhanced fat-suppressed T1-weighted image demonstrates enhancement of the mass (white arrow)
Fig. 9 Krukenberg tumour from gastric carcinoma in a 23-year-old woman. (a) Sagittal, (b) axial and (c) coronal T2-weighted images show a heterogeneous mass characterized by solid components with low signal intensity (white arrows) and cystic components with high signal intensity (white arrowheads). (d) Sagittal contrast-enhanced fat-suppressed
weighted and high signal intensity on T2-weighted images. In some cases of serous cystadenocarcinoma there are psammomatos calcifications, better seen on CT scan because of their high attenuation. Signal intensity of mucinous content is variable depending on mucin concentration. These tumours
can be very large, even greater than 12–15 cm. Serous
cystadenocarcinoma is more frequently bilateral than mucin-ous cystadenocarcinoma. They may be responsible for
perito-neal invasion leading to peritoperito-neal carcinomatosis (Fig.12).
Endometrioid and clear cell tumoursare commonly asso-ciated with endometriosis. These tumours usually appear as complex masses with solid and cystic components, although
they can also be predominantly cystic (Figs.13and14) [39].
However, the rapid growth of an endometrioma, along with multilocularity and presence of mural nodules within the haemorrhagic cyst with enhancement after gadolinium
admin-istration should raise the suspicion of malignancy [32,40].
Yolk sac tumour, also known as endodermal sinus tu-mour, is relatively rare and is responsible for about 1 % of ovarian malignancies. This tumour generally presents in the second or third decade as a large mixed cystic and solid mass with the bright dot sign, namely foci of en-hancement due to dilated vessels (small aneurisms) as a
result of increased vascularity [41]. It is not uncommon to
find haemorrhagic areas with high signal intensity on
T1-weighted images (Fig.15).
Fig. 10 Serous papillary carcinoma in a 48-year-old woman. (a) Axial, (b) sagittal and (c) coronal T2-weighted image show a cystic and solid mass (white arrows). (d) Axial contrast-enhanced fat-suppressed T1-weighted image shows the enhancing exophytic papillary projections of the tumour (white arrow). (e) Axial DW image (b= 800 s/mm2) demonstrates increased signal of the lesion (white arrow), indicating hypercellularity
Fig. 11 Mucinous
cystadenocarcinoma in a 57-year-old woman.(a)Axial,(b)coronal and(c)sagittal T2-weighted images show a large mass with mixed solid and multilocular cystic appearance with low signal intensity of the solid component and variable signal intensity within the locules (Bstained glass appearance^).(d)Axial,(e)
Granulosa cell tumours are usually benign; however, they may be malignant as well. Clinically, they can man-ifest by producing hormones with hyperestrogenism. Granulosa cell tumours can be divided into two main subtypes, adult and juvenile. The adult type is responsi-ble for about 95 % of cases and occurs preferentially in perimenopausal and postmenopausal women, resulting in endometrial hyperplasia and atypical bleeding. The juve-nile type is less frequent and affects prepuberal children, leading to pseudoprecocity. Granulosa cell tumours ap-pear mostly as both cystic and solid masses, but they can also have a multilocular cystic or a predominantly
solid appearance [42, 43].
Predominantly solid masses
Predominantly solid adnexal masses account for lesions with benign, borderline and malignant behaviour. They include
tu-mours of different origin: epithelial (transitional cell–Brenner
tumour and, rarely, serous and mucinous carcinomas), germ cell (dysgerminoma and Yolk sac tumour), sex cord (fibrothecomas, granulosa cell tumours and Sertoli-Leydig cell tumours) and metastatic lesions.
Brenner tumouris responsible for about 2 % of ovarian
neoplasms; it is also namedBtransitional cell tumour^
be-cause of its histological similarity to the urotelium. It is more often benign. On T2-weighted images, Brenner
Fig. 12 Peritoneal carcinomatosis due to disseminated ovarian papillary serous cystadenocarcinoma in a 63-year-old woman. (a) Axial T2-weighted, (b) coronal T2-weighted, (c) axial T1-weighted, (d) coronal T1-weighted images show multiple tumour implants in the left paracolic gutter (white arrows) and omental implants (white arrowheadsina,c). (e) Photomicrograph (H&E X200) shows solid and papillary structures invading omental adipose tissue
Fig. 13 Endometrioid
tumour shows a low signal intensity because of its solid fibrous content. In some cases, areas of calcification with-in the solid components can be found, best demonstrated on both US and CT, rather than MRI. Brenner tumour can be associated with other cystic tumours, like mucinous cystadenomas, so that MRI demonstrates a lesion with both cystic (cystadenomas) and solid (Brenner)
compo-nents [44]. Although rarely, both borderline and malignant
lesions (transitional cell carcinomas) exist with complex cystic and solid appearances.
Dysgerminomausually appears as a solid lobulated lesion with fibrovascular septa, surrounded by a fibrotic capsule. The solid component shows intermediate to high signal intensity on T2-weighted images, whereas the septa appear at low sig-nal intensity, but show a significant contrast enhancement
[41].
Fibromas, thecomas and fibrothecomasare classified as sex cord-stromal tumours and are the most common benign solid lesion of the ovaries. These tumours are usually asymp-tomatic and there may be an association with ascites and
Fig. 14 Endometrioid
adenocarcinoma in a 60-year-old woman. (a) Coronal and (b) sagittal T2-weighted images show a predominantly cystic mass with solid component arising from the inferior wall (white arrowheads). (c) Axial fat-suppressed T1-weighted image shows hyperintense haemorrhagic content of the cyst (*) and solid parietal component (white arrowhead). (d) Axial DW image (b=800 s/mm2) demonstrates increased signal of the solid component of the lesion (white arrowhead) indicating hypercellularity. (e)
Photomicrograph (H&E X300) shows neoplastic glands cystically dilated
pleural effusion (Meig syndrome).Fibrothecomasconsist of both fibrous tissue and theca cells with lipidic content. They present as a well-circumscribed solid mass with low to inter-mediate signal intensity on T1-weighted and low signal inten-sity on T2-weighted images, although there may be some scattered areas of cystic degeneration with high signal
inten-sity on T2-weighted scans (Fig.16). Infibromas, the
promi-nent fibrosis with abundant collagen content is responsible for
the low signal intensity (Fig.17), while inthecomas, the
main-ly lipidic content of theca cells may be depicted at
chemical-shift imaging [7]. After contrast administration, only a
mini-mal enhancement can be demonstrated. Differential diagnosis of fibrothecomas includes pedunculated uterine leiomyomas; however, the multiplanar imaging along with the absence of the normal ipsilateral ovary are useful in distinguishing them. Sclerosing stromal tumouris classified as sex cord-stromal tumours into the thecoma-fibroma group. It affects mostly young women, manifesting as menstrual irregularities. This tumour presents as predominantly solid mass; after contrast administration, it shows an early peripheral enhancement with
centripetal progression [43,45,46].
Sertoli-Leydig cell tumoursaccount for only 0.5 % of ovar-ian tumours; however, they can be responsible for hyperandrogenism and are the most common virilizing tu-mours. These tumours usually affect young women and signs of androgen activity can be seen in about one-third of patients.
Sertoli-Leydig cell tumours usually appear as solid masses; however, they may also present as heterogeneous lobulated
lesions with both cystic and solid components [41,47]. On
T2-weighted images, most of these tumours show a predom-inantly low signal intensity of the solid components, relating to the fibrous stroma, with some scattered cystic areas of high
signal intensity (Fig.18) [46,48].
Conclusion
Morphological characteristics of adnexal masses range from cystic (both unilocular and multilocular), complex (cystic and solid) and predominantly solid. It is true that there is a certain overlap between benign and malignant tumours; in particular, it has to be considered that borderline lesions are very difficult to differentiate because they have both benign and malignant features.
In 2007, Sohaib et al. showed that from the analysis of the
MR imaging features,Bthe most predictive characteristics of
malignancy are vegetations in a cystic lesion, presence of ascites, a maximal diameter greater than 6 cm, and necrosis
in a solid lesion^ [33]. In 2011, Valentini et al. suggested
criteria for characterization of benign and suspicious adnexal lesions, indicating as features suggestive of malignancy the
demonstration of Bsolid, solid/cystic enhancing masses
Fig. 16 Fibrothecoma in a 66-year-old woman. (a) Axial and (b) sagittal T2-weighted images show a heterogeneous solid mass (white arrows) with low to intermediate signal intensity. Some areas of cystic degeneration with high signal intensity can be seen within the lesion (white arrowheads). (c) Axial T1-weighted image confirms the solid appearance of the lesion (white arrow). (d)
(greater than 4 cm in maximum diameter) with papillary pro-jections and irregular thick wall and septa (greater than 3 mm)
into a cystic lesion^ as well as aBheterogeneous and early
enhancement pattern^[35].
To conclude this work, we’d like to indicate some key
imaging features and general advice that could be of help in the differential diagnosis of adnexal masses:
– non-neoplastic lesions should always be taken into
consideration;
– in a patient with endometriosis, the presence of a complex
and rapidly growing mass with contrast enhancement should raise the suspicion of endometrioid or clear cell tumour;
– a very low signal intensity on T2-weighted images
indi-cates a fibrotic component, suggesting a tumour of the thecoma/fibroma group, a cystadenofibroma or a Brenner tumour;
– sequences with fat saturation are helpful when facing a
mass with high signal intensity on T1-weighted images, because the signal suppression is suggestive of a
Fig. 17 Fibroma in a 44-year-old woman. (a) Axial, (b) coronal and (c) sagittal T2-weighted images show a polilobulated solid mass (white arrows) with
homogeneous low signal intensity. (d) Axial and (e) coronal contrast-enhanced fat-suppressed T1-weighted images show the homogeneous enhancement of the lesion (white arrows). (f) Photomicrograph (H&E X20) shows closely packed spindle stromal cells arranged in storiform pattern with hyaline bands
Fig. 18 Sertoli-Leydig cell tumour in a 13-year-old woman. (a) Sagittal and (b) axial T2-weighted images show a voluminous mixed cystic and solid mass (white arrows). At the periphery of the mass, some signal flow-voids that represent vascular structures are recognizable (white arrowheads). (c) An Axial T1-weighted image shows haemorrhagic areas with high signal intensity within the lesion (white arrow). (d) Axial
teratoma; otherwise, an endometrial cysts or other haemorrhagic lesions should be considered;
– aBstained glass appearance^with cystic loculi of variable
signal intensity usually refers to a mucinous tumour, be-cause of the different mucin concentration;
– metastasis should be considered if a complex enhancing
mass is demonstrated in both ovaries (eventually looking for an unknown primary tumour); however, it must be remembered that serous epithelial tumours can be bilater-al as well.
Open AccessThis article is distributed under the terms of the Creative C o m m o n s A t t r i b u t i o n 4 . 0 I n t e r n a t i o n a l L i c e n s e ( h t t p : / / creativecommons.org/licenses/by/4.0/), which permits unrestricted use, distribution, and reproduction in any medium, provided you give appro-priate credit to the original author(s) and the source, provide a link to the Creative Commons license, and indicate if changes were made.
References
1. Ferlay J, Soerjomataram I, Ervik M, Dikshit R, Eser S, Mathers C, Rebelo M, Parkin DM, Forman D, Bray F (2013) GLOBOCAN 2012 v1.0, Cancer Incidence and Mortality Worldwide: IARC Cancer Base No. 11. Lyon, France: International Agency for Research on Cancer. Available viahttp://globocan.iarc.fr, accessed on 01/03/2015
2. Holschneider CH, Berek JS (2000) Ovarian cancer: epidemiology, biology, and prognostic factors. Semin Surg Oncol 19(1):3–10 3. World Health Organization Classification of Tumours (2003)
Pathology and genetics of tumours of the breast and female genital organs. IARC
4. Son H, Khan SM, Rahaman J, Cameron KL, Prasad-Hayes M, Chuang L et al (2011) Role of FDG PET/CT in staging of recurrent ovarian cancer. Radiographics 31(2):569–83. doi:10.1148/rg. 312105713
5. Holcomb K, Vucetic Z, Miller MC, Knapp RC (2011) Human epididymis protein 4 offers superior specificity in the differentiation of benign and malignant adnexal masses in premenopausal women. Am J Obstet Gynecol 205(4):358.e1–6. doi:10.1016/j.ajog.2011. 05.017
6. Bandiera E, Romani C, Specchia C, Zanotti L, Galli C, Ruggeri G et al (2011) Serum human epididymis protein 4 and risk for ovarian malignancy algorithm as new diagnostic and prognostic tools for epithelial ovarian cancer management. Cancer Epidemiol Biomarkers Prev 20(12):2496–506. doi:10.1158/1055-9965.EPI-11-0635
7. Jeong YY, Outwater EK, Kang HK (2000) Imaging evaluation of ovarian masses. Radiographics 20(5):1445–70
8. Iyer VR, Lee SI (2010) MRI, CT, and PET/CT for ovarian cancer detection and adnexal lesion characterization. AJR Am J Roentgenol 194(2):311–21. doi:10.2214/AJR.09.3522
9. Wu Y, Peng H, Zhao X (2015) Diagnostic performance of contrast-enhanced ultrasound for ovarian cancer: a meta-analysis. Ultrasound Med Biol 41(4):967–74. doi:10.1016/j.ultrasmedbio. 2014.11.018
10. Levine D, Brown DL, Andreotti RF, Benacerraf B, Benson CB, Brewster WR et al (2010) Society of Radiologists in Ultrasound. Management of asymptomatic ovarian and other adnexal cysts im-aged at US Society of Radiologists in Ultrasound consensus
conference statement. Ultrasound Q 26(3):121–31. doi:10.1097/ RUQ.0b013e3181f09099
11. Lalwani N, Prasad SR, Vikram R, Shanbhogue AK, Huettner PC, Fasih N (2011) Histologic, molecular, and cytogenetic features of ovarian cancers: implications for diagnosis and treatment. Radiographics 31(3):625–46. doi:10.1148/rg.313105066
12. Prakash P, Cronin CG, Blake MA (2010) Role of PET/CT in ovar-ian cancer. AJR Am J Roentgenol 194(6):W464–70. doi:10.2214/ AJR.09.3843
13. Chilla B, Hauser N, Singer G, Trippel M, Froehlich JM, Kubik-Huch RA (2011) Indeterminate adnexal masses at ultrasound: effect of MRI imaging findings on diagnostic thinking and therapeutic decisions. Eur Radiol 21(6):1301–10. doi:10.1007/s00330-010-2018-x
14. Togashi K (2003) Ovarian cancer: the clinical role of US, CT, and MRI. Eur Radiol 13(Suppl 4):L87–104
15. Fujii S, Kakite S, Nishihara K, Kanasaki Y, Harada T, Kigawa J et al (2008) Diagnostic accuracy of diffusion-weighted imaging in dif-ferentiating benign from malignant ovarian lesions. J Magn Reson Imaging 28(5):1149–56. doi:10.1002/jmri.21575
16. Katayama M, Masui T, Kobayashi S, Ito T, Sakahara H, Nozaki A et al (2002) Diffusion-weighted echo planar imaging of ovarian tumors: is it useful to measure apparent diffusion coefficients? J Comput Assist Tomogr 26(2):250–6
17. Thomassin-Naggara I, Daraï E, Cuenod CA, Fournier L, Toussaint I, Marsault C et al (2009) Contribution of diffusion-weighted MR imaging for predicting benignity of complex adnexal masses. Eur Radiol 19(6):1544–52. doi:10.1007/s00330-009-1299-4
18. Bakir B, Bakan S, Tunaci M, Bakir VL, Iyibozkurt AC, Berkman S et al (2011) Diffusion-weighted imaging of solid or predominantly solid gynaecological adnexial masses: is it useful in the differential diagnosis? Br J Radiol 84(1003):600–11. doi:10.1259/bjr/ 90706205
19. Zhang P, Cui Y, Li W, Ren G, Chu C, Wu X (2012) Diagnostic accuracy of diffusion-weighted imaging with conventional MR im-aging for differentiating complex solid and cystic ovarian tumors at 1.5T. World J Surg Oncol 10:237. doi:10.1186/1477-7819-10-237 20. Mohaghegh P, Rockall AG (2012) Imaging strategy for early
ovar-ian cancer: characterization of adnexal masses with conventional and advanced imaging techniques. Radiographics 32(6):1751–73. doi:10.1148/rg.326125520
21. Kyriazi S, Collins DJ, Morgan VA, Giles SL, de Souza NM (2010) Diffusion-weighted imaging of peritoneal disease for non invasive staging of advanced ovarian cancer. Radiographics 30(5):1269–85. doi:10.1148/rg.305105073
22. Zhao SH, Qiang JW, Zhang GF, Ma FH, Cai SQ, Li HM et al (2014) Diffusion-weighted MR imaging for differentiating borderline from malignant epithelial tumours of the ovary: pathological correlation. Eur Radiol 24(9):2292–9. doi:10.1007/s00330-014-3236-4 23. Soher BJ, Dale BM, Merkle EM (2007) A review of MR physics:
3T versus 1.5T. Magn Reson Imaging Clin N Am 15(3):277–90 24. Lavdas I, Miquel ME, McRobbie DW, Aboagye EO (2014)
Comparison between diffusion-weighted MRI (DW-MRI) at 1.5 and 3 tesla: a phantom study. J Magn Reson Imaging 40(3):682–90 25. Takeuchi M, Matsuzaki K, Harada M (2011) Preliminary observa-tions and clinical value of N-acetyl resonances in ovarian tumours using in-vivo proton MR spectroscopy at 3T. Eur Radiol 21(12): 2640–6
26. Zhang H, Zhang GF, He ZY, Li ZY, Zhang GX (2014) Prospective evaluation of 3T MRI findings for primary adnexal lesions and comparison with the final histological diagnosis. Arch Gynecol Obstet 289(2):357–64
28. Kim MY, Rha SE, Oh SN, Jung SE, Lee YJ, Kim YS et al (2009) MR Imaging findings of hydrosalpinx: a comprehensive review. Radiographics 29(2):495–507. doi:10.1148/rg.292085070 29. Wasnik AP, Menias CO, Platt JF, Lalchandani UR, Bedi DG,
Elsayes KM (2013) Multimodality imaging of ovarian cystic le-sions: review with an imaging based algorithmic approach. World J Radiol 28;5(3):113–25. doi:10.4329/wjr.v5.i3.113
30. Cho SM, Byun JY, Rha SE, Jung SE, Park GS, Kim BK et al (2004) CT and MRI findings of cystadenofibromas of the ovary. Eur Radiol 14(5):798–804
31. Tang YZ, Liyanage S, Narayanan P, Sahdev A, Sohaib A, Singh N et al (2013) The MRI features of histologically proven ovarian cystadenofibromas-an assessment of the morphological and en-hancement patterns. Eur Radiol 23(1):48–56. doi:10.1007/s00330-012-2568-1
32. Siegelman ES, Oliver ER (2012) MR imaging of endometriosis: ten imaging pearls. Radiographics 32(6):1675–91. doi:10.1148/rg. 326125518
33. Sohaib SA, Reznek RH (2007) MR imaging in ovarian cancer. Cancer Imaging 1(7 Spec No A):S119–29
34. Outwater EK, Siegelman ES, Hunt JL (2001) Ovarian teratomas: tumor types and imaging characteristics. Radiographics 21(2):475–90 35. Valentini AL, Gui B, Miccò M, Mingote MC, De Gaetano AM, Ninivaggi Vet al (2012) Benign and suspicious ovarian masses-MR imaging criteria for characterization: pictorial review. J Oncol 2012: 481806. doi:10.1155/2012/481806
36. Park SB, Kim JK, Kim KR, Cho KS (2008) Imaging findings of complications and unusual manifestations of ovarian teratomas. Radiographics 28(4):969–83. doi:10.1148/rg.284075069 37. Dujardin MI, Sekhri P, Turnbull LW (2014) Struma ovarii: role of
imaging? Insights Imaging 5(1):41–51. doi:10.1007/s13244-013-0303-3
38. Brown DL, Zou KH, Tempany CM, Frates MC, Silverman SG, McNeil BJ et al (2001) Primary versus secondary ovarian malig-nancy: imaging findings of adnexal masses in the Radiology Diagnostic Oncology Group Study. Radiology 219(1):213–8
39. Matsuoka Y, Ohtomo K, Araki T, Kojima K, Yoshikawa W, Fuwa S (2001) MR imaging of clear cell carcinoma of the ovary. Eur Radiol 11(6):946–51
40. Tsili AC, Argyropoulou MI, Koliopoulos G, Paraskevaidis E, Tsampoulas K (2011) Malignant transformation of an endometriotic cyst: MDCT and MR findings. J Radiol Case Rep 5(1):9–17. doi:10.3941/jrcr.v5i1.435
41. Shaaban AM, Rezvani M, Elsayes KM, Baskin H Jr, Mourad A, Foster BR et al (2014) Ovarian malignant germ cell tumors: cellular classification and clinical and imaging features. Radiographics 34(3):777–801. doi:10.1148/rg.343130067
42. Jung SE, Rha SE, Lee JM, Park SY, Oh SN, Cho KS et al (2005) CT and MRI findings of sex cord-stromal tumor of the ovary. AJR Am J Roentgenol 185(1):207–15
43. Tanaka YO, Tsunoda H, Kitagawa Y, Ueno T, Yoshikawa H, Saida Y (2004) Functioning ovarian tumors: direct and indi-rect findings at MR imaging. Radiographics 24(Suppl 1): S147–66
44. Imaoka I, Wada A, Kaji Y, Hayashi T, Hayashi M, Matsuo M et al (2006) Developing an MR imaging strategy for diagnosis of ovar-ian masses. Radiographics 26(5):1431–48
45. Matsubayashi R, Matsuo Y, Doi J, Kudo S, Matsuguchi K, Sugimori H (1999) Sclerosing stromal tumor of the ovary: radio-logic findings. Eur Radiol 9(7):1335–8
46. Jung SE, Lee JM, Rha SE, Byun JY, Jung JI, Hahn ST (2002) CT and MR imaging of ovarian tumors with emphasis on differential diagnosis. Radiographics 22(6):1305–25
47. Cai SQ, Zhao SH, Qiang JW, Zhang GF, Wang XZ, Wang L (2013) Ovarian Sertoli-Leydig cell tumors: MRI findings and pathological correlation. J Ovarian Res 26;6(1):73. doi:10. 1186/1757-2215-6-73