Research Article
July
2017
Computer Science and Software Engineering
ISSN: 2277-128X (Volume-7, Issue-7)
RBF Neural Network (RBFNN) using Density Based
Clustering for Liver Disorder Dataset
Sunila Godara
Asst. Professor, Department of CSE, GJUST, Hisar, Haryana, India
Rishipal Singh
Professor, Department of CSE, GJUST, Hisar, Haryana, India
Sanjeev Kumar
Asst. Professor, Department of CSE, GJUST, Hisar, Haryana, India
DOI: 10.23956/ijarcsse/V7I6/0345
Abstract-Clustering is an unsupervised classification that is the partitioning of a data set in a set of meaningful subsets. Each object in dataset shares some common property- often proximity according to some defined distance measure. In this paper we will extend our previous work [15]. Simple K-means and Proposed makeDensityBased Clustering (MDBC) are embedded in RBF Neural Network (RBFNN). We evaluated the performance of RBFNN using K-Means and Proposed makeDensityBased Clustering on Liver Disorder Dataset. Proposed algorithm is superior to the existing makeDensityBased Clustering algorithm [15], but it is not capable of performing well when it is embedded with RBFNN.
Keywords—classification, clustering, k-means clustering, density based clustering, RBFNN.
I. INTRODUCTION
Clustering is a type of categorization inflicted rules on a group of objects. A broad definition of clustering could be “the process of categorizing a finite number of objects into groups where all members in the group are similar in some manner”. As a result, a cluster is an aggregation of objects. All objects in the same cluster have common properties (e.g. distance) which are different to the objects lying in other clusters [1, 11].
Cluster analysis of data is an important task in knowledge discovery and data mining. Cluster analysis aims to group data on the basis of similarities and dissimilarities among the data elements. The process can be performed in a supervised, semi-supervised or unsupervised manner. Different algorithms have been proposed which take into account the nature of the data and the input parameters in order to cluster the data. Data vectors are clustered around centroid vectors. The cluster the data vector belongs to is determined by its distance to the centroid vector. Depending on the nature of the algorithm, the numbers of centroid are either defined in advance by the user or automatically determined by the algorithm. Finding the optimum number of clusters or natural groups in the data is not a trivial task. The popular clustering approaches suggested so far are either partition based or hierarchy based, but both approaches have their own advantages and limitations in terms of the number of clusters, shape of clusters, and cluster overlapping [1]. Clustering is widely used to give input to RBFNN by finding center of clusters. Here in this paper we will comparethe performance of RBFNN using K-Means and Proposed makeDensityBased Clustering on Liver Disorder Dataset
II. K-MEANS CLUSTERING
The k-means algorithm is most well known partitioning method for clustering. K-means clustering method grouped data based on their closeness to each other according to Euclidean distance ad works well for data set of non varying densities as shown in Figure 1[16].
ISSN(E): 2277-128X, ISSN(P): 2277-6451, DOI: 10.23956/ijarcsse/V7I6/0345, pp. 20-24
In this clustering approach user decide that how many clusters should be and on the basis of closeness of data vector to the centroid which is mean of the data vector of cluster is assigned to those clusters which show minimum distance. The steps are [11, 13]:
Calculate the mean value of each cluster, and use this mean value to represent the cluster.
Re-distribute the objects to the closest cluster according to its distance to the cluster center and the distance is calculated using Euclidean distance method which is
Where n is the number of variables, and Xi and Yi are the values of the ith variable, at points X and Y
respectively.
Update the mean value of the cluster, say, calculate the mean value of the objects in each cluster;
Calculate the criterion function E, until the criterion function converges.
Usually, the K-mean algorithm criterion function adopts square error criterion, defined as:
Here, E is total square error of all the objects in the data cluster, p is given data object, mi is mean value of cluster Ci (p
and m are both multi-dimensional). The function of this criterion is to make the generated cluster be as compacted and independent as possible [15].
III. PROPOSED MAKEDENSITYBASED (MDBC) CLUSTERING
Proposed makeDensityBased Clustering works well for data sets as shown in Figure 2[16] and can make cluster of different shapes.
Figure2: Proposed make Density Based Clustering.
The modification took place in two parts [15]:
Part 1:
K-means clustering method groups data based on their closeness to each other using weighted Euclidean distance [7] instead of Euclidean distance. The rest of the process is same. Now the steps are
Calculate the mean value of each cluster, and use this mean value to represent the cluster;
Re-distribute the objects to the closest cluster according to its distance to the cluster center and the distance is calculated using Euclidean distance method which is
Where var is the variance of total instances and, n is the number of variables, and Xi and Yi are the values of the
ith variable, at points X and Y respectively.
Update the mean value of the cluster, say, calculate the mean value of the objects in each cluster;
ISSN(E): 2277-128X, ISSN(P): 2277-6451, DOI: 10.23956/ijarcsse/V7I6/0345, pp. 20-24 Patr 2:
In the phase II, in makeDensityBased Clustering, clusters are constructed based on the density properties of database. The mass is the number of data points in the neighborhood of point p, let us consider mass = 31. The volume is the area of the circle if two dimensions are considered, so volume = π0.52= π/4. Therefore, our local density approximation at p = is calculated as :
density = mass/volume = 31/(π/4) = 124/π ~= 39.5.
Estimate the density of a given point using k-NN density estimation[10], we are going to find the distance to the Kth nearest point, dk, and use this as the radius of our neighborhood. Doing this, we obtain a neighborhood in the region of our point with exactly k other points in it.
The mathematical equation for the k-Nearest Neighbor estimator is given as:
In this equation, k is number of points we want in our neighborhood, xi is our given point, n is the number of points in the dataset, vd is the volume of the d-dimensional Euclidean ball, and rkd(xi) is the distance to the kth nearest point [15].
Here the modification is carried out by changing the density per instance using KNN assuming normal distribution and weighted Euclidean distance.
An overall average runtime complexity of O(n log n) is obtained. The worst case run time complexity remains O(n²). The distance matrix of size (n²-n)/2 can be materialized to avoid distance re computations [15].
IV. RBFNN USING PROPOSED MAKEDENSITYBASED (MDBC) CLUSTERING
A Radial Basis Function (RBF) neural network contains only one hidden layer and neurons in the hidden layer may vary depending upon a particular task. At this layer Gaussian transfer functions having outputs inversely proportional to the distance from the center of the neurons are used. The predicted target value of an item is same as other items, close to the predictor variables. Positions one or more neurons can be positioned by RBF network in the space described by the predictor variables. A dimension of this space is same as the number of predictor variables. The Euclidean distance is calculated from the point being evaluated to the center of each neuron, and a Radial Basis Kernel Function (RBF) is applied to this distance and weight for each neuron is calculated. Radius is used as one of the parameter so it is called Radial Basis Kernel Function (RBF) [10,14].
The radial-basis functions technique recommends designing of interpolation functions F of the subsequent form[14]:
F( x ) =
i=1Nwi
( || x - xi || )Where ( || x - xi || ) is a set of nonlinear radial-basis functions, xi are the centers of these functions, and ||.|| is the Euclidean norm.
V. RESULT AND EXPERIMENTAL DETAILS
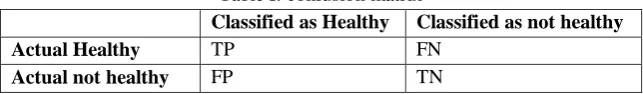
Clustering is widely used to give input to RBFNN. Here we will comparethe performance of RBFNN using K-Means and Proposed makeDensityBasedclustering on Liver Disorder Dataset. The experimentation detailed in this section was carried out within the Waikato Environment for Knowledge Analysis (WEKA) [9]. A well-known confusion matrix was obtained to calculate sensitivity, specificity and accuracy. Confusion matrix is a matrix representation of the classification results. Table 1 below shows confusion matrix [10]. Below formulae are used to calculate sensitivity, specificity and accuracy [10, 14]:
Sensitivity = TP / (TP + FN) Specificity = TN / (TN + FP)
Accuracy = (TP + TN) / (TP + FP + TN + FN)
Table I: confusion matrix
Classified as Healthy Classified as not healthy
Actual Healthy TP FN
Actual not healthy FP TN
Table 2: Performance of RBFNN using K-Means and MDBC Clustering Algorithms
Sensitivity Specificity Accuracy
RBFNN K-Means 55.86% 65.00% 61.15%
BFNN Proposed make Density Based Clustering(MDBC)
53.48% 62.50% 58.19%
ISSN(E): 2277-128X, ISSN(P): 2277-6451, DOI: 10.23956/ijarcsse/V7I6/0345, pp. 20-24
RBFNN for center initialization then RBFNN using K-Means perform better than RBFNN using Proposed makeDensityBased in terms of sensitivity, specificity and accuracy. Accuracy of RBFNN using K-Meansis 3% highas compared to Proposed makeDensityBased Clustering on Liver Disorder Dataset. Clustering in terms of sensitivity, specificity and accuracy as shown in Figure 3. This is due to the reason that center initialized by K-Means are best when data distribution is normal. So using K-Means BEFNN can do better prediction. But when shape of data set is of spiral type than RBFNN using Proposed makeDensityBased Clustering can perform better. Due to inherent complexity RBFNN using Proposed makeDensityBased Clustering are not preferred.
Figure: 3 Evaluation Graph
V. CONCLUSION
The result demonstrates that the RBFNN using K-Means achieve better results as compared to proposed makeDensityBased clustering on Liver Disorder Dataset. It is found that the proposed approach suffered from inherent complexities and not able to outperform RBFNN using K-Means. In future this research can be further improved so that better center initialization can be done to increase predictive power of RBF Neural Networks.
REFERENCES
[1] Singh R.V., Bhatia M.P.S.,“Data Clustering with Modified K-means Algorithm”, International Conference on Recent Trends in Information Technology, ICRTIT ,IEEE,2011, pp 717-721.
[2] Santhi P., Bhaskaran V.M.; “Performance of Clustering Algorithms in Healthcare Database”, International Journal for Advances in Computer Science, March 2010, Volume 2, Issue 1, pp 26-31.
[3] Zhao Y., Karypis G., “Evaluation of hierarchical clustering algorithms for document datasets”, the eleventh international conference on Information and knowledge management,2002,pp 515-524.
[4] Kumar V., Rathee N., “Knowledge Discovery
from Database using an Integration of clustering and Classification”, IJACSA, 2011,Vol 2, No.3,PP. 29-33. [5] Wang J., Su X.; “An improved K-means Clustering Algorithm”, Communication Software and Networks
(ICCSN), 2011 IEEE 3rd International Conference, 2011.
[6] Madhulatha T. S., “An Overview on Clustering Methods”,IOSR Journal of Engineering, Apr. 2012, Vol. 2(4) pp: 719-725
[7] Fan J., Ji M., Li T., Li Z. “Research On Visualized Data Quality Control Methods Of Ground Object Spectrum In Yanzhou Mining Area”, The International Archives of the Photogrammetry, Remote Sensing and Spatial Information Sciences, Vol. 38, Part II,pp: 212-217
[8] Shah G.H., Bhensdadia C.K., Ganatra A.P., “An Empirical Evaluation of Density-Based Clustering Techniques”, International Journal of Soft Computing and Engineering (IJSCE), March 2012, Volume-2, Issue-1,pp: 216-223
[9] Rammimmagadda S., Kanka P.,Yaramala V.B., “Implementation of Clustering Through Machine Learning Tool”, IJCSI International Journal of Computer Science Issues, Vol. 8, Issue 1, January 2011,pp: 395-401 [10] S. Godara and R. Singh, "Evaluation of Predictive Machine Learning Techniques as Expert Systems in Medical
Diagnosis", Indian Journal of Science and Technology, vol. 910, 2016.
[11] Sunila Godara, Rishipal Singh and Sanjeev Kumar, "A Novel Weighted Class based Clustering for Medical Diagnostic Interface," Indian Journal of Science and Technology Vol 9, Issue 44, Nov.2016.
0.00% 10.00% 20.00% 30.00% 40.00% 50.00% 60.00% 70.00%
RBFNN K-Means
ISSN(E): 2277-128X, ISSN(P): 2277-6451, DOI: 10.23956/ijarcsse/V7I6/0345, pp. 20-24
[12] Sunila Godara,, and Ritu Yadav, "Performance analysis of clustering algorithms for character recognition using Weka tool," International Journal of Advanced Computer and Mathematical Sciences Vol 4,Issue 1 , pp.119-23,2013.
[13] Sunila Godara, Amita Verma, “Analysis of Various Clustering Algorithms”, International Journal of Innovative Technology and Exploring Engineering (IJITEE), Vol. 3, Issue-1, pp.186-9,June 2013.
[14] Sunila G, Rishipal S, “Machine Learning For Medical Decision Support Systems (MDSS): A review”, International Journal of Applied Engineering Research. Vol.10,Issue13, pp. 32864-73,Nov 2015 .
[15] Sunila, Rishipal Singh and Sanjeev Kumar, "Proposed Density Based Clustering with Weighted Euclidean Distance”, International Journals of Advanced Research in Computer Science and Software Engineering, Volume-7, Issue-6, pp 409-412, June 2017.