ISSN-L: 2501 - 1235 Available on-line at: www.oapub.org/edu
DOI: 10.46827/ejpe.v6i5.3142 Volume 6 │ Issue 5 │ 2020
THE RELATIONSHIP BETWEEN ANKLE FLEXIBILITY,
AGILITY, AND SPRINT SPEED PERFORMANCE
IN COLLEGIATE FEMALE ATHLETES
Richardson, J., DeBeliso, M.i Southern Utah University, Department of Kinesiology and Outdoor Recreation, Cedar City, UT, USA
Abstract:
There is an ongoing search for different ways of increasing an athlete’s sprinting speed
and agility. It is possible that the flexibility of an athlete may play a role in regards to the agility and sprinting ability of an athlete. Purpose: The current study examined the relationship between ankle flexibility, agility and sprinting ability among female collegiate athletes. Methods: Fifteen (n=15) female collegiate athletes (age: 21.5±1.3 years, height: 173.7±7.5 cm, mass: 73.1±10.8 kg) of different sports (softball and basketball) and experience levels (Freshman-Senior) were recruited to take part in the study. The ankle flexibility was measured by the wall test (WT) for the right and left leg (WTR and WTL cms). Agility and sprinting ability were assessed using the T-test and a 36.6 meter sprint. Each athlete was given three attempts for each test. Results: The WT measures were (mean±SD): WTR=10.5±2.8 cms, WTL=11.1±2.7 cms. The T-Test and 36.6 meter sprint times were: 11.38±0.40 and 5.96±0.31 seconds respectively. The relationships between the variables were as follows: WTR and T-Test r=0.00, WTR and 36.6 meter sprint r=0.27, WTL and T-Test r=-0.33, WTL and 36.6 meter sprint r=0.02. None of the relationships were significant (p>0.05) or meaningful. Conclusion: Within the parameters of this study ankle flexibility was not related to agility or short sprint ability.
Keywords: T-test, sprint, wall test, NCAA
1. Introduction
The physical performance of an athlete has been shown to be dependent on an array of physical qualities such as strength, power, movement velocity (i.e. speed and agility) and technique (Kalkhoven & Watsford, 2018). With such a narrow margin between success or
failure at the elite level, it is critical to attain a deeper understanding of the human body and insight into how an athlete can achieve optimal performance. The sprinting speed and agility of an athlete are thought to be two of the most important physical qualities
that can affect an athlete’s sports performance (Ebben, Petushek, & Clewein, 2009). There
are a number of factors that contribute to an athlete’s agility and sprinting speed. Given
the relationship between agility, sprinting speed and optimal performance, it is important to understand the factors that enhance agility and sprinting speed (Šimonek, Horička, & Hianik, 2017).
Šimonek, Horička, & Hianik (2017) describes that the basic movement patterns of
team sports require the player to perform sudden changes in body direction in combination with rapid movements of limbs. These sudden changes in body direction could be described as agility. Though the definition of agility can differ amongst sport researchers, agility can be explained by one source as the ability to change directions in an effective and proficient way (Paule, Madole, Garhammer, Lacourse, & Rozenek, 2000). Agility can also be described in a more complex manner by allowing room for speed, balance, coordination, and the ability to react to the environment as part of the narrative (Plisk, 2000).
Horička, Hianik and Šimonek (2014) explain that agility can take many different
forms, from moving the entire body in the opposite direction while running at a high speed or simple footwork. In sports such as soccer, basketball and ice-hockey, agility is
one of the main determinants of performance (Šimonek, Horička, & Hianik, 2017). In
team sports, there are two concepts of agility. Some sports (i.e. gymnastics) have set movement mechanics or closed skills, while other sports (i.e. basketball) require decision making and the athlete to react quickly to stimulus in the environment or otherwise known as open skills (Payne, Berg, & Latin, 1997). In this regard, researchers have suggested that the agility is dependent on factors such as visual processing, reaction time,
perception, and anticipation (Šimonek, Horička, & Hianik, 2017). Given that numerous sports demand agility as a requirement to perform well in competition, it is often trained and assessed (Zemková & Hamar, 2014).
Maximum sprint speed is commonly assessed in order to evaluate the athletic potential of an individual (Ebben, Petushek, & Clewein, 2009). Speed can be defined as the shortest time required for an object to move along a specific distance, which is the same as velocity without clearly identifying the direction (Šimonek, Horička, & Hianik,
2017). The concept of speed is more complex in reality because it is not constant throughout the distance of the run and therefore should be viewed in regards to sprinting through 3 different phases: acceleration, maintenance of maximal speed, and deceleration
The utilization of sprinting speed can be observed in sports such as soccer, football and track (Ebben, Petushek, & Clewein, 2009).
Flexibility is also considered a physical characteristic important for successful sport performance (Alricsson, Harms-Ringdahl, Eriksson, & Werner, 2003). Holt, Holt, & Pelham (1996) define flexibility as the intrinsic property of the body tissues which determines the range of motion achievable without injury at a joint or group of joints. Flexibility finds itself as a necessary component of physical activity (César, Pernambuco, Vale, & Dantas, 2006).
Alter (1998) explains that there are internal and external factors that influence the flexibility level of an individual. Internal influences could be variables such as type of joint, internal resistance, or scar tissue (Alter, 1998). External influences include age, gender, temperature, clothing, and equipment (such as an ankle brace). Certain types of ankle braces can affect the dorsiflexion and plantarflexion of an ankle joint (Mann, Gruber, Murphy, & Docherty, 2019).
Flexibility has been linked to both vertical jump ability, sprint speed and agility with mixed opinions (Hunter et al., 2011; Kurt & Firtin, 2016; Mann et al., 2019; Thorson, 2018). Mann et al. (2019) describes that a restriction in the sagittal plane motion may decrease the ability of the athlete to generate maximal force against the ground and thus inhibit the power output during the push off of a vertical jump. Thorson (2018) demonstrated that flexibility is essential to allow the athlete the proper range of motion needed to successfully perform an optimal sprint. Conversely, it has been discovered that lower limb tendons, specifically the Achilles tendon, along with less flexible lower limb joints are associated with improved running economy (Hunter et al., 2011). Finally, while studies relating flexibility directly to agility are limited, Kurt and Firtin (2016) describe that acute static stretching has detrimental effects on the sprint speed and agility performance among athletes.
Lower limb stiffness is also thought to impact sprinting speed and agility. There are a variety of lower limb stiffness measures including but not limited to, vertical stiffness, joint stiffness, tendon stiffness and muscle stiffness (Kalkhoven & Watsford, 2018). While lower limb stiffness may be considered as the lack of flexibility, it poses an interesting contrast regarding previous research that supports the notion that flexibility is a requirement for optimal performance. It has been suggested that a greater lower limb stiffness (i.e. less flexible) is valuable for activities that require quick stretch shorten cycles and high movement velocities such as sprinting and agility (Kalkhoven & Watsford, 2018).
Cronin, Oliver, & Hughes, 2013) it appears that there is an association between lower limb stiffness, sprint speed as well as agility. However this implied relationship between lower limb stiffness (i.e. lack of flexibility), sprint speed and agility is in direct conflict with the notion that flexibility in the lower limbs is essential for optimal jumping, sprinting and agility (Mann et al., 2019; Thorson, 2018).
Given the aforementioned conflict regarding the relationship between lower limb stiffness (i.e. lack of flexibility) and measures of sprint speed and agility, this study examined the relationship between ankle flexibility (i.e. lower limb stiffness) and sprinting speed as well as agility among collegiate female athletes.
2. Methods
2.1 Participants
Division I NCAA female athletes were recruited from Southern Utah University, which is located in Cedar City, Utah. All participants were either an athlete participating in the sport of basketball or softball. The ages of the participants range from 18 to 23 years. Permission from the head coaches from each sport was obtained prior to asking for volunteers. Prior to conducting any assessments of the volunteers, permission from the Institutional Review Board was obtained. A written informed consent form was administered to all participants that they read and signed before participating in the study. It was made explicitly clear that the study was completely voluntary and they could withdraw from the study at any time and for any reason.
2.2 Instruments and Apparatus
Ankle flexibility was measured by using the wall test (WT). The agility of the athlete was assessed by using a standard T-test while the sprint speed was assessed by using a 36.6 meter sprint.
The study was conducted on the football field located on the campus of Southern Utah University (SUU) (see Figure 1). All assessments, including the WT, were completed in the same location. The equipment that was necessary to conduct this study were stopwatches, cones and a tape measure. All of the equipment was provided by the
Southern Utah University Women’s Basketball Team with permission from the head
Figure 1: T-test and 36.6 meter sprint carried out
on the football field at Southern Utah University in Cedar City, Utah
2.3 Procedures
The study was administered in three (3) individual one (1) hour sessions. Each participant chose which session to attend based on their personal availability. All sessions were completed during the same calendar day at 9:00 a.m., 1:00 p.m. and 5:00 p.m. Upon arrival
the participant’s height, age and weight were recorded. Height and weight were assessed
without shoes or excess items of clothing on.
Each one-hour assessment session commenced with a 5-10 minute warm-up consisting of:
• 15 repetitions – Jumping Jacks • 18.3 meters and back - Grape Vines • 18.3 meters and back - High Knees • 18.3 meters and back - Butt Kickers • 13.7 meters and back - Lunge with Twist • 10 repetitions each leg - Forward Leg Swings • 10 repetitions each leg - Side Leg Swings
• 13.7 meters and back - Quad Stretch (Alternating Legs) • 13.7 meters and back - Figure 4 Stretch (Alternating Legs) • 13.7 meters and back - Calf Stretch (Alternating Legs)
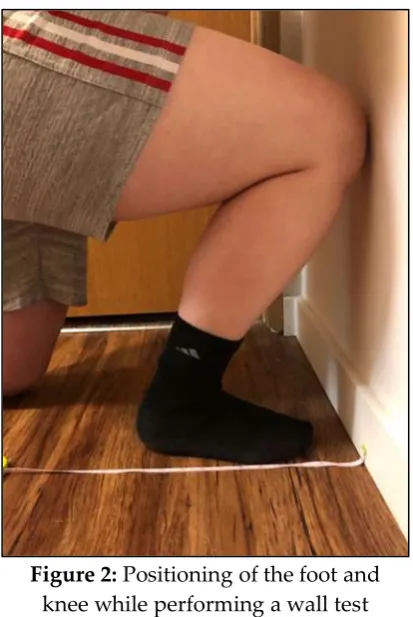
Following the aforementioned warm-up the ankle flexibility of the athlete was assessed by using the WT in a manner consistent with that detailed by Konor, Morton, Eckerson, & Grindstaff, (2012). The WT is considered highly reliable with ICCs ranging from 0.98-0.99 (Konor, Morton, Eckerson, & Grindstaff, 2012).
The participant started by kneeling on one knee facing the wall. The instructions
completed their right leg assessment first and then completed the left leg assessment. Each assessment, WTR and WTL, was performed once on each leg (see Figure 2). All of the results were recorded by hand and subsequently transferred to an MS Excel spreadsheet.
Figure 2: Positioning of the foot and knee while performing a wall test
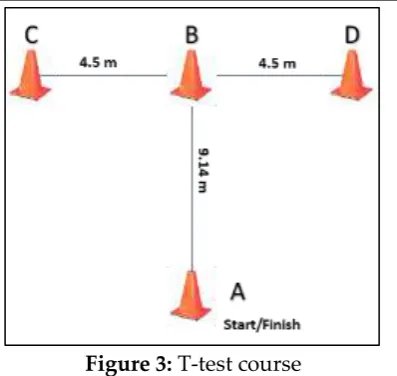
Following the ankle flexibility assessments, the participants then performed the T-test. The T-test has demonstrated high reliability with an ICC of r=0.98 across three trials (Paule, Madole, Garhammer, Lacourse, & Rozenek, 2000). Each participant performed the T-test in three separate time trials. In between each time trial there was a 3-5 minute break given to allow full rest and recovery. The T-test course is illustrated in Figure 3.
The directions for the T-test were as follows:
Figure 3: T-test course
Finally, all participants completed three trials of the 36.6 meter sprint as timed by hand held stopwatches. Two individuals timed each assessment. One researcher stood perpendicular to the start line while the other stood perpendicular to the finish line. The average of both scores recorded was calculated to find the official time. All time trials were recorded by the same researchers. The reliability of the 36.6 m sprint as timed using a hand held stopwatch is considered very high with a reported ICC=0.98 (Mann, Ivey, Brechue, & Mayhew, 2015). The 36.6 meter sprint was performed on the football field, starting on the end zone and ending at the forty (40) yard line marker. Between each sprint trial the athlete was given a 3-5 minute rest. All participants performed each of the T-test and 36.6 meter sprint trials in one session; however, there was a 5 minute inter-test break to allow sufficient recovery.
3. Design and Analysis
The variables assessed in this study were: the WTR, WTL, T-Test, and 36.6 meter sprint. The association between WT measures, the T-test and 36.6 meter sprint were calculated using Pearson correlation coefficients (PCC or r). Significance for the correlations was
considered as alpha≤0.05. Data management and statistical analysis was conducted in MS Excel 2013.
4. Results
Fifteen female collegiate athletes (basketball=8, softball=7) completed the study without complication or injury. The demographics of the participants in study are presented in Table 1. The average age, height, body mass and experience level of the participants were: 21.5±1.3 years, 173.7±7.5 cms and 73.1±10.8 kg.
sprint was 5.96 ± 0.31 seconds (see Table 2). The average time of the best T-test scores was 11.38 ± 0.40 seconds (see Table 3). The average recorded scores for the WTR was 10.5±2.8 cms and the WTL was found to be 11.1±2.7 cms (see Table 4).
Table 1: Participant Descriptive Information
Age (years) Height (cm) Mass (kg) Experience
(class levels)
Female (n=15) 21.5±1.3 173.7±7.5 73.1±10.8 Freshmen-Seniors
*mean±standard deviation.
Table 2: 36.6 Meter Sprint trial data (seconds)
Trial 1 Trial 2 Trial 3 Best Trial
Female (n=15) 5.99±0.35 5.96±0.34 5.97±0.36 5.96±0.31
*Average across three trials, mean±standard deviation
Table 3: T-test trial data (seconds)
Trial 1 Trial 2 Trial 3 Best Trials
Total
Female (n=15) 11.75±0.39 11.64±0.40 11.45±0.46 11.38±0.40
*Average across three trials, mean±standard deviation
Table 4: Averages of Assessment scores
Wall Test Right (cms)
Wall Test Left (cms)
Female (n=15) 10.5±2.8 11.1±2.7
*Average across three trials, mean±standard deviation
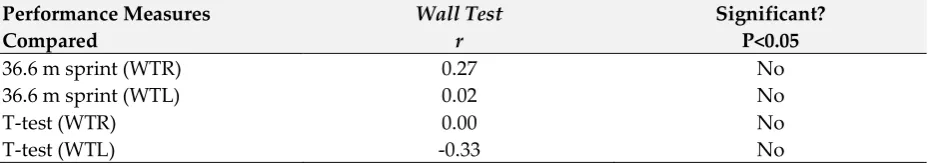
Table 5: Summary of Comparison of the performance measures and the wall test
Performance Measures Compared
Wall Test r
Significant? P<0.05
36.6 m sprint (WTR) 0.27 No
36.6 m sprint (WTL) 0.02 No
T-test (WTR) 0.00 No
T-test (WTL) -0.33 No
WTR-wall test right, WTL-wall test left, r-Pearson correlation coefficient
and sprint times as well as ankle flexibility and agility times. In this current study, neither agility nor sprinting speed, were found to have a meaningful and significant relationship with ankle flexibility (p>0.05).
An average time for a collegiate female athlete to complete the T-test is between 11-11.5 seconds (Paule, Madole, Garhammer, Lacourse, & Rozenek, 2000). The majority of participants in this current study (66.6%) demonstrated above normative reference scores on the T-test. Above average scoring could be expected from this population due to the previous agility training each athlete engaged in as part of sports training. The majority of participants (66.6%) completed the 36.6 meter sprint assessment in a time of
≤ 5.9 seconds. The other 33.3% completed the test in a range of 6.0-6.4 seconds. Compared to the normative data found by Plisk (2000), collegiate female athletes should have an average time of 5.99 ± 0.29 seconds to complete the 36.6 meter sprint. Of the 5 individuals who scored in the 6.0-6.4 second range, 4 of them were underclassmen. The difference in sprint times between the lower and upper classmen supports the notion that the upperclassmen may be more physically developed with better sprinting mechanics.
Ankle flexibility (i.e. lower limb stiffness) has been associated with vertical jump, sprint speed and agility with a lack of agreement among researchers (Alricsson, Harms-Ringdahl, Eriksson, & Werner, 2003; Hunter et al., 2011; Kurt & Firtin, 2016; Mann et al., 2019; Thorson, 2018). Thornson (2018) states that only through gaining flexibility will an
athlete be able to reach top level sprinting and considers flexibility as a “Speed Performance Ingredient”. Mann et al. (2019) describes that when there is a restriction in
the sagittal plane motion it may decrease the amount of maximal force generated by the athlete on the push off of a vertical jump. According to Alricsson, Harms-Ringdahl, Eriksson, & Werner (2003), greater flexibility allows for greater performance and thus better times when performing agility and sprinting tests. The aforementioned studies support the idea that an athlete with greater flexibility will perform better on agility, vertical jump or sprinting drills.
To the contrary, Hunter et al. (2011) discovered that lower limb tendons, specifically the Achilles tendon, as well as less flexible lower limb joints correlate with improved running economy. Likewise, a study conducted by Kurt and Firtin (2016) displayed that acute static stretching had adverse effects on the sprinting speed and agility of an individual. The data found in the current study does not support the idea that ankle flexibility (i.e. lower limb stiffness) has a significant positive or negative relationship with agility or sprinting speed of an athlete.
is plantar fasciitis. Plantar fasciitis can occur when an athlete’s muscles and/or tendons aren’t flexible (or strong enough) leading to a “functional deficit in the normal foot biomechanics” (Kibler, Goldberg, & Chandler, 1991). The differing outcomes of the
aforementioned studies (Alricsson, Harms-Ringdahl, Eriksson, & Werner, 2003; Hreljac, Marshall, & Hume, 2000; Hunter et al., 2011; Kibler, Goldberg, & Chandler, 1991; Kurt & Firtin, 2016; Mann et al., 2019; Thorson, 2018) may suggest that there is an optimal level of lower limb flexibility (i.e. stiffness) within the spectrum of performance enhancement and injury prevention. It is important to note that the athletes in the current study had not suffered any serious lower limb injuries prior to performing the assessments in this study.
We found it surprising that no meaningful relationships were found between the constructs. It is possible that relationships remained insignificant due to the lack of diversity in variables such as training experience, height and age. A larger, more varied participant sample size may allow for researchers to control such variables, then it is possible that a meaningful relationship between ankle flexibility (i.e. lower limb stiffness) and the agility and sprinting ability maybe revealed.
Other limitations to be considered are the surface the assessments were conducted on, time tracking tools and the uncontrollable environmental factors. Both the agility and sprinting speed tests were conducted on an artificial turf field where neither softball (at times) nor basketball is played. This could potentially have a negative effect on the
athletes. These findings neither support nor refute previous research findings (Alricsson, Harms-Ringdahl, Eriksson, & Werner, 2003; Hunter et al., 2011; Kurt & Firtin, 2016; Mann et al., 2019; Thorson, 2018). As such, future research regarding this topic appears warranted.
References
Alricsson, M., Harms-Ringdahl, K., Eriksson, K., & Werner, S. (2003). The effect of dance training on joint mobility, muscle flexibility, speed and agility in young cross-country skiers – a prospective controlled intervention study. Scandinavian Journal of Medicine & Science in Sports, 13(4), 237–243.
Alter, M. J. (1998). Science of flexibility. Windsor, Ont.: Human Kinetics.
Aquino, C., Gomes, G., Gonçalves, P., Fonseca, S., & Mancini, M. (2006). Analysis of the relation between flexibility and passive stiffness of the hamstrings. Revista Brasileira de Medicina do Esporte, 12(4), 195-200.
Blickhan, R. (1989). Spring-mass model for running and hopping. Journal of Biomechanics,
22(11/12), 1217-1227.
César, E. P., Pernambuco, C. S., Vale, R. G. S., & Dantas, E. H. M. (2006). The relationship between flexibility levels and the predominant muscle Fiber Type. Fitness & Performance Journal (Online Edition), 5(6), 27–34.
Chan, S. P., Hong, Y., & Robinson, E. D. (2001). Flexibility and passive resistance of the hamstrings of young adults using two different static stretching protocols. Scandinavian Journal of Medicine & Science in Sports, 11(2), 81.
Chelly, S. M., & Denis, C. (2001). Leg power and hopping stiffness: relationship with sprint running performance. Medicine & Science in Sports & Exercise, 33(2), 326–333. Corbin, C. B. (1984). Flexibility. Clinics in Sports Medicine, 3(1), 101–117.
Ebben, W. P., Petushek, E. J., & Clewein, R. (2009). A comparison of manual and electronic timing during 20 and 40 yards sprints. Journal of Exercise Physiology Online, 12(5), 34–38.
Fraser, J. J., Koldenhoven, R. M., Saliba, S. A., & Hertel, J. (2017). Reliability of ankle-foot morphology, mobility, strength, and motor performance measures. International Journal of Sports Physical Therapy, 12(7), 1134–1149.
Girard, O., Mendez-Villanueva, A., & Bishop, D. (2011). Repeated-sprint ability—Part I.
Sports Medicine, 41(8), 673-694.
Holt, J., Holt, L. E., & Pelham, T. W. (1996). Flexibility redefined. In, Bauer, T. (ed.), XIII International symposium for biomechanics in sport: proceedings, 170-174.
Horicka, P., Hianik, J., & Simonek, J. (2014). The relationship between speed factors and agility in sportgames. Journal of Human Sport & Exercise, 9(1), 49-58.
des membres inferieurs chez les coureurs. Medicine & Science in Sports & Exercise, 32(9), 1635–1641.
Hunter, G. R., Katsoulis, K., McCarthy, J. P., Ogard, W. K., Bamman, M. M., Wood, D. S., Den Hollander, J. A., Blaudeau, T. E., & Newcomer, B. R. (2011). Tendon length and joint flexibility are related to running economy. Medicine & Science in Sports & Exercise, 43(8), 1492–1499.
Jeffreys, I. (2011). A task-based approach to developing context-specific agility. Strength and Conditioning Journal, 33(4), 52-59.
Kalkhoven, J. T., & Watsford, M. L. (2018). The relationship between mechanical stiffness and athletic performance markers in sub-elite footballers. Journal of Sports Sciences, 36(9), 1022–1029.
Kibler, B. W., Goldberg, C., & Chandler, J. T. (1991). Functional biomechanical deficits in running athletes with plantar fasciitis. The American Journal of Sports Medicine, 19(1), 66–71.
Konor, M. M., Morton, S., Eckerson, J. M., & Grindstaff, T. L. (2012). Reliability of three measures of ankle dorsiflexion range of motion. International Journal of Sports Physical Therapy, 7(3), 279–287.
Krell, J. B., & Stefanyshyn, D. J. (2006). The relationship between extension of the metatarsophalangeal joint and sprint time for 100 m Olympic athletes. Journal of Sports Sciences, 24(2), 175–180.
Kurt, C., & Fırtın, İ. (2016). Comparison of the acute effects of static and dynamic
stretching exercises on flexibility, agility and anaerobic performance in professional football players. Turkish Journal of Physical Medicine & Rehabilitation, 62(3), 206–213.
Kutlu, M., Yapici, H., & Yilmaz, A. (2017). Reliability and validity of a new test of agility and skill for female amateur soccer players. Journal of Human Kinetics, 56(1), 219–
227.
Mann, B., Gruber, A. H., Murphy, S. P., & Docherty, C. L. (2019). The influence of ankle braces on functional performance tests and ankle joint range of motion. Journal of Sport Rehabilitation, 28(8), 817–823.
Mann, J. B., Ivey, P. J., Brechue, W. F., & Mayhew, J. L. (2015). Validity and reliability of hand- and electronic- timing for 40-yard sprint in college football players. Journal of Strength and Conditioning Research, 29(6), 1509-1514.
Meyers, R. W., Moeskops, S., Oliver, J. L., Hughes, M. G., Conin, J. B., & Lloyed, R. S. (2019). Lower-limb stiffness and maximal sprint speed in 11-16-year-old boys. Journal of Strength & Conditioning Research, 33(7), 1987–1995.
Piekorz, Z., Lewandowski, A., Radziminka, A., Weber-Rajek, M., Siedlaczek, M., Lulinska-Kuklik, E., & Moska, W. (2017). Functional mobility and flexibility in young female swimmers. Trends in Sport Sciences, 24(1), 39–43.
Pitsiladis, Y., Davis, A., & Johnson, D. (2011). The science of speed: determinants of performance in the 100 m sprint. International Journal of Sports Science & Coaching, 6(3), 495–498.
Plisk, S. S. (2000). Speed, agility, and speed-endurance development. In Essentials of strength training and conditioning. 4(4) 471-491.
Rumpf, M. C., Cronin, J. B., Oliver, J. L., & Hughes, M. G. (2013). Vertical and leg stiffness and stretch-shortening cycle changes across maturation during maximal sprint running. Human Movement Science, 32(4), 668–676.
Salinero, J. J., Abian-Vicen, J., Del Coso, J., & González-Millán, C. (2014). The influence of ankle dorsiflexion on jumping capacity and the modified agility t -test performance. European Journal of Sport Science, 14(2), 137–143.
Sassi, R. H., Dardouri, W., Yahmed, M. H., Gmada, N., Mahfoudi, M. E., & Gharbi, Z. (2009). Relative and absolute reliability of a modified agility t-test and its relationship with vertical jump and straight sprint. Journal of Strength & Conditioning Research, 23(6), 1644–1651.
Šimonek, J., Horička, P., & Hianik, J. (2017). The differences in acceleration, maximal speed and agility between soccer, basketball, volleyball and handball players. Journal of Human Sport & Exercise, 12(1), 73–82.
Slawinski, J., Termoz, N., Rabita, G., Guilhem, G., Dorel, S., Morin, J.-B., & Samozino, P. (2017). How 100-m event analyses improve our understanding of world-class
men’s and women’s sprint performance.Scandinavian Journal of Medicine & Science in Sports, 27(1), 45–54.
Theurillat, C., Punt, I., Armand, S., Bonnefoy-Mazure, A., & Allet, L. (2018). Active ankle circumduction to identify mobility deficits in subacute ankle sprain patients. Journal of Applied Biomechanics, 34(1), 1–6.
Thorson, M. (2018). Marauder speed “getting you there faster”: A practical guide to speed
& speed development. Track Coach, 225, 7164–7172.
Wagganer, J. D., Williams, R. D., & Barnes, J. T. (2014). The effects of a four-week primary and secondary speed training protocol on 40 yard sprint times in female college soccer players. Journal of Human Sport & Exercise, 9(3), 713–726.
Zarrouk, N., Chtourou, H., Rebai, H., Hammouda, O., Souissi, N., Dogui, M., & Hug, F. (2012). Time of day effects on repeated sprint ability. International Journal of Sports Medicine, 33(12), 975-980.
Creative Commons licensing terms