© 2020 by the Serbian Biological Society How to cite this article: Lenzi C, Grasso C, Nicoara M, Savuca A, Ciobica A, Plavan 45 GI, Strungaru SA. Behavioral responses of zebrafish (Danio rerio) to different 2D
non-moving stimuli. Arch Biol Sci. 2020;72(1):45-52.
Behavioral responses of zebrafish (
Danio rerio
) to different 2D non-moving stimuli
Christian Lenzi1, Chiara Grasso1, Mircea Nicoara2,4, Alexandra Savuca2,*, Alin Ciobica3,5,6, Gabriel Ionut Plavan2
and Stefan-Adrian Strungaru3,4
1Associazione ETICOSCIENZA, Turin, Italy
2Alexandru Ioan Cuza University of Iasi, Department of Biology, Faculty of Biology, Bd. Carol I, 20A, 700505, Iasi, Romania 3Alexandru Ioan Cuza University of Iasi, Department of Research, Faculty of Biology, Bd. Carol I, 20A, 700505, Iasi, Romania 4Alexandru Ioan Cuza University of Iași, Doctoral School of Geosciences, Faculty of Geography-Geology, Bd Carol I,
700505, Iasi, Romania
5Academy of Romanian Scientists, Splaiul Independentei nr. 54, sector 5, 050094 Bucuresti, Romania 6Center of Biomedical Research, Romanian Academy, Iasi, B dul Carol I, no 8, Romania
*Corresponding author: [email protected]
Received: August 23, 2019; Revised: November 10, 2019; Accepted: November 12, 2019; Published online: December 11, 2019
Abstract: Zebrafish (Danio rerio) is considered an experimental model organism with numerous applications in different
fields. The mechanisms underlying social and reproductive preferences are complex. Most of the literature on conspecific interactions focus on the chemical communication mediated by scattered signals in the aquatic medium. The aim of this research was to evaluate the behavioral responses induced in the tested animals by artificial social stimuli. We used 20 sexually mature individuals that underwent several non-invasive behavioral tests in a cross-maze. Artificial non-moving 2D images were created for this study, using photoshop graphics software. Ethological measurements were conducted using video-tracking software (EthoVision XT). The findings showed significant sex-related differences in zebrafish responses to fixed artificial stimuli. In particular, females shoaled more with 2D non-moving images representing conspecifics phe-notypically more distant (i.e. color) from them. Integrating dimension and number of individual, one large stimulus was preferred over three small stimuli in terms of cumulative and mean duration for males, and only in terms of cumulative duration for females. We concluded that 2D images representing conspecifics, even without movements, can induce a behavioral response in this species.
Keywords: zebrafish; behavioral tests; shoaling behavior; EthoVision XT; artificial stimuli
INTRODUCTION
Zebrafish, Danio rerio [1], is a small tropical freshwa-ter species belonging to the Cyprinidae family [2,3]. The actual geographical distribution of zebrafish has not yet been fully determined [4]. Traditionally, it is considered that the geographic range of this species extends from Nepal to the Indian state of Karnataka, from north to south, and from Pakistan to Myanmar (Burma) [5].
For animal behavior study, numerous techniques based on the behavioral response to non-invasive ar-tificial stimulation in an experimental environment (mainly computer-animated) have been developed
[6,7]. Some of these include the use of virtual stimuli, such as photos, animated images in 2D and 3D, videos, models and robots. These methods have been applied to many species, from mammals to birds, arachnids and reptiles, without exclusion of aquatic species [8].
In the last decade, a series of studies have been published, in particular by the research group led by Gerlai et al. [9,12], on the behavioral responses induced by artificial stimuli in zebrafish. It was observed that tested individuals prefer to spend more time near com-partments with animated 2D images representing con-specifics, similar to what has been documented using true conspecific or video stimuli. The social response to conspecifics is highlighted since this does not occur if individuals of other species are presented as stimuli, regardless of whether these species exhibit or do not exhibit heterospecific shoaling in normal conditions. These observations were reported by Polverino et al. [13] who used some zebrafish-like animated 2D images. The authors reported that zebrafish preferred conspe-cific representations independently of body coloration and the presence of species-typical longitudinal strips. The 2D images used as a stimulus were manipulated by a graphics software to evaluate zebrafish preference for a certain color and the presence or absence of the stripes with respect to shape and body symmetry. The authors noted that zebrafish did not show preferences for an image of a wild-type individual and that of a shorter and extended individual on the vertical axis (especially in the abdominal region), but exhibited avoidance behavior to the altered image representing an elongated individual. Interestingly, when different wild-type coloring images were compared with the yel-low body-color image, a certain attraction of the indi-viduals was observed, unlike the absence of preference for images of individuals with red and normal coloring [13]. Thus, zebrafish seem to discriminate between dif-ferent social stimuli through visual cues represented in a 2D image, despite the fact that movement was not considered as a determining factor for the induction of social responses. More recent experiments have at-tempted to study the behavioral response of zebrafish in front of stylized models or robots. Initially, the oc-currence of a social response towards a robotic stimulus was demonstrated both for individuals and for a group [14], but at a lower degree than that shown towards real conspecifics. In addition, the swimming and movement frequency of the posterior fin of the zebrafish robot were shown to influence the behavioral response of the individuals during the experimental phase [15].
In the present study we investigated the behavioral responses of zebrafish to non-moving artificial stimu-li. We describe a novel model that reduces the use of
animals in research. We tested whether the presence of 2D images of a female zebrafish (phenotypically al-tered by graphics software) could influence the social behavior of this species.
MATERIALS AND METHODS
Ethics statement
The animals were maintained and treated according to the EU Commission Recommendation of 18 June 2007 on the guidelines for the accommodation and care of animals used for experimental and other sci-entific purposes, and [16] of the European Parliament and Council of 22 September 2010 on the protection of animals used for scientific purposes.
Animals and housing
Twenty sexually mature individuals (males and females) of zebrafish “GloFish®” were randomly chosen from dif-ferent breeding facilities in order to maintain, as far as possible, a high genetic variability of the samples. The animals were divided into two groups based on their sex: a sample of 10 males and a sample of 10 females, without any identifying labels. Sex identification was performed by recognition of the more rounded and pronounced abdominal region of female individuals. Each group was kept for 48 h in a glass aquarium of 19.5 x 30 x 17 cm (width x height x depth), provided with a special aerator, filled with 5 L of water main-tained at 21.23°C, pH 7.95, salinity 277 mg/L TDS (total dissolved solids) and a photoperiod of 14 h light/10 h dark. All animals were fed twice a day with a tropical species “Amtra Prima Flake” of Croci S.p.A; the water inside the aquariums was changed daily to avoid altera-tions of salinity values. These condialtera-tions were moni-tored and maintained within a certain tolerance interval (which varied according to the variable considered) throughout the duration of the experiment.
Experimental design
avoid potential influences of circadian rhythms and/ or hormonal cycles on the experimental results. As hypothesized previously [17], during the early hours of the day, individuals tend to display greater sexual at-traction that can influence performance on behavioral tests. At present, there is no evidence about the influ-ence of afternoon or night time on zebrafish sexual behavior in the literature. For each behavioral test, only one focal individual was studied. The fish was carefully placed through a screen for aquariums in the start area (defined as the start-point), and movements were re-corded and measured throughout the duration of the test. At the end of the experimental phase, all tested individuals were evaluated for their physical and gen-eral well-being, and were relocated to the experimental aquarium where they had been taken from.
For the present study, a multi-purpose cross-maze adapted to a T-maze served as the experimental envi-ronment. Separating panels were used to delimit the start-point zone and the stimulus areas. A digital cam-era centered above the maze was connected directly to a computer supplied with the software, allowing recording of all behavioral variables of the focal ani-mal (Supplementary Figs. S1, S2, S3).
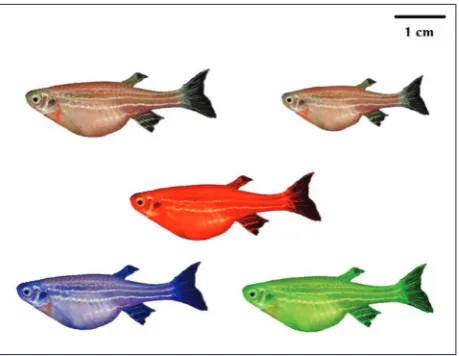
The behavioral response of the two experimental groups of males (n=10) and females (n=10) was as-sessed with regard to stimuli consisting of fixed (non-moving) 2D images representing zebrafish individuals with an altered phenotype. To obtain the graphically manipulated 2D images, a zebrafish female individual was photographed using a digital camera and the pho-tographic images were manipulated using the Adobe Photoshop CC 2017 graphics processing software. For the image of the individual, only the abdominal re-gion was extended and accentuated, leaving the general “morphometric” proportions unchanged. For images with variations in body color, the same phenotypical alteration (of the abdomen) was maintained and only the basic shade and color were modified (Fig.1). In order to avoid the so-called “tank effect” (i.e. habitua-tion and an animal learning the posihabitua-tion of a specific experimental stimulus), in each behavioral test, the position of the social stimuli was successively reversed from one arm to the other for both males and females. Depending on the type of behavioral test, several 2D non-moving images representing zebrafish individuals were used as stimuli. For each behavioral test, only one
trial was executed and the performance of the focal individual (for both samples) was recorded for 4 min with video-tracking software. Prior to the experimen-tal measurements, each individual was left in the start zone for about 1 min in order to acclimatize to the new environment and to lower the stress following displace-ment from its environdisplace-ment.
Behavioral measurements and tests
All recordings of movements (and behavioral vari-ables) were done by the video-tracking software, EthoVision XT 11.5, produced by Noldus Information Technology [18]. This type of system can completely replace manual observations in behavioral experi-ments, allowing for the use of specific variables that can accurately describe the performance of each in-dividual [19]. The video-tracking system consists of a video camera that can capture everything that takes place within the experimental area of interest, and is connected to a computer either directly or via a video recorder. All recorded data are sent to the software, where the selected behavioral variables can be mea-sured and analyzed. The video signals arriving from the camera to the software correspond to a series of frames (25-30 per s), each with its own pixel grid. The software analyzes the individual frames, distinguish-ing between a movdistinguish-ing object and the experimental background environment. After finding the moving
object and its position in each frame, the software has all the information necessary to carry out the mea-surements of the behavioral variables of interest [20]. In the first behavioral test, “big female vs. empty compartment”, the possible preference between the image of the “big female” and the absence of a stimu-lus (“empty compartment”) was assessed for each in-dividual of both sexes. The objective was to test the reaction of the focal individual to the image displayed (avoidance, disinterest or attraction) and whether the image was recognized as a social stimulus and thus preferred to the empty compartment.
In the second behavioral test, “big female vs. big red female”, the aim was to identify whether a more intense color (consistent with the phenotype of the animals chosen for the experiment) could trigger a particular response in the examined animal.
In the third behavioral test, “big female - red vs. blue vs. green”, we investigated the possible preference for a specific body color of the “big female” 2D image stimulus. Three stimuli were arranged as follows: “big red female”, “big green female” in the lateral sides of the cross maze, and the “big blue female” in the central corridor (at the start-point height). This was the only behavioral test in which three social stimuli were used at the same time for measuring the performance and temporal variables (cumulative duration and average) within each zone. In this particular case, the operator inserted the individual directly in the decision-point area, which was equidistant from the three-stimulus zones.
In the fourth behavioral test, “big female vs. 3 small females”, the possible preference between one “big female” and “3 small females” was studied. In this test, the size and shoal number of the stimuli were considered simultaneously.
Statistical analysis
All data obtained from both experimental groups of males and females subjected to the four behavioral tests were collected using the OriginPro 2016 statisti-cal software. The variables studied for each group (the performance and the response to the stimuli) were:
the acceleration (maximum and minimum) (cm/s2),
cumulative duration (i.e. the total time spent in a spe-cific area of the cross-maze) expressed as a
percent-age (%), the averpercent-age duration (i.e. the averpercent-age time spent in a specific area of the cross-maze, expressed in seconds (s), the average speed (cm/s), the activity index (i.e. the total time individual moved) (s), the inactivity index (i.e. the total time that the software did not detect any movements of the individual) (s), the rotation (in reference to the individual’s center-point), (i.e. the circular motion near the area where a stimulus was presented, expressed as the frequency and the total distance traveled (cm).
For all behavioral tests, the normal data distribu-tion was evaluated (Kolmogorov-Smirnov test). We used the Student’s t-test for normal distributed sam-ples, and the Mann-Whitney U test and the Wilcoxon rankings test for samples not normally distributed. Homoscedasticity (Levene’s test) was analyzed and post hoc analyses were performed to compare the av-erages (Bonferroni and Tukey tests).
In the first behavioral test, “big female vs. empty compartment”, the Mann-Whitney U test was used to analyze the averages of both samples for maximum ac-celeration and minimum acac-celeration. The Student’s t-test for dependent and independent samples was used to compare the remaining variables in the comparison between the two samples and within them, on the per-formance and on the duration in the stimulus areas: cumulative duration, average duration, average speed, activity index, inactivity index, rotation frequency, and total distance traveled.
In the second behavioral test, “big female vs. big red female”, the Mann-Whitney U test was used to verify whether there were any significant differences between the two samples for the averages of maximum and minimum acceleration, the average duration in the “big female” and in the “big red female” areas. The Wilcoxon rankings test was used to compare the averages within the male sample for the average du-ration in the two-stimulus zones. The student’s t-test for dependent and independent samples was used to study the remaining variables, both those for per-formance and those for time duration between and within samples near the two stimuli: cumulative du-ration, duration average of females in the two zones, average speed, activity index, inactivity index, rotation frequency and the total distance traveled.
compare the averages of the two samples for maximum and minimum acceleration. Student’s t-test for dependent and inde-pendent samples was used for all the other variables of performance (average speed, activity, inactivity, rotation frequency, and total distance traveled) and for all time intervals (cumulative duration and duration), both within and without the samples, with the exception of the average duration for the males sample (for which the Wilcoxon sign-by-row test was used).
In the fourth behavioral test, “big fe-male vs. 3 small fefe-males”, the Student’s t-test was used for dependent and in-dependent samples for all performance variables: maximum and minimum ac-celeration, average speed, activity, in-activity, frequency of rotation and total distance traveled. The Student’s t-test was also used for temporal variables (cumula-tive duration and average duration) both
within the individual samples and for comparison between them. The only exception was the average duration of the male sample, where the Wilcoxon sign-by-row test was used.
In order to avoid confusion with similar notation often found in the literature for the standard error [21], the average of the behavioral variables is reported as the “mean (SD, standard deviation)”.
RESULTS
Test: big female vs. empty compartment
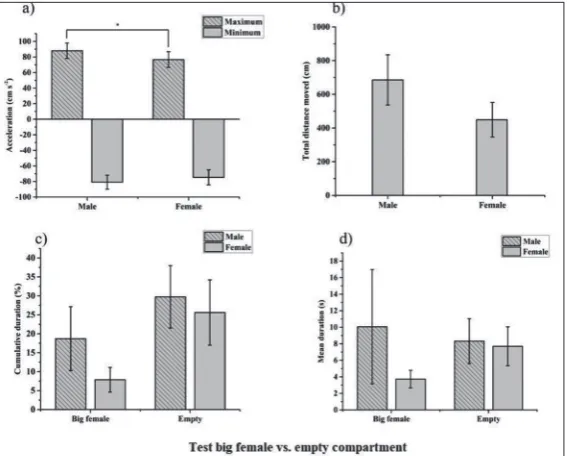
In the first behavioral test there were no statistically significant differences between the two-stimulus ar-eas in terms of cumulative duration, in either males (Student’s t-test, t=-0.817, N1=10, N2=10, p=0.435) or females (Student’s t-test, t=-1.928, N1=10, N2=10, p=0.086). The same was found for the mean dura-tion (males: Student’s t-test t=0.227, N1=10, N2=10, p=0.825; females: Student’s t-test, t=-1.943, N1=10, N2=10, p=0.084). Males showed a higher maximum acceleration than females (Mann-Whitney U test, N1=10, N2=10, U=79, Z=1.56, p=0.031), (Fig. 2).
Test: big female vs. big red female
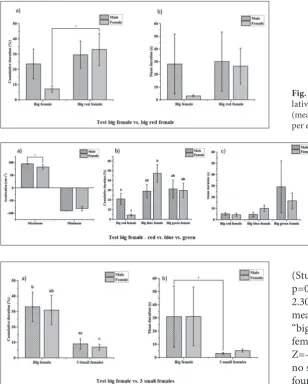
In the second behavioral test, females showed great-er cumulative duration for the “big red female” area (Student’s t-test, t=-2.267, N1=10, N2=10, p=0.049), while there were no statistically significant differenc-es for the mean duration (Student’s t-tdifferenc-est, t=-1.625, N1=10, N2=10, p=0.138). For males, no statistically significant differences were found either for the cu-mulative duration (Student’s t-test, t=-0.376, N1=10, N2=10, p=0.716) or for the average duration (sign test by ranks of Wilcoxon, W=17.5, Z=-0.969, N1=10, N2=10, p=0.332), (Fig. 3).
Test: big female – red vs. blue vs. green
In the third behavioral test, in terms of cumulative duration the females preferred a “big blue female” vs. a “big red female” (Student’s t-test, t=-4.595, N1=10, N2=10, p=0.001), while for the same variable no sta-tistically significant differences were found between “big blue female” vs. “big green female” (Student’s t-test, t=1.243, N1=10, N2=10, p=0.245). Also, females preferred the “big green female” stimulus over the “big red female” for the cumulative duration (Student’s
t-Fig. 2. Main results of the first behavioral test: acceleration (mean±SD) (a) – total distance moved (mean±SD) (b); cumulative duration of activity in the arm
with stimuli (mean±SD) (c); time spent in the arm with stimuli per entrance
test, t=-3.616, N1=10, N2=10, p=0.005). For males, no statistically significant differences were found for the cumulative duration related to the three stimuli, but compared to females they spent more time close to the “big red female” area (Student’s t-test, t=1.007, N1=10, N2=10, p=0.009). Males showed a greater maximum acceleration than females (Mann-Whitney U test, U=81, Z=2.305, N1=10, N2=10, p=0.021), (Fig. 4).
Test: big female vs. 3 small females
In the fourth behavioral test, a statistically significant preference was found for the “big female” stimulus, in terms of cumulative duration, both for males
(Student’s t-test, t=-2.279, N1=10, N2=10, p=0.048) and females (Student’s t-test, t=-2.304, N1=10, N2=10, p=0.046). In terms of mean duration, again the males preferred the “big female” area compared to the “3 small females” (Wilcoxon sign-by-row test, W=2, Z=-2.369, N1=10, N2=10, p=0.012), while no statistically significant differences were found for females (Student’s t-test, t=-1.142, N1=10, N2=10, p=0.283), (Fig. 5).
The data of all variables for each behav-ioral tests are given in Supplementary Table S1.
DISCUSSION
In the present study we aimed to investigate zebrafish behavioral responses to non-moving artificial stimuli and to establish a new model for reducing the use of animals in research. We tested whether the presence of 2D images of a female zebrafish (phenotypically altered by graphics software) could influence the so-cial behavior of this species. We examined whether in the absence of movement, the 2D images used as stimuli could generate a social response in zebrafish equivalent to that already documented for animated or real stimuli, since the actual effect has not been
Fig. 5. Results of the fourth behavioral test: cumulative duration of activ-ity in the arm with stimuli (mean±SD), same letter means “not statistically significant differences” (a); time spent in the arm with stimuli per entrance (mean±SD) (b); (*p<0.05).
Fig. 3. Results of the second behavioral test: cumu-lative duration of activity in the arm with stimuli (mean±SD) (a) and time spent in the arm with stimuli per entrance (mean±SD) (b); (*p<0.05).
Fig. 4. Results of the third behavioral test: maximum and minimum
accelera-tion (mean±SD) (a); cumulative
fully clarified. Regarding previous studies from this area of research, it was shown [22] that when an ar-tificial stimulus of a transparent plastic material with the shape and size of zebrafish, connected to a me-chanical instrument capable of generating coherent movements resembling the ethological characteris-tics of zebrafish, was used, no social responses were displayed. Although the movement alone cannot act as a “social attractor”, the question remains open and should be further explored.
In the first behavioral test, “big female vs. empty compartment” it was observed that there were no significant preferences, for both males and females, between the two-stimulus zones. The males, however, showed better performance in terms of maximum ac-celeration, as compared to females. This result is in disagreement with some results from the literature that previously showed the avoidance of an empty com-partment and preference for a comcom-partment with real conspecifics [17,23,24] or artificial stimuli [11,12,14]. According to one study [22], it seems that the absence of movement can diminish (or compromise) the social response induced by artificial stimulation.
In the second behavioral test, “big female vs. big red female”, females preferred the “big red female” area (for the cumulative duration) when compared to the other stimulus area, while males did not show signifi-cant preferences. In agreement with the hypothesis formulated by Delaney et al. [25], this result could be explained by the females attempt to avoid conspecifics of the same sex. Thus, individuals could have recog-nized the stimulus “big red female” as an individual belonging to another species. In addition, they could have been socially attracted to a female stimulus with a particularly intense coloration. In this way, accord-ing to the study of Saverino and Gerlai [13], males do not show significant preferences between the two-stimulus zones, unlike what we observed for females. In the third behavioral test, “big female - red vs. blue vs. green”, the females preferred the “big blue fe-male” and “big green fefe-male” stimuli to the “big red female”. Also, no significant preferences were observed in males even though, in comparison with the female sample, the males spent a significantly higher per-centage of time in the “big red female” area. These results are in agreement with the reported correlation between a stimulus with red and a wild-type color
[13]. Also, with regards to the sample of females, we could again hypothesize the choice for individuals with a phenotype (i.e. body color) as different as pos-sible from them, since female zebrafish will avoid the stimulus with the color red (although a different shade from the natural red color was used).
In the fourth behavioral test, “big female vs. 3 small females”, both males (cumulative duration and average) and females (cumulative duration) preferred the “big female” area. This result can be explained by the possible preference of the females for shoal-ing with larger female individuals (with potentially greater availability of resources, which could provide greater protection) as compared to the smaller ones. For males, however, we can hypothesize a choice for a larger and potentially more attractive partner.
CONCLUSION
have not been studied or that remain to be clarified. In this sense, the planning of studies and observations in the natural habitat of species could lead to a more complete and effective knowledge.
Funding: This study was financially supported by the Project Re-sources Pilot Center for cross-border preservation of the aquatic biodiversity of Prut River MIS-ETC 1150 Romania-Ukraine-Re-public of Moldova. C.A. is currently supported by a PN-III-P1-1.1-TE-2016-1210 grant offered by UEFISCDI, and by the grant “Developing innovation capacity and increasing the impact of excellence research at UAIC” funded by the Romanian Ministry of Research and Innovation through Program 1, Development of a National R & D System, subprogram 1.2 – Institutional Per-formance – Excellence Financing Projects in RDI, Contract no. 34PFE / 10.19.2018.
Author contributions: C.L. and S.A.S. developed the theory and performed the experiment. C.G. and A.C. verified the analytical methods and A.S. contributed to the interpretation of the results. M.N. and G.I.P. encouraged C.L. and S.A.S. to investigate this specific issue, provided research ideas related to it and supervised the obtained findings. All authors discussed the results and C.L., S.A.S., A.S. and A.C. wrote the final manuscript.
Conflict of interest disclosure: All authors declare that there are no conflicts of interest for this study, except the grants describe above.
REFERENCES
1. Hamilton F. An account of the fishes found in the river Ganges and its branches. Edinburgh & London: Archibald Constable and Co.; 1822. 405 p.
2. Robea MA, Strungaru SA, Lenzi C, Nicoara M, Ciobica A. The Importance of Rotenone in Generating Neurological and Psychiatric Features in Zebrafish - Relevance for a Par-kinson’s Disease Model. AOSR. 2018;7(1):59-67.
3. Lenzi C, Grasso C, Nicoara M, Savuca A, Ciobica A, Plavan GI, Strungaru SA. Influence of environmental colors and long-term sex isolation on zebrafish shoaling behavior. Arch Biol Sci. 2019;71(2):329-37.
4. Arunachalam M, Raja M, Vijayakumar C, Malaiammal P,
Mayden RL. Natural history of Zebrafish (Danio rerio) in
India. Zebrafish. 2013;10(1):1-14.
5. Spence R, Fatema MK, Ellis S, Ahmed ZF, Smith C. The diet, growth and recruitment of wild zebrafish (Danio rerio) in Bangladesh. J Fish Biol. 2007;71(1):304-9. 6. Woo KL, Rieucau G. From dummies to animations: a review
of computer-animated stimuli used in animal behavior stud-ies. Behav Ecol Sociobiol. 2011;65:1671-85.
7. Chouinard-Thuly L, Gierszewski S, Rosenthal GG, M Reader SM, Rieucau G, Woo KL, Gerlai R, Tedore C, Ingley SJ, Stowers JR, Frommen JG, Dolins FL, Witte K. Technical and conceptual considerations for using animated stimuli in studies of animal behavior. Curr Zool. 2017;63(1):5-19. 8. Scherer U, Godin JGJ, Scuett W. Validation of 2D-animated
pictures as an investigative tool in the behavioral sciences:
A case study with a West African cichlid fish, Pelvicachromis pulcher. Ethology. 2017;123:560-70.
9. Gerlai R. Social behaviour of zebrafish: From synthetic images to biological mechanism of shoaling. J Neurosci Methods. 2014;234:59-65.
10. Ladu F, Bartolini T. Panitz SG, Chiarotti F, Butail S, Macrì S, Porfiri M. Live predators, robots, and computer-animated images elicit differential avoidance responses in zebrafish. Zebrafish. 2015;12(3):205-14.
11. Qin M,Wong A,Seguin D, Robert Gerlai R. Induction of
Social Behavior in Zebrafish: Live Versus Computer Ani-mated Fish as Stimuli. Zebrafish. 2014;11(3):185-97. 12. Saverino C, Gerlai R. The social zebrafish: Behavioral
responses to conspecific, heterospecific, and computer ani-mated fish. Behav Brain Res. 2008;191(1):77-87.
13. Polverino G, Abaid N, Kopman V, Macrì S, Porfiri M. Zebrafish response to robotic fish: preference experiments on isolated individuals and small shoals. Bioins Biomim. 2012;7:036019.
14. Kopman V, Laut J, Polverino G, Porfiri M. Closed-loop con-trol of zebrafish response using a bioinspired robotic-fish in a preference test. J R Soc Interface. 2013;10(78):20120540. 15. Directive 2010/63/EU of the European Parliament and of the
Council of 22 September 2010 on the protection of animals used for scientific purposes. Offic J Eur Union. 2010;53:276 16. Etinger A, Lebron J, Palestis BG. Sex-assortative shoaling in
zebrafish (Danio rerio). Bios. 2009;80(4):153-8.
17. Noldus LPJJ, Spink AJ, Tegelenbosch RAJ. EthoVision: A versatile video tracking system for automation of behavioral experiments. Behav Res Meth Ins C. 2001;33(3):398-414. 18. Blaser R, Gerlai R. Behavioral phenotyping in zebrafish:
Comparison of three behavioral quantification methods. Behav Res Methods. 2006;38(3):456-69.
19. Spink AJ, Tegelenbosch RAJ, Buma MOS, Noldus LPJJ. The EthoVision video tracking system - A tool for behav-ioral phenotyping of transgenic mice. Physiol Behav. 2001;73(5):731-44.
20. Jaykaran C. “Mean ± SEM” or “Mean (SD)”? Indian J Phar-macol. 2010;42(5):329.
21. Ruberto T, Mwaffo V, Singh S, Neri D, Porfiri M. Zebraf-ish response to a robotic replica in three dimensions. R Soc Open Sci. 2016;3(10):160505.
22. Ruhl N, McRobert SP. The effect of sex and shoal
size on shoaling behaviour in Danio rerio. J Fish Biol.
2005;67(5):1318-26.
23. Snekser JL, Ruhl N, Bauer K, McRobert SP. The Influence of Sex and Phenotype on Shoaling Decisions in Zebrafish. IJCB. 2010;23:70-81.
24. Delaney M, Follet C, Ryan N, Hanney N, Lusk-Yablick J, Gerlach G. Social Interaction and Distribution of Female
Zebrafish (Danio rerio) in a Large Aquarium. Biol Bull.
2002;203(2):240-1.
Supplementary Material