ISSN: 2278-3369
International Journal of Advances in Management and Economics
Available online at:
www.managementjournal.info
RESEARCH ARTICLE
Trade relations between Guangdong Province and Hong Kong,
Macao and Taiwan in China
Li Lei*
International Business School, Jinan University, Qianshan, Zhuhai, Guangdong, China.
*Corresponding Author: Email: [email protected]
Abstract: In 2016, the total GDP of Guangdong Province was 795.125 billion yuan, ranking first in China's provinces and cities. In the 21st century, the globalization of the world economy and the regional economic integration have been deepening in the vertical direction. Regional economic and trade cooperation have increasingly become an important means for countries and regions to participate in international cooperation and competition and to maximize the interests of the country and region. From the perspective of the world and China, the trade cooperation between Guangdong and Hong Kong, Macao and Taiwan are essentially the result of “opening up” under the background of globalization, and also the regional cooperation between different economies within China. It is necessary to study the trade between Guangdong Province and Hong Kong, Macao and Taiwan. Based on the Guangdong Statistical Yearbook and SPSS software, this paper makes a simple modeling and time series analysis of trade data, and finds that there is a close relationship between Guangdong and Hong Kong, Macao and Taiwan regions, and provides constructive opinions for future trade development.
Keywords: Guangdong province, Hong Kong, Macao, Taiwan, Import and export, Time series analysis.
Article Received: 29 Oct. 2018 Revised: 07 Nov. 2018 Accepted: 24 Nov. 2018
Introduction
Guangdong Province has ranked the top position of China's GDP in various provinces and cities for many years and has become the most developed and promising region in mainland China. According to Keynesian theory, GDP consists mainly of household consumption (C), investment (I), government purchase expenditure (G) and net export (NX). Among them, net exports are composed of total exports minus total imports, which are an indispensable part of a country's economy.
In recent years, with the deepening of economic globalization and China's accession to the World Trade Organization in 2001, it is of special significance to study trade between countries and regions. Based on this background, this paper focuses on the trade analysis between Guangdong Province and Hong Kong, Macao and Taiwan to explore the economic and trade links of the most developed regions in China in the new
century. Regardless of economic or
geographical location, Guangdong Province, Hong Kong, Macao and Taiwan regions are
in a special position in China. For Guangdong Province and Hong Kong and Macao, geographically, Guangdong Province is located in the south of China, adjacent to Hong Kong and Macao on both sides of the Pearl River estuary, with convenient sea, land and air transportation conditions; economically, the Pearl River urban agglomeration has advanced global influence.
trade development between the two sides. Economically, Taiwan’s economy is highly developed and is known as “one of the four Asian dragons”. Since the 1960s, Taiwan's economy has developed into an export-oriented economic system of capitalism. International trade is the lifeline of Taiwan, and China is Taiwan's largest trading partner.
This article uses statistical data from 2000 to 2016 and uses SPSS software for analysis. The contributions are mainly in the following aspects: First, clearly show the trend of trade data from 2000 to 2016, based on this analysis we can know the specific reasons for changes in trade data since the new century. Second, based on the trade data of Hong Kong and Macao with Guangdong province, we use simple model to analyze the internal relationship between the Hong Kong and Macao economies, and proposing strategic recommendations for economic development between regions.
Third, for the analysis of trade data between Guangdong and Taiwan, not only it can promote the economic and trade development of both sides, but it has great significance for promoting national integration. Fourth, in the context of economic globalization, it provides constructive opinions for managers and the government, which has great
significance for economic and trade
development within the region.
Literature Review
This paper is based on Wei Xue [1] "SPSS Statistical Methods and Applications" and
the 2000-2016 Guangdong Statistical
Yearbook. The SPSS software method is used to analyze the relevant trade data of Guangdong, Hong Kong, Macao and Taiwan. In the previous study, Dr. Wang Peng [2] from the Institute of Economics of Hong Kong and Macao of the School of Economics of Jinan University (2009) put forward the idea of innovatively constructing the trade relationship between Guangdong, Hong Kong and Macao in the paper “Innovation Model and Construction Strategy of
Inter-Administrative Innovation System in
Guangdong, Hong Kong and Macao”. Scholar Fei Li [3] mentioned the trade issue between Taiwan and the mainland, especially Guangdong Province, in the "Overview of Taiwan's Economic Development."
In response to the economic and trade relations between Guangdong, Hong Kong and Macao, Xiaotian Pan [4] and Sijia Xie [5] proposed that the integration of Guangdong, Hong Kong and Macao is the general trend, and the liberalization of service trade between Guangdong, Hong Kong and Macao needs to be realized. Lijing Chen [6] and Jun Peng [7] conducted an economic analysis of the economic and trade cooperation between Guangdong, Hong Kong and Macao.
For Shenzhen and Hong Kong, Zhuhai and Macao, Wenling Chen et al [8], Hanrong Shi [9], and Zhenguo Hu [10] all studied the trade relationship between Shenzhen and Hong Kong, Zhuhai and Macao. And on the issue of international trade, Yifu Lin et al. [11] also showed the importance of international trade in the "International Trade Issues".
In response to the trade relationship between Guangdong and Taiwan, Zhentao Liu et al. [12] conducted a discussion on the objectives of the characteristic economic cooperation mechanism between the two sides of the strait, especially the economic and trade relations between Guangdong and Taiwan.
In the paper "Research on Trade Relations between China, Taiwan and Hong Kong", Juan Lin [13] also discussed the economic and trade relations between mainland China, especially Guangdong Province and Taiwan. Renxiang Lu [14] also conducted research on the trade relations between the two sides of the Taiwan Straits and obtained the results of empirical analysis.
Guangdong, Hong Kong, Macao and Taiwan are in a special geographical location in China. Studying the trade relationship between them will be very beneficial to China's economic development and can play a leading role in the process of regional economic integration.
Simple Time Series Analysis of the
Total Imports and Exports of
Guangdong Province in Recent
Years.
The total import and export volume are the
total import value plus the total export value, and the trade balance is the total export value minus the total import value.
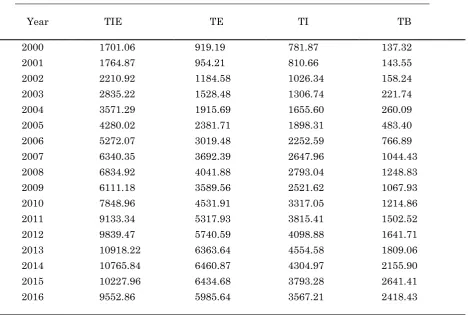
Table 1: Total Imports and Exports of Guangdong Province from 2000 to 2016
Unit: 100 million US dollars
Year TIE TE TI TB
2000 1701.06 919.19 781.87 137.32 2001 1764.87 954.21 810.66 143.55 2002 2210.92 1184.58 1026.34 158.24 2003 2835.22 1528.48 1306.74 221.74 2004 3571.29 1915.69 1655.60 260.09 2005 4280.02 2381.71 1898.31 483.40 2006 5272.07 3019.48 2252.59 766.89 2007 6340.35 3692.39 2647.96 1044.43 2008 6834.92 4041.88 2793.04 1248.83 2009 6111.18 3589.56 2521.62 1067.93 2010 7848.96 4531.91 3317.05 1214.86 2011 9133.34 5317.93 3815.41 1502.52 2012 9839.47 5740.59 4098.88 1641.71 2013 10918.22 6363.64 4554.58 1809.06 2014 10765.84 6460.87 4304.97 2155.90 2015 10227.96 6434.68 3793.28 2641.41 2016 9552.86 5985.64 3567.21 2418.43
Source: Guangdong Statistical Yearbook 2000-2016
TIE represents the total import and export volume, TE represents the total export value, TI represents the total import value, and TB represents the net export difference
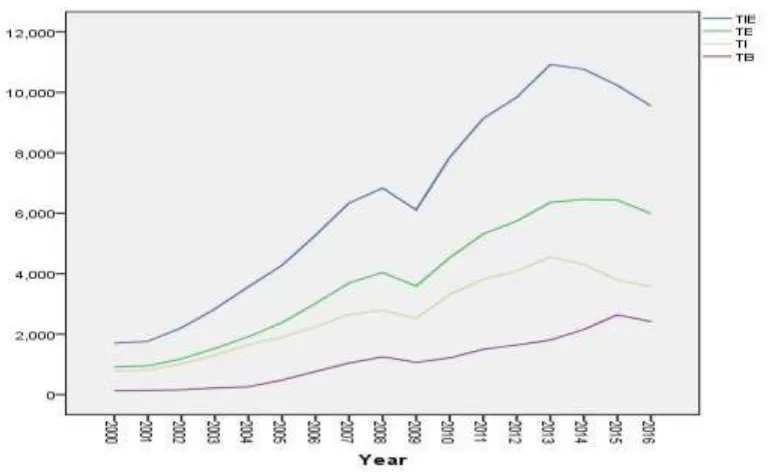
From the data in Table 1, using SPSS software for simple time series analysis, and the total import and export volume, total export value, total import value, and trade balance of Guangdong Province are shown in Figure 1.
From the analysis of Figure 1, it can be seen that the total import and export volume, total exports, total imports, and trade balance of Guangdong Province in 2000-2008 showed a clear upward trend, and then in 2009, these four indicators showed a downward trend. The reason for the analysis is obviously due to the financial crisis of 2008. The financial crisis has affected the global economic changes. Although the impact on China's economy was small at the time, it still suffered a big blow in the trade, which was obviously reflected in the downward trend of trade data between Guangdong, Hong Kong, Macao and Taiwan. From 2009 to 2013, the above four indicators related to trade have shown a clear upward trend.
This is due to the global economic recovery and the increasing performance of China's national strength.
The trade between Guangdong Province and Hong Kong, Macao and Taiwan have been evidently strengthened. From 2013 to 2016, the relevant data has a small downward trend. This is mainly because China's economic development has begun to slow down, focus on quality, and no longer pursue the quantity performance, so the relevant indicators have a downward trend.
In general, the above four indicators showed a clear upward trend with time, although there was a small decline.
This represents that the sequence is a non-stationary sequence.
Figure 1: Sequence diagram of relevant trade data of Guangdong Province
Trade Analysis between Guangdong Province and Hong Kong, Macao and Taiwan
Guangdong Province and Hong Kong, Macao and Taiwan are in a special geographical location. As the region with the most prosperous economy, the most developed technology and the most concentrated population in southern China, it is of great significance to study the trade between Guangdong Province and Hong Kong, Macao and Taiwan. With Guangdong as the axis, it
radiates to Hong Kong, Macao and Taiwan, and studies with this kind of thinking, mainly with Guangdong Province as the core, can not only promote the economic and trade growth of Guangdong Province, but also promote economic and trade cooperation with Hong Kong, Macao and Taiwan.
Table 2 below is the trade data of Guangdong Province with Hong Kong, Macao and Taiwan from 2000 to 2016. It mainly includes the total import and export volume, total export volume and total import volume.
Table 2: Relevant trade data of Guangdong Province with Hong Kong, Macao and Taiwan
Unit: 100 million US dollars
Trade with Hong Kong Trade with Macao Trade with Taiwan
Year TIE TE TI TIE TE TI TIE TE TI
2000 367.80 315.30 52.50 6.60 5.75 0.85 168.79 17.51 151.28
2001 387.76 336.83 50.93 7.18 6.14 1.04 170.52 17.28 153.24
2002 476.15 423.86 52.29 8.78 7.42 1.36 220.13 21.49 198.64
2003 592.54 538.58 53.96 12.36 10.58 1.78 255.56 25.24 230.32
2005 899.10 837.22 61.88 15.27 12.89 2.38 344.02 35.38 308.64
2006 1125.96 1072.48 53.48 19.97 17.49 2.48 394.12 43.76 350.36
2007 1363.72 1299.29 64.43 23.91 21.22 2.69 445.23 46.54 398.69
2008 1399.70 1338.71 60.99 22.19 19.23 2.96 438.03 48.53 389.50
2009 1199.09 1159.40 39.69 16.08 13.73 2.35 385.83 40.39 345.44
2010 1587.59 1527.86 59.74 16.21 15.11 1.10 496.15 57.72 438.43
2011 1932.66 1870.52 62.14 17.73 16.37 1.36 523.35 74.90 448.45
2012 2276.48 2199.60 76.88 18.82 16.48 2.34 586.32 72.61 513.71
2013 2687.70 2621.97 65.73 21.37 17.63 3.75 752.71 80.61 672.10
2014 2352.24 2293.69 58.55 22.53 20.64 1.89 638.54 78.28 560.26
2015 2097.80 2051.55 46.24 23.24 21.63 1.61 606.19 73.87 532.32
2016 1856.82 1814.56 42.26 20.59 19.43 1.16 597.50 71.11 526.39
Source: Guangdong Statistical Yearbook 2000-2016
TIE represents the total import and export volume, TE represents the total export value, TI represents the total import value, and TB represents the net export difference.
Trade Analysis between Guangdong Province and Hong Kong and Macao
On March 10, 2015, the State Council issued a document stating that Guangdong, Hong Kong and Macao will sign a service trade liberalization agreement. The main purpose is to reform and innovate the management cooperation mode of Hong Kong and Macao service providers in the investment and trade sector in Guangdong Province, so as to expand the service industry.
On the basis of free trade in kind, this article focuses on the importance of free trade in services, and historically promotes trade relations between Guangdong and Hong Kong and Macao. And it also promotes regional integration in the Pearl River Delta, and promotes regional economic prosperity. Therefore, studying the trade relationship between Guangdong Province and Hong Kong and Macao will be of great significance
Sequence Diagram Analysis of Trade Data between Guangdong Province and Hong Kong and Macao
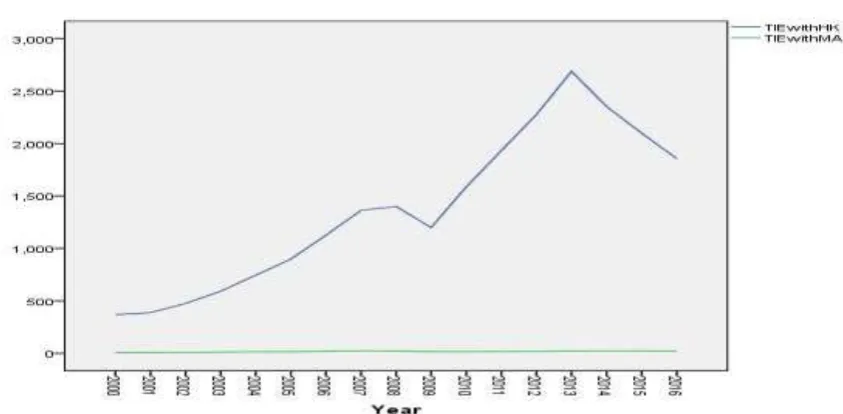
From the data in Table 2 above, using SPSS software for simple time series analysis, as a
time series chart of data related to import and export of Guangdong Province and Hong Kong and Macao, which can be seen from Figure 2 below.
As can be seen from Figure 2, the total import and export data between Guangdong Province and Hong Kong is larger than the total import and export data between Guangdong Province and Macao. This is because Hong Kong's economy is more prosperous than Macao and the economic focus of Hong Kong and Macao is different.
At the same time, the laws presented by Guangdong Province in its trade with Hong Kong are generally consistent with the laws shown in Figure 1 above. Because the trade data with Macao is small, the time series chart shown in the figure is relatively flat and the data itself is not large.
However, Guangdong, Hong Kong and Macao are both in the Pearl River Delta urban agglomeration, and their development will not be able to break away from Macao. Therefore, under the conditions of trade
liberalization, we should focus on
Guangdong, Hong Kong and Macao and promoting common economic prosperity.
Figure 2: Time series of trade transactions of Hong Kong and Macao
Analysis of Simple Regression Model Based on Trade Data between Guangdong, Hong Kong and Macao
From the above data, we have to think about whether there exists economic relationship between Hong Kong and Macao. Hong Kong and Macao belong to the Pearl River Delta and have synergies in economic development. With the development of Hong Kong's economy, Macao's economy will also be upgraded. Therefore, we put forward our hypothesis:Hypothesis: The trade between Guangdong Province and Hong Kong will
drive the trade between Guangdong Province
and Macao, that is, the economic
development of Macao depends on the development of Hong Kong's economy.
Based on the hypothesis, we make a simple regression model analysis to confirm this relationship. First of all, based on the data in Table 2, we use SPSS software to draw a scatter plot, as shown in Figure 3:
Figure 3: Scatter plot of trade data
From the results of linear fitting in Figure 3, the total import and export data of Guangdong Province with Hong Kong is proportional to the total import and export data of Guangdong Province with Macao.
Guangdong and Macao. Therefore, a simple
regression analysis is performed on the above data, and the result are as shown in Tables 3.
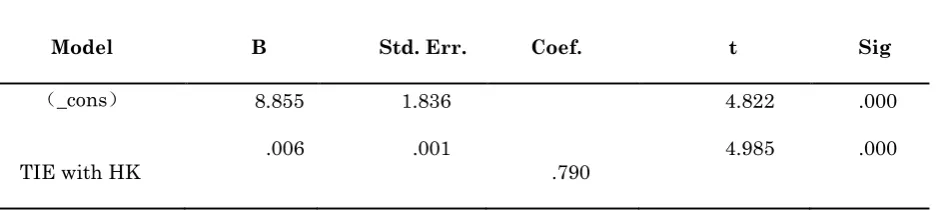
Table 3: Regression coefficient table
Model B Std. Err. Coef. t Sig
(_cons) 8.855 1.836 4.822 .000
TIE with HK .006 .001 .790 4.985 .000
From Tables 3, the standardized regression coefficient of the model is 0.790, which means that the change in the total import and export data of Guangdong Province with Hong Kong corresponds to a change of 0.790 units in the total import and export data of Guangdong Province with Macao. And from Figure 3, the actual data points are roughly walked around the model line, indicating that the model is considerably accurate in reflecting the relationship.
From the comprehensive analysis, it can be seen that there is a certain relationship between the total import and export data of Guangdong Province with Hong Kong and the total import and export data of Guangdong Province with Macao, and this relationship shows a relatively simple linear relationship through model fitting. This confirms our hypothesis.
But why is this happening? The reason may be because Macao and Hong Kong are two special administrative regions of China. During the operation of the Macao economy, Hong Kong's economic played a very important role in the development of the Macao economy. For historical reasons, before Macao returned to China, the economic ties between Macao and Hong Kong were already very close. After 1960, the Macao economy began to develop rapidly due to the catalytic role of Hong Kong factors.
The main performance is that during this period, investment centers in Europe and the United States began to gradually transfer to Macao, rather than more concentrated in Hong Kong. At the same time, the major capitalist countries in the West have slowly begun to restrict the development of Hong Kong's manufacturing industry, mainly by restricting Hong Kong's imports.
This has greatly hindered the development of Hong Kong's economy. Therefore, Hong Kong has to find another way to seek cooperation with the Chinese mainland.
The Macao economy has developed and Hong Kong has begun to seek cooperation with the mainland, especially trade cooperation with Guangdong Province. Therefore, the trade between Hong Kong and Guangdong Province began to slowly build up, and because of the inter-regional cooperation, Macao also began to establish trade cooperation with Guangdong Province. Therefore, based on the above reasons, there is a clear linear relationship between the relevant trade data between Hong Kong, Macao and Guangdong Province.
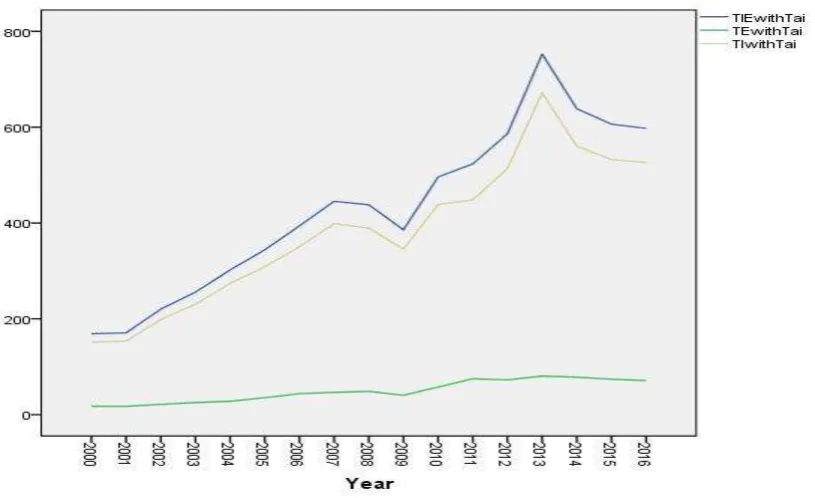
Trade Analysis between Guangdong Province and Taiwan
Taiwan has belonged to China since ancient times and is an inalienable territory of China. When China joined the WTO in 2001, China began to adapt to the trend of global
economic and trade integration,
concentrating on opening up to the outside world and deepening economic and trade cooperation in various regions. Economic and trade cooperation between China's regions is getting closer and closer, the most important of which is trade between China and Taiwan.
From the data in Table 2 above, using SPSS
software for simple time series analysis, which can be seen in Figure 4:
Figure 4: Sequence analysis of relevant trade data between Guangdong Province and Taiwan
From the above sequence diagram analysis, it can be seen that the total import and export volume and total import volume showed a significant upward trend from 2000 to 2008, and then in 2009, both indicators showed a downward trend. The reason for the analysis is obviously due to the financial crisis of 2008.
The financial crisis affected the global economic changes. Although it had little impact on the Chinese economy at that time, it still suffered a big blow in the trade, which was clearly reflected in the decline in relevant trade data between Guangdong Province and Taiwan. From 2009 to 2013, the total import and export volume between Guangdong Province and Taiwan and the total import volume have shown a clear upward trend.
This is due to the global economic recovery and the increasing performance of China's national strength. From 2013 to 2016, the above two indicators have a small downward trend. This is mainly because China's economic development has begun to slow down, focus on quality, and no longer pursue the performance of quantity, so the relevant indicators have a downward trend. At the same time, as China has gradually become
the world's second largest economy, the trade between Guangdong Province and Taiwan has gradually approached the threshold, and all aspects have been fully developed. This has inspired trade-related personnel to open up new trade field, improve the quality and find more effective methods in subsequent trade.
It is also seen from Figure 4 that the total export value of Guangdong province with Taiwan is significantly smaller than the total imports, so the detailed export chart in the figure is relatively flat. The reason for this analysis is that Taiwan’s economy, which is regarded as one of the four Asian tigers, is more developed than Guangdong Province. Due to Taiwan’s low import demand for Guangdong Province, Guangdong’s exports to Taiwan are relatively small.
In general, the above indicators showed a clear upward trend over time. Although there was a small decrease, it also represented that the sequence was a non-stationary sequence.
Strategic Suggestions for the Development of Trade Cooperation between Guangdong, Hong Kong and Macao
Guangdong, Hong Kong and Macao are an indispensable economic belt for China.
Studying the trade links between
Guangdong, Hong Kong and Macao is of great significance to promoting the economic prosperity of the economic belt. Moreover, Guangdong Province has also proposed a strategic concept of creating a “Guangdong, Hong Kong and Macao Special Cooperation Zone”, which will promote the flow of factors between Guangdong, Hong Kong and Macao and increase cross-border exchanges.
We can promote trade development in the following ways: The first is institutional innovation to accelerate the pattern of innovative cooperative trade, promote trade
development and promote economic
prosperity.
To achieve institutional innovation, we must transform from functional integration to institutional integration, promoting economic integration between Guangdong, Hong Kong and Macao. Then, we will build a regional trade innovation system, realize trade cooperation across administrative regions, increase trade choices and promote regional financial cooperation between Guangdong, Hong Kong and Macao.
Strategic Suggestions for the
Development of Trade Cooperation between Guangdong and Taiwan
The development of trade cooperation between Guangdong and Taiwan is crucial. This will not only promote economic prosperity and increase trade links between Guangdong and Taiwan, but also promote ethnic integration. In order to deepen the economic and trade cooperation between Guangdong and Taiwan, we can propose new strategic suggestions from the following aspects:
First of all, it is necessary to strengthen the cooperation between the two parties and establish a mechanism of mutual trust, so as to create a good political premise for trade
cooperation between Guangdong and
Taiwan; Second, we must build an economic
common market. Through the economic common market, the mainland and Taiwan will eliminate various obstacles in economic exchanges and development. Finally, we should build economic integration zones on the west coast of the Taiwan Straits, especially between Guangdong Province and Taiwan.
Discussion and Conclusion
In the 21st century, from the perspective of the domestic economic situation and the development of the international economic situation, the economic and trade cooperation between Guangdong, Hong Kong, Macao and Taiwan is particularly important in the new era, and the prospects for cooperation are far beyond people's imagination. Due to regional economic integration and in today's globalized economic conditions, we must deal with trade relationship between Guangdong Province and Hong Kong, Macao and Taiwan.
Based on the SPSS software and statistical yearbook of Guangdong Province from 2000 to 2016, this paper conducts a simple time series analysis of relevant trade data between Guangdong Province and Hong Kong, Macao and Taiwan. Moreover, the simple regression model was conducted to analyze the relationship between the Macao economy and the Hong Kong economy.
This paper finds: First, from 2000 to 2016, the trade data between Guangdong, Hong Kong, Macao and Taiwan has a clear trend of time. According to its time series chart, this paper summarizes the specific reasons for this change. Second, we made a simple regression model, it was found that the trade volume between Guangdong Province and Hong Kong would have a positive impact on the trade volume between Guangdong Province and Macao.
The contributions of this paper are mainly reflected in the following aspects: First, because of the analysis of the changes in time series, this has a guiding effect on the trade trends after our research; Secondly, it has great enlightenment for guiding the trade between Guangdong, Hong Kong, Macao and Taiwan. In particular, Macao's economic and trade development relies heavily on Hong Kong's economic and trade development.
Finally, we have put forward some constructive strategic suggestions, which have a certain guiding role when the government formulates policies. At the same time, according to these recommendations, the degree of integration between regions will continue to deepen and the integration between ethnic groups will be further strengthened [15-20].
References
1.Wei Xue (2013) SPSS statistical analysis method and application [M]. Publishing House of Electronics Industry, (11).
2.Peng Wang (2009) Innovation Model and Construction Strategy of Cross-administrative Regional Innovation System in Guangdong, Hong Kong and Macao [J]. Institute of Economics, Jinan University, Hong Kong and Macao Economic Research Institute, (1).
3.Fei Li. General Theory of Taiwan's Economic Development [M]. Kyushu Publishing House, 2004.
4.Xiaotian Pan (2012) The integration of Guangdong, Hong Kong and Macao is the trend of the times [N]. People's Daily Overseas Edition, 11-11(003).
5.Sijia Xie, Xin Fu (2014)The liberalization of service trade between Guangdong and Macao at the end of the year [N]. Nanfang Daily, 07-17.
6.Lijing Chen.[2012] Analysis of CEPA Economic Effects of Hong Kong and Mainland Service Trade Cooperation. China Business, (17).
7.Jun Peng. Analysis on the Bottleneck and Deepening Strategy of Economic Cooperation between Guangdong, Hong Kong and Macao[J]. Modern Marketing (Late), 2018(02).
8.Wenling Chen, Fei Wang, Jiangui Wang (2009) Thoughts and Countermeasures for Giving Full Play to Hong Kong's Advantages under the New Situation[J]. Macroeconomic Research, (11): 9-14.
9.Hanrong Shi (2004)Guangdong, Hong Kong and Macao Economic Zone in the tide of globalization [M]. Macau Global Culture Communication Co., Ltd..
10. Zhenguo H (2005) New Trends in Shenzhen-Hong Kong Cooperation[J]. China Economic Publishing House.
11. Yifu Lin, Qiulin Yi (2006) International Trade Issues [M], 2006 (02).
12. Zhentao Liu, Hualei Wang (2009) Discussion on the objectives of cross-strait economic cooperation mechanism[J]. International Economic Review, (05).
13. Juan Lin (2012) Research on Trade Relations between Mainland China, Taiwan and Hong Kong [D]. Southwestern University of Finance and Economics.
14. Renxiang Lu (2012) Research on Cross-Strait Trade Relations-An Empirical Analysis Based on Trade Data from 1979 to 2007, (10).
15. Yanhua Chen, Suqiong Wei (2007) An Empirical Study on the Industrial Isomorphism of the Economic Zone on the West Coast of the Taiwan Straits and the Yangtze River Delta and the Pearl River Delta Economic Zone[J], Tropical Geography, (01).
16. Yugao Chen (2006) Regional Economic Integration under the Condition of Globalization [M]. China Financial and Economic Publishing House.
17. National Day Editor-in-Chief. Hong Kong-Shenzhen Economic Integration [M]. People's Publishing House, 2005.
18. Shoukai Wan, Bin Xia. Research on the formation factors and integrated development direction of the Pearl River Delta Economic Zone[J]. Reform and Strategy, 2007(12).
19. Guisheng Wu. Regional Science and Technology Theory [M]. Tsinghua University Press, 2007.