advances.sciencemag.org/cgi/content/full/7/2/eabc7323/DC1
Supplementary Materials for
Amorphization mechanism of SrIrO
3electrocatalyst: How oxygen redox initiates
ionic diffusion and structural reorganization
Gang Wan, John W. Freeland, Jan Kloppenburg, Guido Petretto, Jocienne N. Nelson, Ding-Yuan Kuo, Cheng-Jun Sun, Jianguo Wen, J. Trey Diulus, Gregory S. Herman, Yongqi Dong, Ronghui Kou, Jingying Sun, Shuo Chen, Kyle M. Shen, Darrell G. Schlom, Gian-Marco Rignanese, Geoffroy Hautier, Dillon D. Fong*, Zhenxing Feng*, Hua Zhou*, Jin Suntivich*
*Corresponding author. Email: [email protected] (D.D.F.); [email protected] (Z.F.); [email protected] (H.Z.); [email protected] (J. Suntivich)
Published 8 January 2021, Sci. Adv. 7, eabc7323 (2021) DOI: 10.1126/sciadv.abc7323
The PDF file includes:
Sections S1 to S7 Figs. S1 to S14 Tables S1 to S3
Other Supplementary Material for this manuscript includes the following:
(available at advances.sciencemag.org/cgi/content/full/7/2/eabc7323/DC1) Structure file for amorphous IrO2 with 96 atoms (1)
Structure file for amorphous IrO2 with 96 atoms (2) Structure file for amorphous IrO2 with 192 atoms
Section 1. Electrochemical Measurements
Fig. S1. Electrochemical cycling of SrIrO3.OER of a SrIrO3 film grown on DyScO3 was
recorded at a scan rate of 5 mV/s in 0.1 M HClO4 purged with Ar. The results are shown for
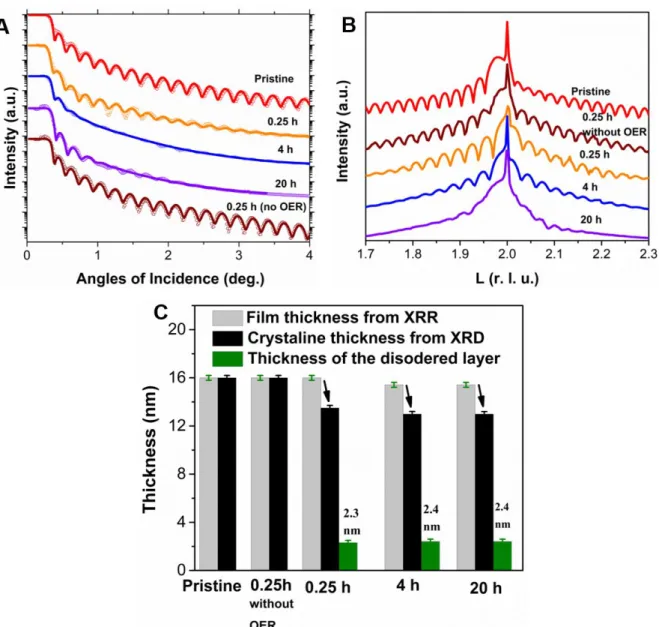
Fig. S2. XRR and XRD of the pristine and cycled SrIrO3. (A) X-ray reflectivity (XRR, data
and fitting curves, black and colored), (B) X-ray diffraction (XRD), and (C) the extracted
thickness of the total film, the crystalline layer, and the amorphous layer of the the SrIrO3 film
in the pristine state and after 0.25 h, 4 h, and 20 h of potential cycling between 1.05 – 1.75 V vs. RHE, and after 0.25 h of potential cycling between 0.8 – 1 V vs. RHE.
SrIrO3 Conditions
Fitting Parameters
Prisitine No OER 0.25 h 4 h 20 h
Total SrIrO3 Film
Thickness dt
16.0 ± 0.1 nm
16.1 ± 0.1 nm
15.8 ± 0.4 nm
15.4 ± 0.5 nm
15.3 ± 0.5 nm Surface SrIrOx
Amorphized Layer Thickness da
2.3 ± 0.3 nm
2.4 ± 0.4 nm
2.4 ± 0.4 nm Crystalline SrIrO3-δ
Bottom Layer Thickness dc
13.5 ± 0.3 nm
13.0 ± 0.4 nm
12.9 ± 0.4 nm DyScO3 Substrate and
Film Interfacial Roughness σI
0.05 ± 0.04 nm
0.11 ± 0.02 nm
0.32 ± 0.04 nm
1.50 ± 0.11 nm
1.20 ± 0.08 nm Amorphized and
Crsytalline Layer Interfacial Roughness σII
0.86 ± 0.18 nm
0.31 ± 0.25 nm
1.46 ± 0.33 nm SrIrOx Film Surface
Roguhenssσs
0.16 ± 0.02 nm
0.16 ± 0.01 nm
0.11 ± 0.02 nm
0.19 ± 0.01 nm
0.16 ± 0.03 nm XRR Layer Models One Layer One Layer Two Layers Two Layers Two Layers
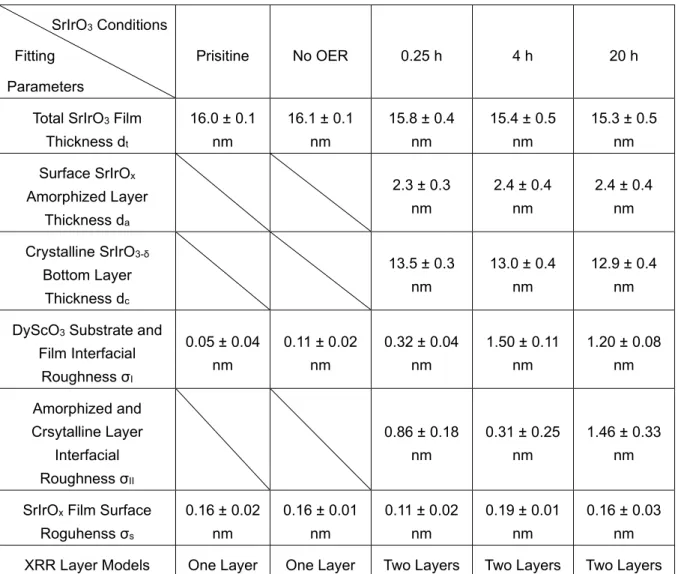
Table S1.XRR experimental fitting parameters and error bars
The synchrotron-based high resolution XRR of the series of SrIrO3/DyScO3 films under
different conditions are anlyazed and fitted by XRR fitting open source software MOTOFIT
(http://motofit.sourceforge.net/, Nelson J. Appl. Cryst. 2006, 39, 273-276). The XRR data and
fitting results is shown in Fig. S2A and Table S1 that includes the layer thickness (e.g. amorphized surface layer and crystalline bottom film layer), respective interfacial roughness and experimental errors for each fitted quantity. For simplicity, the error bar of each thickness obtained from our fitting is used in single digit precision like ± 0.X nm, and the error bar of each roughness obtained from our fitting is used in double digit precision like ± 0.XX nm. For
the prisitine and no OER conditions of SrIrO3, an one crystalline layer model is adopted due to
the high structural integrity and smoothness without the OER induced amorphization. For the post OER conditions (including 0.25 h, 4 h and 20 h conditions), a two-layer model is adopted due to the surface amrophization and increased roughness at each interface as a result of the OER induced structural reorganization.
Section 2. XPS of pristine and cycled SrIrO
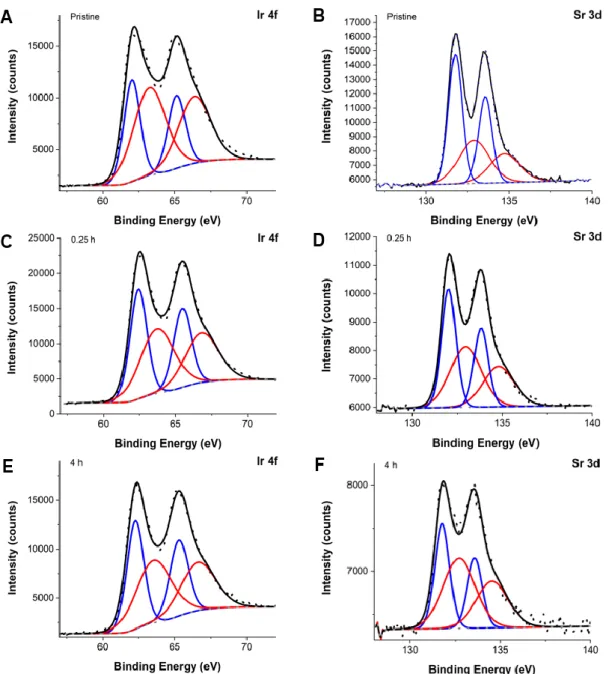
3Fig. S3. The XPS spectra of the pristine SrIrO3 catalyst, after 0.25 h of cycling, and after
Fig. S4. The high resolution Ir 4f and Sr 3d XPS spectra of pristine SrIrO3 catalyst (A, B),
after 0.25 h of cycling (C, D), and after 4 h of cycling (E, F).
Sr (at. %) Ir (at. %)
Pristine 19.7 ± 0.6 19.5 ± 0.6
After 0.25 h of cycling 8.1 ± 0.3 18.4 ± 0.5
After 4 h of cycling 3.6 ± 0.2 16.5 ± 0.5
Table S2. XPS determined Sr and Ir surface compositions with experimental errors for the pristine SrIrO3, after 0.25 h and 4 h of potential cycling.
Section 3. Ir L
Ⅲ-edge GI-XANES of pristine and cycled SrIrO
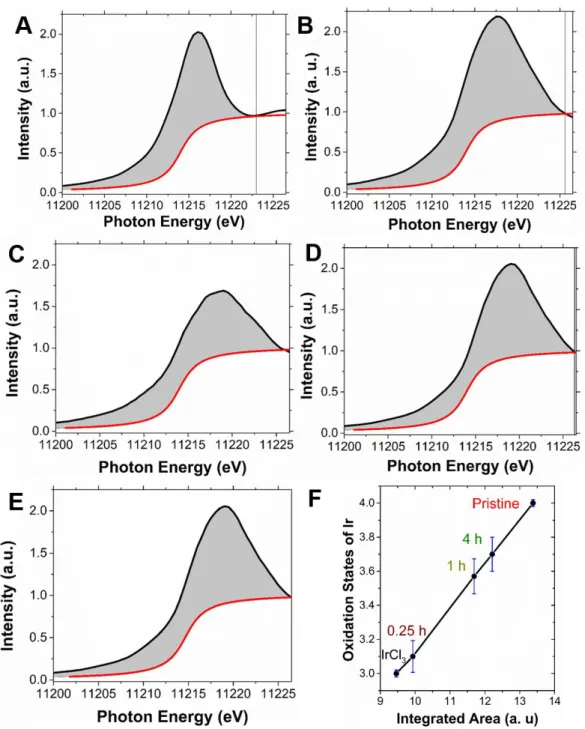
3Fig. S5. Analysis of the Ir LⅢ-edge GI-XANES. The black lines show the experimental
spectra, and the red lines show the used baseline correction for (A) IrCl3,(B) pristine SrIrO3,
(C) SrIrO3 after 0.25 h cycling, (D) 1h, and (E) 4h. (F) The formal oxidation state of Ir after
different cycling times. The formal oxidation state information was determined based on the
linear relationship of the integrated area (grey areas) and the oxidation states of pristine SrIrO3
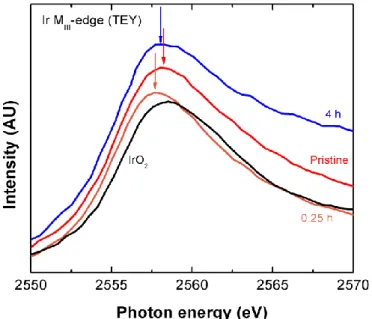
Fig. S6. The surface-sensitive Ir MⅢ-edge XANES of IrO2, pristine SrIrO3, SrIrO3 after
Section 4. Ir L
Ⅲ-edge XANES of pristine and cycled SrIrO
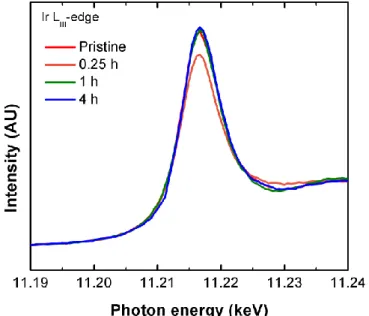
3Fig. S7. The bulk sensitive Ir LⅢ-edge XANES of pristine SrIrO3, SrIrO3 after 0.25 h, 1h,
and 4h of cycling. When an incidence angle of 45° is used, the XANES experiment probes the
whole SrIrO3 film. Except at the 0.25 h time point, the bulk average Ir formal oxidation does
not change after OER cycling, indicating coupled Sr2+ and O2– diffusion, i.e., the loss of Sr and
Section 5. Ir L
Ⅲ-edge GI-EXAFS of pristine and cycled SrIrO
3Fig. S8. The k-range fitting results of Ir LⅢ-edge EXAFSfor (A) pristine SrIrO3, (B)
SrIrO3 after 0.25 h of cycling, (C) 1h, and (D) 4h. The wavenumber ranged used for fitting is defined by the window curves in all figures.
We determine an S02 value (the amplitude parameter) of 0.84 as the best match for pristine
SrIrO3 (using six coordination oxygen atoms around Ir center). We keep this value for the
XAFS fit.In the polarization-dependent measurement at the APS 20-ID-C station (for the
out-of-plane measurement), four oxygens in the measurement plane gives 100% effective contribution, while the top and bottom O with 90 degree perspective to the centered Ir have zero contribution. This is due to the polarization dependence of the grazing incidence X-ray spectroscopy measurement.
1 Fitting results from the in-plane Ir-O contribution;
2 Fitting results from theout-of-plane Ir-O contribution;
The total coordination contains both in-plane and out-of-plane Ir-O.
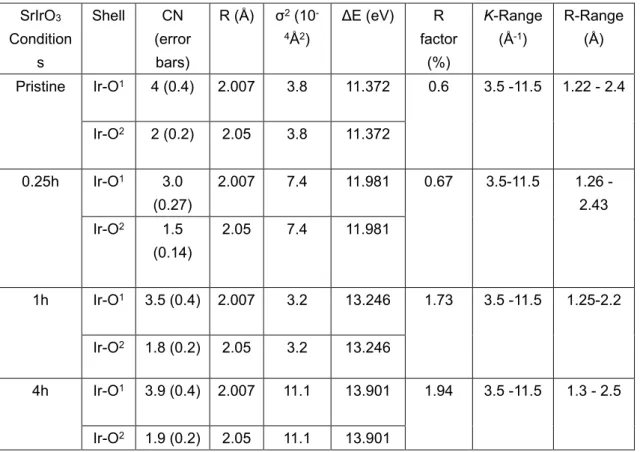
Table S3. Structural parameters of SrIrO3 obtained using EXAFS including the Average
coordination number (CN), Path Distance (R), Debye−Waller Factor (σ2), Threshold
Energy Correction (ΔE), K-Space Range for Fourier Transform (K-Range) and R-Space Range for Fitting (R-Range), and the R-Factor of the Fitting.
SrIrO3
Condition s
Shell CN
(error bars)
R (Å) σ2 (10 -4Å2)
ΔE (eV) R
factor (%)
K-Range (Å-1)
R-Range (Å) Pristine Ir-O1 4 (0.4) 2.007 3.8 11.372 0.6 3.5 -11.5 1.22 - 2.4
Ir-O2 2 (0.2) 2.05 3.8 11.372
0.25h Ir-O1 3.0
(0.27)
2.007 7.4 11.981 0.67 3.5-11.5 1.26 -
2.43 Ir-O2 1.5
(0.14)
2.05 7.4 11.981
1h Ir-O1 3.5 (0.4) 2.007 3.2 13.246 1.73 3.5 -11.5 1.25-2.2
Ir-O2 1.8 (0.2) 2.05 3.2 13.246
4h Ir-O1 3.9 (0.4) 2.007 11.1 13.901 1.94 3.5 -11.5 1.3 - 2.5
Section 6. O K-edge NEXAFS of cycled SrIrO
3Fig. S9. The O K-edge XANES of SrIrO3 after 4h of cycling via bulk-sensitive TFY and
surface-sensitive TEY mode. We observe the reduced pre-edge signal only in the surface-sensitive TEY mode. The O K-edge pre-edge feature contains structural information regarding
the amorphous IrOx layer at the surface.
Fig. S10. The O K-edge XANES of IrO2, pristine SrIrO3, and SrIrO3 cycled for 0.25h and
Section 7. First-Principles Calculation Results
7.1. Computed dissolution driving force and energy barrier for O and Sr migration
We used DFT-GGA-PBE to evaluate the free energy of dissolution for SrIrO3 through the
reaction SrIrO3 + 2H+ → IrO2 + Sr2+ + H2O. The ion energies have been extracted from
experimental data following the approach of Persson et al. (41) The computed reaction energy
is –2.2 eV at the pH = 0 condition, indicating a strong driving force for dissolution. While this process is favored thermodynamically, the migration energetics of Sr and O displays a varied behavior depending on the amount of oxygen present in the system. To quantify this effect DFT-PBE computations using the climbing image nudge elastic band (CI-NEB) were
performed and converged until the total energy change and the forces were less than 10-5 eV
and 0.05 eV/Å. Different migration paths considered in a pristine SrIrO3 supercell with 160
atoms show very different activation energies for Sr (3.0 eV) and O (1.9 eV). However, the barrier for Sr decreases considerably just by removing one or two of the oxygens around its path (2.7 eV and 2.25 eV, respectively). Inspecting structures with even lower oxygen
concentration, in particular the most stable square planar Sr0.5IrO2 structure that was considered
in this study (see Section 7.2 and Fig.S11), it was observed that the activation energy for Sr
can drop to 1.9 eV, the same value as O in pristine SrIrO3. This further supports the hypotesis
that oxygen deficiency strongly faciliates strontium migration.
Figure S11. Graphical representation of the migration paths considered and their barriers, obtained trough CI-NEB simulations. Green, gold and red spheres represent Sr, Ir and O atoms, respectively. Light green spheres indicate the position of the vacancy where the
Sr atoms migrate. Orange atoms in (B) identify the oxygen vacancies that are introduced for Sr
migration. (A) and (C) show the migration barrier for O and Sr migration in SrIrO3, respectively.
The Sr migration path for the square planar Sr0.5IrO2 structure, depicted in (D), passes through
a local minimum. The barrier has been calculated splitting the path in two almost equivalent
steps, corresponding to the two blue arrows. (E) represents the calculated barrier for the first
7.2. Evidence for the preference of the square-planar local environment for Ir3+
Starting from the SrIrO3 structure, we have generated a series of structures by removing oxygen
and strontium to form Sr0.5Ir3+O2 structures (in order to match the XANES and EXAFS results).
The removal of oxygen can lead to a tetrahedral (as in the brownmillerite structures) or square
planar (as in square planar SrFeO2) (44) local environment for Ir3+ depending on which oxygen
atoms are removed. Fig.S12 shows the generated structures and their energies with respect to
the lowest-energy structure. Our computations indicate that the lowest energy structures are the ones forming square planar iridium and that structures with (distorted) tetrahedra are less favorable energetically (over 100 meV/atoms higher in energy).
Fig. S12. Tetrahedral and square planar Sr0.5IrO2 structures generated by removing
strontium and oxygen from the SrIrO3 perovskite structure. The lowest energy structures were found to be the structure forming square planar iridium.
7.3. IrO2 polymorphs stability and O K-edge analysis
We computed the energies of various IrO2 polymorphs using the structure library from 273
MOx known polymorphs from the Materials Project. We compared the DFT-computed energies
to rutile IrO2. We find the most stable Ir4+ polymorphs are the ones containing Ir4+ octahedral
geometries, with rutile as the lowest-energy structure. Fig.S13 shows the five lowest energy
structures: brookite, hollandite, romanechite, anatase, and rutile. Using the hypothesis that
these structures represent the structure of the amorphous IrOx at the local level, we computed
the corresponding O K-edge spectra on each of these IrO2 structures. We note that we are not
seeking perfect agreement with experiment in this calculation, as we are not aiming to solve
the structure of the amorphous IrOx phase. Instead, we look for structural features in the
crystalline phases that could lead to similar O K-edge features with the experimental data. We emphasize that the FEFF computations cannot provide reliable absolute energy-value information. We therefore shifted the calculated spectra to match the experiment. All calculated
structures show sharp t2g-eg peaks in their computed O K-edge, in agreement with several prior
studies. Interestingly, the romanechite and hollandite show weaker eg peak signals due to their
different oxygen local environments.
Fig. S13. The five most stable IrO2 polymorphs with their DFT energy and corresponding
7.4. Amorphous IrO2 O K-edge
To obtain models of amorphous octahedral IrO2, we used previously generated TiO2 amorphous
structures (through a “melt and quenching” method) and replaces the Ti by Ir. (30) The models
were ionically relaxed after the substitution using DFT. Three models of amorphous IrO2 two
with 96 (96-1 and 96-2) and one with 192 atoms were generated. Fig. S14 show the relaxed
structures and their O K-edge spectra. We provide the structures as cifs in SI.