Healthier Canadians.
Our Mandate
To lead the development and maintenance of comprehensive and integrated health information that enables sound policy and
effective health system management that improve health and health care.
Our Values
Respect, Integrity, Collaboration, Excellence, Innovation
Acknowledgements ... iii
Executive Summary ... v
Introduction ... 1
Continuing Care Reporting System ... 1
Data and Methods ... 3
Nursing Home Population Overview ... 4
Quality Indicator Results ... 7
Physical Function ... 7
Transfers, Walking and Wheeling ... 8
Incontinence ... 10
Quality of Life ... 11
Depression ... 11
Behaviour Symptoms ... 14
Pain ... 16
Safety ... 17
Falls ... 17
Antipsychotic Medication ... 18
Pressure Ulcers ... 20
Discussion ... 21
Future Directions ... 22
Acknowledgements
CIHI wishes to acknowledge and thank the following individuals for their contributions to this report: Nancy White, Robyn Hastie, Joe Griffiths, Marufa Hoque, Lacey Langlois, Natalie Damiano, Douglas Yeo and Jean-Marie Berthelot.
We would also like to thank Dr. John P. Hirdes, Professor, School of Public Health and Health Systems, University of Waterloo, for his review of and feedback on this report.
Executive Summary
Nursing homes, also known across Canada as long-term care facilities or personal care homes, represent a critical component of our health care system, especially as our population ages. These homes serve seniors and others who do not need to be in a hospital but who do need a level of care not generally available through home care programs or retirement homes.
The average nursing home resident in Canada is age 85 or older and faces many challenges, including multiple chronic diseases and problems with mobility, memory and incontinence. Some are completely dependent on nursing home staff for the most basic activities of daily living, such as toileting and eating.
Incidents of abuse and neglect in nursing homes, widely reported by the media,1 are relatively rare but highlight the need for publicly available information on the quality performance of this sector.
The purpose of this report is to establish a baseline for tracking the quality of care provided to some of our most frail and vulnerable citizens—residents of nursing homes. It profiles eight quality indicators derived from the Resident Assessment Instrument–Minimum Data Set (RAI-MDS) collected through the Continuing Care Reporting System (CCRS) at the Canadian Institute for Health Information (CIHI). The report defines the indicators, describes the
importance of each indicator, presents results across jurisdictions and showcases how some facilities used quality indicator information to improve the quality of care for their residents.
The findings also serve as a starting point for a national conversation about improving safety and quality of life for the more than 200,000 Canadians who call nursing homes their home.2
Adjusted for differences in residents and homes across the country, the results reveal that, while some homes do better than others, no single home or jurisdiction performs well on all of the selected indicators. There is also considerable variation in home-level performance between and within jurisdictions.
For example, rates on the following indicators illustrate the differences in the results achieved by the best- and worst-performing 10% of homes across the country. Better performance on these indicators is represented by a lower percentage score.
• The percentage of residents on antipsychotic medications without a related diagnosis ranged from 18% to 50%.
• The percentage of residents with worsening symptoms of depression ranged from 3% to 40%.
• The percentage of residents with worsening pain ranged from 3% to 32%.
• The percentage of residents who fell ranged from 5% to 24%.
These differences in quality indicator rates across homes were seen even when adjustments were made for differences in resident and home characteristics.
The variation across organizations highlights potentially serious quality problems in some homes, but it also demonstrates what is possible—the best performers provide a benchmark that others can strive to meet. Case studies from four nursing homes are presented to illustrate the potential for performance improvement that exists when organizations use their data to drive quality.
As more organizations across the country submit their data to CCRS and begin using their comparative reports provided by CIHI, they will reap the quality improvement benefits of comparing their performance with that of other homes. As the database grows, future CCRS reports will document changes over time—ideally we will see improvements in quality indicator rates.
Several jurisdictions in Canada are implementing interRAI assessments in other sectors, such as community services, home care, emergency departments and palliative care, thus enhancing communication along a person’s journey through the health care system. There is also potential for international quality comparisons, as interRAI instruments are now used in more than 30 countries worldwide.
These developments represent emerging opportunities for CIHI to pursue its mandate of measuring performance across the entire health system—from primary and hospital care to home and facility-based community care.
Most importantly, however, residents and families will benefit when nursing homes adopt the CCRS standard. The care-planning guidance provided by the interRAI assessment supports best practice in care for residents. The information available to residents’ families provides a basis for a meaningful dialogue with the home about their loved ones’ care and quality of life. Finally, homes that use and share their quality indicators demonstrate to residents and families their continuing commitment to excellence.
Introduction
As Canada’s population ages, there is growing interest in health care services for seniors. A recent report describes the potential effects of baby boomers starting to reach age 65 in 2011.3 Another study suggests that “the increasing prevalence of chronic conditions will have a substantial impact on the population, the health care system and the workforce.”4
While there is research that sheds light on seniors’ use of hospitals and prescription drugs,5–8 high-quality information on other parts of the health care system is relatively scarce. The
Canadian Institute for Health Information (CIHI) is working to fill these information gaps, helping health system managers, policy-makers and Canadian families understand access, cost and quality across the full range of health services.
In particular, significant progress is being made in gathering information from residential care facilities, also known across Canada as nursing homes, long-term care facilities or personal care homes. These homes serve seniors and others who do not need to be in a hospital but who do need a level of care not generally available through home care programs or retirement homes.
The average nursing home resident in Canada is age 85 or older and faces many challenges, including multiple chronic diseases and problems with mobility, memory and incontinence. Many are completely dependent on nursing home staff for the most basic activities of daily living, such as toileting and eating.
Incidents of abuse and neglect in nursing homes, widely reported by the media,1 are relatively rare but highlight the need for publicly available information on the quality performance of this sector.
The purpose of this report is to establish a baseline for tracking the quality of care provided to some of our most frail and vulnerable citizens—residents of nursing homes. The findings may also serve as a starting point for a national conversation about improving safety and quality of life for the more than 200,000 Canadians who call nursing homes their home.2
Continuing Care Reporting System
The Continuing Care Reporting System (CCRS) supports the collection and analysis of nursing home information in Newfoundland and Labrador, Nova Scotia, Ontario, Manitoba,
Saskatchewan, Alberta, British Columbia and Yukon.
The information is captured electronically in the homes as part of the process of caring for residents. Clinical staff use the Canadian version of the Resident Assessment Instrument– Minimum Data Set, Version 2.0 (RAI-MDS 2.0©)9 developed by interRAI, an international research network, and adapted for use in Canada by CIHI.
The RAI-MDS 2.0 captures the clinical and functional characteristics of residents, including measures of cognition, mood and behaviour, continence and skin condition, medications and types of services received. The assessment has undergone rigorous reliability and validity testing in a number of countries worldwide, including Canada.9
An important feature of the RAI-MDS 2.0 system is the suite of clinical and management decision-support tools that are derived from the assessment. These tools, developed by interRAI, harness research and best practice information from around the world. The decision-support tools and their uses are briefly described in Table 1.
Table 1: Decision-Support Tools Derived From RAI-MDS 2.0 Assessment Assessment Output Purposes
Clinical Assessment
Protocols • Person-level reports flag residents who may be at risk of decline or failure to improve
• Used at point of care by clinicians to inform care planning and to set priority levels for service
• Aggregate data used by system managers to identify at-risk populations and plan for services
Outcome Scales • Person-level reports summarize the health of residents
• Used at point of care by clinicians to measure clinical and functional status and to monitor changes over time
• Aggregate data used by system managers to understand and plan for changing populations
Quality Indicators • Organization-level measures of quality across key domains, including physical and cognitive function, safety and quality of life
• Aggregate data used by quality leaders to drive continuous improvement efforts
• Used to communicate with key stakeholders through report cards and accountability agreements
Resource Utilization Groups • Organization-level reports cluster populations with similar characteristics and resource use
• Used by system managers and provincial/territorial funders as an input to resource allocation and funding decisions
Assessment information from the homes is sent to CIHI, stripped of all personal identifiers and stored in the secure CCRS database. The CCRS database currently holds comparable information on more than 1,100 nursing homes and 300,000 individual residents from across the country, providing a unique data source for understanding the sector and measuring quality.
Nursing homes and their respective health regions and/or ministries have access to quarterly web-based reports (called CCRS eReports) that show their activity statistics, resident profiles and quality indicator rates for the previous eight quarters. This information helps staff and managers understand trends over time.
CCRS eReports also provide authorized users in the homes, regions and ministries with access to all of the aggregate facility-level data from across the country. This allows homes to compare their quality performance with that of selected peers or with a specific benchmark. Transparency of reporting encourages homes to seek out best performers and to learn from each other.
Participating provinces and territories are now using this information in funding, quality and accountability agreements. Public reports on quality of care in nursing homes, such as those in Saskatchewan and Ontario, are also emerging as high-quality information becomes available.10, 11
CIHI also publishes summary information from CCRS on its website (www.cihi.ca). CCRS Quick Stats provide the general public, researchers, managers and policy-makers with at-a-glance profiles of the sector and its residents.
Data and Methods
The information in this report is based on assessment and administrative data received by CIHI from 966 nursing homes for the fiscal year 2011–2012. The residential care information from Manitoba represents homes in the Winnipeg Regional Health Authority only. Current information from Saskatchewan and Alberta was not available at the time of writing. Information from
hospital-based continuing care submitted to CCRS by Ontario and Manitoba is excluded from this analysis, given differences in mandate and populations.
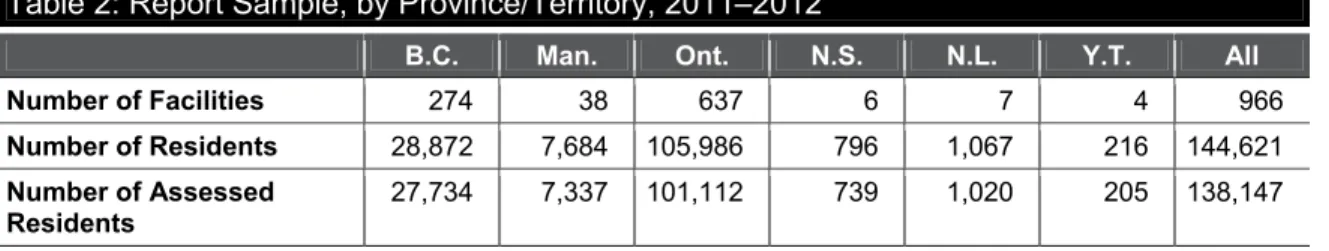
Table 2 describes the sample used in this report, including the number of homes, the total number of residents cared for during the period and the number of residents who received the RAI-MDS 2.0 assessment. Demographic information is available for all residents. Clinical profiles and quality indicators are calculated for assessed residents only. Some residents may not have received an assessment as they were admitted close to the end of the fiscal year or they were discharged before an assessment was conducted.
Table 2: Report Sample, by Province/Territory, 2011–2012
B.C. Man. Ont. N.S. N.L. Y.T. All
Number of Facilities 274 38 637 6 7 4 966
Number of Residents 28,872 7,684 105,986 796 1,067 216 144,621
Number of Assessed
Residents 27,734 7,337 101,112 739 1,020 205 138,147 Note
Manitoba homes include only those in the Winnipeg Regional Health Authority.
Source
Continuing Care Reporting System, 2011–2012, Canadian Institute for Health Information.
The section on nursing home quality provides a review of performance using selected RAI-MDS 2.0 quality indicators. These quality indicators, as described in Table 1, are aggregate measures developed by interRAI. They provide organizations with summary information across multiple domains of quality and signal potential problems that may require further investigation or action.
The RAI-MDS 2.0 assessment is conducted upon a resident’s admission to the nursing home and on a quarterly basis thereafter. This regular snapshot of a resident over time provides for indicators of improvement or decline in his or her health. It also allows for calculation of indicators related to adverse events (such as falls) or care processes (such as antipsychotic medication use).
The calculations exclude admission assessments to ensure that the quality indicators reflect the care provided in the nursing home rather than in a previous care setting (for example, home or hospital). With the exception of the indicator relating to pressure ulcers, assessments for residents who are in a coma or near death are also excluded from the calculations.
Risk adjustment uses statistical methods to help level the playing field for comparing homes with different types of residents. A recent international research effort by interRAI represents important improvements in risk adjustment of nursing home quality indicators, allowing for both resident and home characteristics.12 For more information on the risk adjustment, see CCRS
Quality Indicators: Risk Adjustment Methodology.13
The indicators are presented in a graphical format that allows the reader to interpret the quality indicator rates from a variety of perspectives:
• Overall Canadian unadjusted rate for the indicator for all facilities in the pan-Canadian sample—The Canadian rate provides a sense of the average performance across all participating facilities on a given indicator.
• Adjusted rate below which 50% of homes in a given province/territory are found (median)— The median is the middle value in the range of risk-adjusted quality indicator rates; it separates the higher-scoring half of the sample of homes from the lower half in a given province or territory.
• Adjusted rates below which 10% and 90% of homes in a given province/territory can be found (10th and 90th percentiles)—These percentiles provide a sense of the range of performance between homes within a jurisdiction. A large difference in rates between the 10th and 90th percentiles suggests variation in practice and room for improvement in performance. These percentile values are not reported for Yukon due to the small number of facilities in that territory.
Caution should be exercised in drawing conclusions from the findings for Manitoba, Nova Scotia and Newfoundland and Labrador, because not all facilities in these provinces submit data to CIHI. The participating CCRS homes may not be representative of all homes in these provinces.
Nursing Home Population Overview
The RAI-MDS 2.0 assessment provides information in real time for those providing care to individuals. The assessment also provides a rich profile of the characteristics, risks and needs of resident populations across the country.
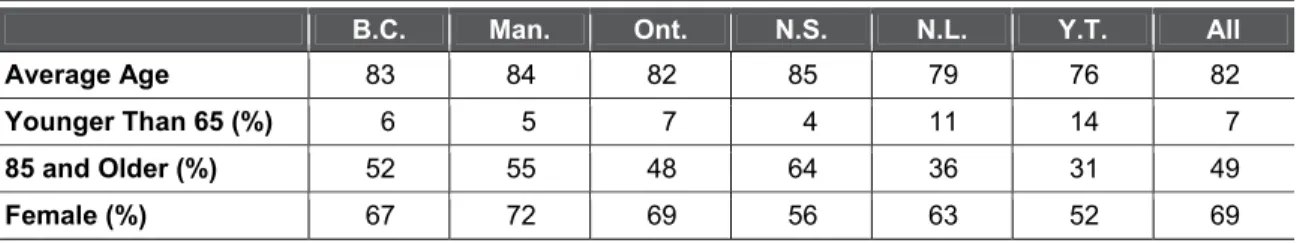
Table 3 illustrates that, of nearly 150,000 nursing home residents, only 1 out of 15 was younger than age 65 and nearly half were very elderly (85 or older). The majority were women.
There were notable differences across jurisdictions. Yukon, along with participating homes in Newfoundland and Labrador, had more residents younger than 65. Participating homes in Nova Scotia had a greater proportion of residents age 85 and older. Yukon and Nova Scotia homes had lower proportions of women.
Table 3: Age and Sex of Nursing Home Residents, by Province/Territory, 2011–2012
B.C. Man. Ont. N.S. N.L. Y.T. All
Average Age 83 84 82 85 79 76 82
Younger Than 65 (%) 6 5 7 4 11 14 7
85 and Older (%) 52 55 48 64 36 31 49
Female (%) 67 72 69 56 63 52 69
Note
Manitoba homes include only those in the Winnipeg Regional Health Authority.
Source
Continuing Care Reporting System, 2011–2012, Canadian Institute for Health Information.
Table 4 provides a high-level health profile of nursing home residents across the country, based on their most recent RAI-MDS 2.0 assessments.
Table 4: Selected Clinical Characteristics of Nursing Home Residents Receiving a RAI-MDS 2.0 Assessment, by Province/Territory, 2011–2012
B.C. Man. Ont. N.S. N.L. Y.T. All
Bladder Incontinence (%) 66 67 71 59 66 55 70
Diagnosis of Dementia (%) 61 61 60 55 48 43 60
Musculoskeletal Diseases (%) 45 51 59 51 41 51 56
Bowel Incontinence (%) 44 45 51 43 62 28 49
Limited or No Social Engagement (%) 53 48 44 40 55 28 46
Signs of Depression (%) 21 18 34 20 21 38 30
Diabetes (%) 20 21 27 25 25 26 25
Daily Pain (%) 23 25 16 36 22 32 18
Chronic Obstructive Pulmonary
Disease (%) 12 13 16 16 13 22 15
Congestive Heart Failure (%) 12 15 13 14 12 14 13
Cancer (%) 7 6 9 8 13 10 8
Note
Manitoba homes include only those in the Winnipeg Regional Health Authority.
Source
Continuing Care Reporting System, 2011–2012, Canadian Institute for Health Information.
The most common problem, affecting 70% of nursing home residents, was bladder
incontinence, an important health and quality-of-life issue. Dementia, including Alzheimer’s disease, was the next most common health condition, with three in five residents having this diagnosis on their health record. More than half of the sample of residents across the country had musculoskeletal conditions such as arthritis, fractures and missing limbs. Nearly half had problems with bowel incontinence; similar proportions had limited or no social engagement.
Almost one-third showed signs of clinical depression. A quarter of residents lived with diabetes and nearly one in five had daily pain. Others had chronic lung or heart conditions, and 1 in 10 had a cancer diagnosis. All of these problems have an impact on residents’ needs for care and their quality of life.
Individuals with greater cognitive impairment also tend to have greater difficulty with activities of daily living.14 Figure 1 illustrates the relationship between cognitive and physical impairment across nursing home populations in Canada. It plots the percentage of residents who had impairment in activities of daily living and the percentage of residents who had impairment in cognitive function, by province and territory.
The Activities of Daily Living Hierarchy Scale reflects self-performance in personal hygiene, toilet use, locomotion and eating. A score of 3 or higher indicates moderate to severe impairment.
The Cognitive Performance Scale reflects a person’s short-term memory, skills for daily decision-making, expressive communication and eating. A score of 3 or higher indicates moderate to severe impairment.
Figure 1: Percentage of Assessed Nursing Home Residents With Moderate to Severe Cognitive and Functional Impairment, by Province/Territory, 2011–2012
Notes
CPS: Cognitive Performance Scale. ADL: Activities of Daily Living.
Manitoba homes include only those in the Winnipeg Regional Health Authority.
Source
This profile suggests that some provinces serve a more severely impaired population. For example, homes in the Winnipeg Regional Health Authority had the highest proportion of residents with moderate to severe cognitive impairment (63%), while participating Newfoundland and Labrador homes had the highest proportion of residents with moderate to severe physical impairments (84%). Homes in Yukon had smaller proportions of residents with physical and cognitive impairments.
These differences indicate variation across jurisdictions, not only in their population profiles, but also in the role of nursing homes relative to hospitals, home care or assisted-living facilities.
Given the differences across the country as illustrated above, fair comparisons of quality across nursing homes may be made only using person-level data and statistical risk adjustment. The CIHI–interRAI collaboration on CCRS quality indicators makes this possible.
Quality Indicator Results
The figures below provide results for selected quality indicators in key domains of quality— physical function, quality of life and resident safety. Each figure illustrates the variation in performance within and between jurisdictions, adjusted for population and facility differences. Case studies from Canadian nursing homes provide insight into how the quality indicators are being used to drive improvements in the well-being of their residents.
Physical Function
Nursing home residents require a level of round-the-clock care or supervision by medical and nursing staff not generally available in private homes, group homes or retirement facilities. Some arrive at the nursing home in frail condition following hospitalization for an illness or injury. Many need help with basic activities of daily living due to physical or cognitive challenges. The selected indicators measure changes in a resident’s physical mobility and bladder incontinence over the 90-day period prior to the most recent assessment.
Transfers, Walking and Wheeling
Figure 2 illustrates the range of facility-level rates of residents who maintained independence or achieved improvements in their ability to transfer in and out of a bed or chair and in their ability to walk or wheel around the nursing home in the 90 days since their previous assessment. Good performance is represented by a high rate on this indicator.
Figure 2: Facility-Level Quality Indicator Rates for Maintaining Independence or Achieving Improvements in Residents’ Ability to Transfer, Walk or Wheel, by Province/Territory, 2011–2012
Notes
* Unadjusted rate, N = 941.
Manitoba homes include only those in the Winnipeg Regional Health Authority.
Source
Continuing Care Reporting System, 2011–2012, Canadian Institute for Health Information.
The overall rate for all participating homes was 30% of residents maintaining independence or achieving improvements in transfers, walking and wheeling. Median rates across jurisdictions ranged from 27% to 46%, when adjusted for population and facility characteristics.
There was also variation in performance on this indicator within jurisdictions. For example, while the median rate for Ontario was 32% of residents maintaining independence or improving, some homes achieved rates of 41% while others achieved only 18% on the indicator. This variation in performance suggests differences across facilities in their approach to restorative care—a program focusing on residents’ potential to maintain or improve independence in activities of daily living.
Spotlight on Success: Heartwood (Cornwall, Ontario)
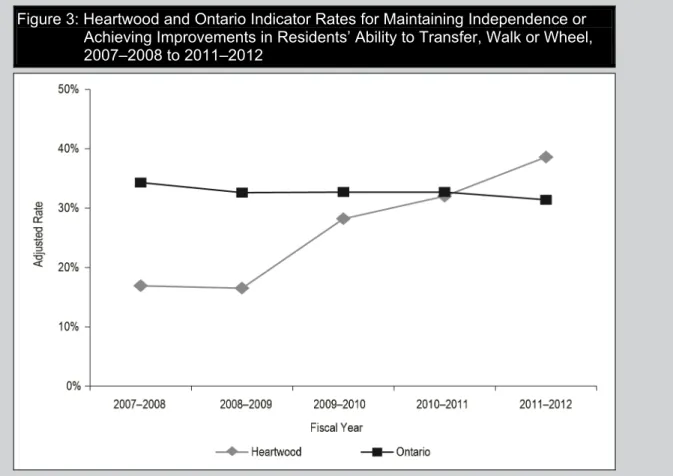
Heartwood is a 118-bed home located in Cornwall, Ontario. It is owned and operated by Revera, an organization that provides services for seniors in Canada and the United States. In 2008, the RAI-MDS coordinator at Heartwood introduced a new focus on restorative care that included training for all staff, additional physiotherapy support and improved documentation of residents’ activities of daily living. The care team collaborated to identify those with potential for improvement and used the RAI-MDS care protocols to support their care planning. Figure 3 illustrates the progress made since 2008. In 2007, Heartwood’s rate on this quality indicator was only half of the rate achieved overall in the province. It has consistently improved and now boasts a rate above the provincial average. More Heartwood residents are now maintaining or improving their mobility, allowing them to socialize and engage in meaningful activities in the home. In addition, Heartwood continues to review their data to focus their quality improvement activities.
Figure 3: Heartwood and Ontario Indicator Rates for Maintaining Independence or Achieving Improvements in Residents’ Ability to Transfer, Walk or Wheel, 2007–2008 to 2011–2012
Source
Continuing Care Reporting System, 2011–2012, Canadian Institute for Health Information.
Why Is This Indicator Important?
Being able to move around is critical for the health and well-being of nursing home residents. Loss of independence in these key activities of daily living may be associated with social isolation of the resident and contribute to a slippery slope of decline in other domains, such as strength, continence, mental health and cognitive function. Therefore, nursing homes need to identify those residents who are currently independent or who have potential for improvement. These residents require targeted interventions to achieve and maintain their optimal level of mobility for as long as possible.
Incontinence
Figure 4 illustrates the facility-level percentage of residents whose bladder incontinence worsened during the 90-day period, as documented in the assessment. Good performance is represented by a low rate on this indicator.
Figure 4: Facility-Level Quality Indicator Rates for Residents Whose Bladder Incontinence Worsened, by Province/Territory, 2011–2012
Notes
* Unadjusted rate, N = 932.
Manitoba homes include only those in the Winnipeg Regional Health Authority.
Source
Continuing Care Reporting System, 2011–2012, Canadian Institute for Health Information.
The overall rate for this indicator was 19%, representing nearly one in five residents with a worsening of bladder incontinence. Median rates across jurisdictions ranged from 11% to 35% of residents with worsening incontinence, when adjusted for population and facility characteristics.
There was also variation in performance on this indicator within jurisdictions. For example, there was a threefold difference in rates between the high- and low-scoring 10% of nursing homes in British Columbia and a nearly fourfold difference in Newfoundland and Labrador.
Why Is This Indicator Important?
Incontinence has many negative consequences for a resident, including social isolation, reduced mobility and skin breakdown, the latter being a potentially serious medical issue.15 Nursing homes need to be aware of the potential underlying causes of incontinence and actively intervene to prevent decline. Best practice guidelines, such as those published by the Registered Nurses’ Association of Ontario,16 are available for homes. These guidelines may be used in conjunction with the RAI-MDS Clinical Assessment Protocols to support ongoing quality improvement.
Quality of Life
The indicators selected for this domain reflect significant challenges faced by nursing home residents—depression, behavioural symptoms and pain—which have a negative impact on quality of life. These indicators focus on decline or worsening of symptoms.
Depression
Figure 5 illustrates the facility-level percentage of residents whose mood worsened during the 90-day period, as measured by the number of signs of depression documented in the assessment. Good performance is represented by a low rate on this indicator.
Figure 5: Facility-Level Quality Indicator Rates for Residents Whose Mood Worsened, by Province/Territory, 2011–2012
Notes
* Unadjusted rate, N = 943.
Manitoba homes include only those in the Winnipeg Regional Health Authority.
Source
The overall rate for this indicator was 24%; in other words, nearly one-quarter of residents exhibited more symptoms of depression since their last assessment. Median rates across jurisdictions ranged from 9% to 33%, when adjusted for population and facility characteristics.
There was also variation in performance on this indicator within jurisdictions. For example, in Ontario, the top-performing group of facilities achieved a rate of 12%, while those in the lower-performing group had rates of 40% or higher.
Why Is This Indicator Important?
Depression is not a normal part of aging. Numerous studies have documented high rates of depression in nursing homes compared with rates in the community.17–19 A report released in 2010 found that nearly half (44%) of seniors in nursing homes had a diagnosis or symptoms of depression.20 Residents with symptoms of depression were more likely to experience decline in self-sufficiency and cognitive function, along with sleep disturbance and worsening behaviour symptoms. All of these compromise a resident’s quality of life.
A number of therapies, including medications, psychotherapy and physical or social activities, are available to address symptoms of depression and enhance quality of life.
Spotlight on Success: Fiddick’s Nursing Home (Petrolia, Ontario)
Located in the picturesque town of Petrolia, near Sarnia, Ontario, Fiddick’s is a small family-owned and -operated nursing home. It was an early adopter of the RAI-MDS and identified depression as a concern in 2008. It began by educating staff on appropriately documenting depression symptoms and introduced an interdisciplinary approach to care, including a psychiatrist, geriatrician and pharmacist. Fiddick’s used the RAI-MDS Depression Rating Scale to monitor residents’ moods, with staff meeting on a weekly basis to review the data along with other information, such as on medications and resident activity.
Figure 6 illustrates that the rate of worsening mood in Fiddick’s in 2008 was near the provincial average rate in Ontario. Since that time, there has been steady improvement in this indicator, and Fiddick’s is now one of the best performers in the province. This success was achieved while also reducing the rate of benzodiazepine use, thereby reducing the risk to residents posed by these medications.
Figure 6: Fiddick’s and Ontario Indicator Rates for Residents Whose Mood Worsened, 2008–2009 to 2011–2012
Source
Behaviour Symptoms
Figure 7 illustrates the facility-level percentage of residents whose behaviour symptoms worsened during the 90-day period, as measured by the number of difficult behaviours documented in the assessment, including wandering, verbal or physical abuse, and socially inappropriate behaviour. Good performance is represented by a low rate on this indicator.
Figure 7: Facility-Level Quality Indicator Rates for Residents Whose Behaviour Symptoms Worsened, by Province/Territory, 2011–2012
Notes
* Unadjusted rate, N = 942.
Manitoba homes include only those in the Winnipeg Regional Health Authority.
Source
Continuing Care Reporting System, 2011–2012, Canadian Institute for Health Information.
The overall rate for this indicator was 12% of residents experiencing a worsening of behaviour symptoms. Median rates across jurisdictions ranged from 6% to 13%, when adjusted for population and facility characteristics.
There was also variation in performance on this indicator within jurisdictions. For example, in Newfoundland and Labrador, some homes achieved rates of 3%; others had rates of 20% or higher, suggesting potential differences in behaviour management practices across homes in that province.
Why Is This Indicator Important?
Behavioural symptoms create quality-of-life challenges not only for the individual, but also for other residents.21 A study of nearly 700 nursing home residents explored the complex set of factors that contribute to behavioural symptoms and provided homes with information to help identify residents at risk.21
While severe behaviour disturbance is relatively rare, homes must intervene wherever possible to prevent decline in vulnerable individuals. For example, the P.I.E.C.E.S.™ program, which was developed in Ontario and is now being used across Canada, provides caregivers with a comprehensive, interdisciplinary approach to dementia and mental health care.22 The model emphasizes medications as a last resort when managing challenging behavioural symptoms.
Spotlight on Success: Saint Vincent’s Nursi
ng Home (Halifax
, Nova Scotia)
Saint Vincent’s is a 149-bed nursing home in the heart of Halifax. As an early adopter of the RAI-MDS assessment, Saint Vincent’s uses its indicator data to support quality improvements. In 2009, the model of physician services for nursing homes in Nova Scotia’s Capital District Health Authority changed, so that a dedicated physician is now provided for each unit in the nursing home. This paved the way for comprehensive medication reviews using a team approach involving nurses, physicians, pharmacist, physiotherapists, dietician, etc. These reviews allow for timely changes to be made to medications as required. In addition, all nurses are trained in the P.I.E.C.E.S. model and use P.I.E.C.E.S. tools to track resident behaviours.
Figure 8 illustrates the home’s success in reducing the rate of residents whose behaviour symptoms worsened from 6% to 3%, reaping quality-of-life benefits for residents, family members, volunteers and staff.
Figure 8: Saint Vincent’s and Nova Scotia Indicator Rates for Residents Whose Behaviour Symptoms Worsened, 2007–2008 to 2011–2012
Source
Pain
Figure 9 illustrates the facility-level percentage of residents whose pain worsened during the 90-day period, as measured by the interRAI Pain Scale. The scale captures both frequency and intensity of pain. Good performance is represented by a low rate on this indicator.
Figure 9: Facility-Level Quality Indicator Rates for Residents Whose Pain Worsened, by Province/Territory, 2011–2012
Notes
* Unadjusted rate, N = 943.
Manitoba homes include only those in the Winnipeg Regional Health Authority.
Source
Continuing Care Reporting System, 2011–2012, Canadian Institute for Health Information.
The overall rate for this indicator was 11% of residents experiencing more frequent or more intense pain. Median rates across jurisdictions ranged from 6% to 32%, when adjusted for population and facility characteristics.
There was also variation in performance on this indicator within jurisdictions. For example, within British Columbia, the top-performing homes achieved rates of 5%, while others had rates of 20%, or one in five residents with worsening pain.
Why Is This Indicator Important?
Pain has been shown to have a negative impact on a resident’s sleep, emotional state, social life and overall quality of life.23 Nursing home caregivers need to be aware of the non-verbal signs of pain, especially in residents who have cognitive or communication difficulties. Many
Safety
The selected indicators for this domain measure residents who fall in the nursing home, the use of antipsychotic medications in the absence of a documented diagnosis of psychosis and development of new stage 2 to 4 pressure ulcers.
Falls
Figure 10 illustrates the facility-level percentage of residents who fell during the previous 30 days, as captured on the assessment. Good performance is represented by a low rate on this indicator.
Figure 10: Facility-Level Quality Indicator Rates for Residents Who Fell in the Previous 30 Days, by Province/Territory, 2011–2012
Notes
* Unadjusted rate, N = 951.
Manitoba homes include only those in the Winnipeg Regional Health Authority.
Source
Continuing Care Reporting System, 2011–2012, Canadian Institute for Health Information.
The overall rate for this indicator was 13% of residents experiencing a fall in the 30 days prior to the assessment. Median rates across jurisdictions ranged from 7% to 17%, when adjusted for population and facility characteristics.
There was also variation in performance on this indicator within jurisdictions. For example, in the Winnipeg Regional Health Authority, there was a large difference between low and high rates across homes (10% and 24%).
Why Is This Indicator Important?
Falls, particularly among the elderly, represent an important cause of injury and death. Even in the absence of an injury, a resident who falls may develop a fear of falling. This in turn may result in anxiety as well as decreased mobility and social interaction, all of which affect a resident’s quality of life. While it is not reasonable to expect a fall rate of zero, homes may employ many strategies to reduce the risk, including those found in the interRAI Clinical Assessment Protocol for falls.
Antipsychotic Medication
Figure 11 illustrates the facility-level percentage of residents who received an antipsychotic medication during the previous 90 days who did not have schizophrenia, Huntington’s syndrome or hallucinations recorded on their assessment. Good performance is represented by a low rate on this indicator.
Figure 11: Facility-Level Quality Indicator Rates for Residents on Antipsychotic Medication Without a Diagnosis of Psychosis, by Province/Territory, 2011–2012
Notes
* Unadjusted rate, N = 950.
Manitoba homes include only those in the Winnipeg Regional Health Authority.
Source
Continuing Care Reporting System, 2011–2012, Canadian Institute for Health Information.
The overall rate for this indicator was 32% of residents receiving antipsychotic medication in the absence of a related diagnosis on the assessment. Median rates across jurisdictions ranged from 26% to 34%, when adjusted for population and facility characteristics.
Why Is This Indicator Important?
A report on seniors’ use of antipsychotic medications documented high rates of use of these drugs in nursing homes compared with rates in the community, often to manage the behavioural symptoms commonly associated with dementia.24 Given the risks for side effects and the
warnings issued by Health Canada, this family of drugs should be used with caution, especially among the elderly. While these drugs may be appropriate for some residents, homes with lower rates of use may be using alternative therapies to reduce the risks.
Spotlight on Success: Middlechurch Nursing Home (Winnipeg, Manitoba)
Middlechurch Nursing Home is a 197-bed facility located near the banks of the Red River on the outskirts of Winnipeg. In 2010, an initiative was launched to reduce the use of antipsychotic medications for residents who did not have a related psychiatric diagnosis. The project included training staff in the P.I.E.C.E.S. model, mentoring clinical and leadership teams on a weekly basis to promote knowledge transfer and an online self-learning module. Regular feedback from their RAI-MDS data informs front-line staff and managers of their program’s progress. Figure 12 illustrates Middlechurch’s success, with adjusted rates falling from 42% to 30% in the latest year of data. This success was achieved with no corresponding increase in the use of physical restraints.
Figure 12: Middlechurch and Manitoba Indicator Rates for Residents on Antipsychotic Medication Without a Diagnosis of Psychosis, 2008–2009 to 2011–2012
Note
Manitoba homes include only those in the Winnipeg Regional Health Authority.
Source
Pressure Ulcers
Figure 13 illustrates the facility-level percentage of residents who developed a new stage 2 to 4 pressure ulcer during the previous 90 days. Good performance is represented by a low rate on this indicator.
Figure 13: Facility-Level Quality Indicator Rates for Residents With a New Stage 2 to 4 Pressure Ulcer, by Province/Territory, 2011–2012
Notes
* Unadjusted rate, N = 943.
Manitoba homes include only those in the Winnipeg Regional Health Authority.
Source
Continuing Care Reporting System, 2011–2012, Canadian Institute for Health Information.
Fortunately, development of new pressure ulcers in nursing homes is a relatively rare event. The overall rate for this indicator was less than 3% of residents developing a new pressure ulcer since their last assessment. Median rates across jurisdictions ranged from slightly below 2% to nearly 6%, when adjusted for population and facility characteristics.
There was variation in performance on this indicator within jurisdictions. For example, in Newfoundland and Labrador, the top-performing group of homes achieved a rate of 0%, while others had rates of nearly 6%.
Why Is This Indicator Important?
Residents who develop pressure ulcers suffer from pain, may develop infections and are at greater risk of death. Pressure ulcers are complex and costly to treat; thus prevention is a
Discussion
This report introduces eight quality indicators available in CCRS and presents comparative rates, adjusted for differences in facilities and populations. It also provides a snapshot of nursing home residents in six of the eight Canadian jurisdictions where the RAI-MDS 2.0 is used to plan and monitor care.
The quality indicator rates vary, with some problems—such as new pressure ulcers—being rare and others—such as declining mood and receiving antipsychotic medication without a diagnosis of psychosis—being more common.
The results reveal that, while some homes do better than others, no single home or jurisdiction performs well on all of the selected indicators. There is considerable variation in home-level performance between and within jurisdictions.
For example, rates on the following indicators illustrate the differences in the results achieved by the best- and worst-performing 10% of homes across the country. Better performance on these indicators is represented by a lower percentage score.
• The percentage of residents on antipsychotic medications without a related diagnosis ranged from 18% to 50%.
• The percentage of residents with worsening symptoms of depression ranged from 3% to 40%.
• The percentage of residents with worsening pain ranged from 3% to 32%.
• The percentage of residents who fell ranged from 5% to 24%.
These differences in quality indicator rates across homes were seen even when adjustments were made for differences in resident and home characteristics.
This variation highlights potential quality problems in some homes, but it also demonstrates what is possible—the best performers provide a benchmark that others can strive to meet. The case studies illustrate the potential that exists for performance improvement when organizations use their data to drive quality. Improvements in performance may also be achieved by using interRAI’s Clinical Assessment Protocols to develop individualized care plans that reflect best practice for each resident.26 Homes may also use the evidence provided in the Clinical Assessment Protocols to guide development of new programs to improve quality of care and outcomes for vulnerable groups of residents.
Future Directions
This is the first CCRS report showcasing nursing home quality indicators. Every year, more homes across the country begin using the RAI-MDS 2.0 and CIHI’s reports in their continuous quality improvement programs. CIHI provides technical, analytical and clinical support to participating homes as they collect and submit their data and translate it into actions for quality improvement. As the database grows, future reports will document changes over time—ideally we will see improvements in quality indicator rates.
Several jurisdictions in Canada are implementing interRAI assessments in other sectors, such as community services, home care, emergency departments and palliative care, thus enhancing communication along a person’s journey through the health care system. A common language and comparable clinical scales and assessment protocols across settings allow care providers to
respond in a timely way to meet a person’s care needs. Comparable quality indicators and resource utilization groups across sectors help planners and policy-makers ensure that Canadian seniors and others with continuing care needs have access to high-quality care.
CIHI supports these initiatives by setting Canadian data standards and, in some cases, developing new reporting systems. CIHI’s Home Care Reporting System recently expanded to accept
assessments from hospital emergency departments and community-based screening programs done using the interRAI Contact Assessment. This allows for a more complete picture of transitions from independent living to hospitals and other types of care. In addition to conducting community-based assessments, home care staff in Canada collaborate with hospitals, providing pre-discharge assessments of individuals, which supports referral to home care services or a nursing home.
With more countries adopting interRAI’s assessment instruments, international comparisons become possible. A recent study in seven European Union countries validated the new version of the nursing home instrument—the interRAI Long-Term Care Facilities assessment.27 This study shows similarities and differences in demographics and level of impairment across countries, consistent with our findings across provinces and territories. Finland’s nursing home population is quite similar to Canada’s, based on the interRAI clinical scales, and represents a potential peer for international benchmarking on quality indicators.28
CIHI is moving toward more comprehensive health system performance measurement as new initiatives capture timely point-of-care information from primary care clinics and physician offices, hospitals, nursing homes and home care. This emerging information will move us toward a more complete picture of the Canadian health care system. The data will also shed light on the many dimensions of quality that must be addressed to achieve excellence across the full continuum of care. This information is fundamental to health system sustainability and to Canadians receiving the right care, in the right place, at the right time.
Most importantly, however, residents and families will benefit when nursing homes adopt the CCRS standard. The care-planning guidance provided by the assessment supports best practice in care for residents. The information available to residents’ families provides a basis for a meaningful dialogue
References
1. Welsh M, McLean J. Nursing home residents abused [abstract]. Toronto Star. 2011.
2. Statistics Canada. Residential Care Facilities, 2009/2010. Statistics Canada; 2011.
http://www.statcan.gc.ca/pub/83-237-x/83-237-x2012001-eng.pdf.
3. Canadian Institute for Health Information. Health Care in Canada: A Focus on Seniors and
Aging. Ottawa, ON: CIHI; 2011.
4. Canadian Institute for Health Information. Seniors and the Health Care System: What Is the
Impact of Multiple Chronic Conditions? Ottawa, ON: CIHI; 2011.
5. Canadian Institute for Health Information and . Health Indicators 2007. Ottawa, ON: CIHI; 2007.
6. Canadian Institute for Health Information. Alternate Level of Care in Canada. Ottawa, ON:
CIHI; 2009.
7. Canadian Institute for Health Information. Proton Pump Inhibitor Use in Seniors: An Analysis
Focusing on Drug Claims, 2001 to 2008. Ottawa, ON: CIHI; 2009.
8. Canadian Institute for Health Information. Seniors’ Use of Emergency Departments in
Ontario, 2004-2005 to 2008-2009. Ottawa, ON: CIHI; 2010.
9. Hirdes JP, Ljunggren G, Morris JN, et al. Reliability of the interRAI suite of assessment
instruments: a 12-country study of an integrated health information system. BMC Health
Serv Res. 2008;8:277. PM:19115991.
10. Health Quality Ontario. http://www.hqontario.ca. Updated October 4, 2011. Accessed
August 29, 2012.
11. Health Quality Council. http://www.hqc.sk.ca. Updated 2012. Accessed August 29, 2012.
12. Morris JN, Jones RN, Fries BE, Hirdes JP. Convergent validity of minimum data set-based
performance quality indicators in postacute care settings. Am J Med Qual. 2004;19(6):
242-247. PM:15620075.
13. Canadian Institute for Health Information. CCRS Quality Indicators Risk Adjustment
Methodology. http://www.cihi.ca/CIHI-ext-portal/internet/EN/TabbedContent/
types+of+care/community+care/residential+care/cihi010266. Updated 2012.
14. Landi F, Onder G, Cattel C, et al. Functional status and clinical correlates in cognitively
impaired community-living older people. J Geriatr Psychiatry Neurol. 2001;14(1):21-27.
PM:11281312.
15. Dubeau CE, Simon SE, Morris JN. The effect of urinary incontinence on quality of life in
older nursing home residents. J Am Geriatr Soc. 2006;54(9):1325-1333. PM:16970638.
16. Registered Nurses Association of Ontario. Best practices toolkit : implementing and
sustaining change in long-term care. http://ltctoolkit.rnao.ca. Updated 2012. Accessed
October 1, 2012.
17. Blazer DG. Depression in late life: review and commentary. J Gerontol A Biol Sci Med Sci.
18. Djernes JK. Prevalence and predictors of depression in populations of elderly: a review.
Acta Psychiatr Scand. 2006;113(5):372-387. PM:16603029.
19. Hybels CF, Blazer DG. Epidemiology of late-life mental disorders. Clin Geriatr Med.
2003;19(4):663-696. PM:15024807.
20. Canadian Institute for Health Information. Depression Among Seniors in Residential Care. Ottawa, ON: CIHI; 2010.
21. Canadian Institute for Health Information. Caring for Nursing Home Residents With
Behavioural Symptoms: Information to Support a Quality Response. Ottawa, ON: CIHI; 2008. 22. About P.I.E.C.E.S. http://www.piecescanada.com/index.php?option=com_content&view=
article&id=1&Itemid=3. Updated 2012. Accessed August 29, 2012.
23. Torvik K, Kaasa S, Kirkevold O, Rustoen T. Pain and quality of life among residents of Norwegian nursing homes. Pain Manag Nurs. 2010;11(1):35-44. PM:20207326. 24. Canadian Institute for Health Information. Antipsychotic Use in Seniors: An Analysis
Focusing on Drug Claims, 2001 to 2007. Ottawa, ON: CIHI; 2009.
25. Livesley NJ, Chow AW. Infected pressure ulcers in elderly individuals. Clin Infect Dis.
2002;35(11):1390-1396. PM:12439803.
26. interRAI. InterRAI Clinical Assessment Protocols (CAPs)—For Use With InterRAI’s Community and Long-Term Care Assessment Instruments, March 2008. Ottawa, ON: CIHI; 2008.
27. Onder G, Carpenter I, Finne-Soveri H, et al. Assessment of nursing home residents in Europe: the Services and Health for Elderly in Long TERm care (SHELTER) study. BMC Health Serv Res. 2012;12:5. PM:22230771.
28. Finne-Soveri H, Hammar T, Noro A. Measuring the quality of long-term institutional care in Finland [abstract]. Eurohealth 2010;16:8-10.
or territorial government. All rights reserved.
The contents of this publication may be reproduced unaltered, in whole or in part and by any means, solely for non-commercial purposes, provided that the Canadian Institute for Health Information is properly and fully acknowledged as the copyright owner. Any reproduction or use of this publication or its contents for any commercial purpose requires the prior written authorization of the Canadian Institute for Health Information. Reproduction or use that suggests endorsement by, or affiliation with, the Canadian Institute for Health Information is prohibited.
For permission or information, please contact CIHI: Canadian Institute for Health Information
495 Richmond Road, Suite 600 Ottawa, Ontario K2A 4H6 Phone: 613-241-7860 Fax: 613-241-8120
www.cihi.ca copyright@cihi.ca
ISBN 978-1-77109-161-9 (PDF)
© 2013 Canadian Institute for Health Information
RAI-MDS 2.0 © interRAI Corporation, Washington, D.C., 1997, 1999. Modified with permission for Canadian use under license to the Canadian Institute for Health Information.
How to cite this document:
Canadian Institute for Health Information. When a Nursing Home Is Home: How Do Canadian Nursing Homes Measure Up on Quality? Ottawa, ON: CIHI; 2013. Cette publication est aussi disponible en français sous le titre Vivre dans un centre de
CIHI Ottawa
495 Richmond Road, Suite 600 Ottawa, Ontario K2A 4H6 Phone: 613-241-7860 CIHI Toronto
4110 Yonge Street, Suite 300 Toronto, Ontario M2P 2B7 Phone: 416-481-2002 CIHI Victoria
880 Douglas Street, Suite 600 Victoria, British Columbia V8W 2B7 Phone: 250-220-4100
CIHI Montréal
1010 Sherbrooke Street West, Suite 300 Montréal, Quebec H3A 2R7
Phone: 514-842-2226 CIHI St. John’s
140 Water Street, Suite 701
St. John’s, Newfoundland and Labrador A1C 6H6 Phone: 709-576-7006