2019 Community Report
Bernalillo County
For the purposes of this report, data are compiled by the University of New Mexico, Geospatial and Population Studies, Traffic Research Unit (TRU), on behalf of the New Mexico Department of Transportation (NMDOT). Data in this report may differ from that in other data sources, such as the Federal Fatality Analysis Reporting System (FARS), due to the timing of publications and rules for how data are compiled and maintained in Federal vs. State databases. If you have questions regarding this report, please contact the
Traffic Safety Division at 505-827-0427.
Produced for the New Mexico Department of Transportation,
Traffic Safety Division, Traffic Records Bureau,
Under Contract 6093 by the University of New Mexico,
Geospatial and Population Studies, Traffic Research Unit
Distributed in compliance with New Mexico Statute 66-7-214
Sources
Aggravated DWI – A driver arrested for 1) driving with a BAC of 0.16 or higher, 2) driving under the influence of alcohol
or drugs and causing bodily injury to a human being as a result, or 3) driving under the influence of alcohol or drugs and refusing to submit to a BAC test at the time of arrest for DWI.
Alcohol-involved Crash – A crash for which the Uniform Crash Report indicated that 1) a DWI citation was issued, 2)
alcohol was a contributing factor, or 3) a person in control of a vehicle (including a pedestrian or pedalcyclist) was suspected of being under the influence of alcohol.
Alcohol-involved Driver – A person in control of a vehicle who was cited for DWI or indicated on the Uniform Crash
Report as being either suspected or determined by testing to be under the influence of alcohol. There can be multiple alcohol-involved drivers in a single alcohol-involved crash.
Crash – A reported incident on a public roadway involving one or more motor vehicles that resulted in death, personal
injury, or at least $500 in property damage. Crashes on private property (such as a parking lot) are not included.
DWI Arrest (Citation) – In this report, a DWI arrest (a.k.a. a DWI citation) is a driver arrested for either DWI or aggravated DWI. New Mexico’s legal limit for presumption of driving while intoxicated (DWI) is 0.08 for
non-commercial drivers older than 21 years of age, 0.04 for non-commercial vehicle drivers, and 0.02 for drivers younger than 21 years of age.
DWI Conviction – A driver convicted of driving under the intoxicating influence of alcohol, narcotics, or pathogenic
drugs, including aggravated DWI.
Fatal Crash – A crash in which at least one person was killed. More than one person can be killed in a single fatal crash.
Fatalities – The number of people killed in a crash. The terms “killed” and “deaths” are synonymous with “fatalities.” A
fatality is crash-related if it occurs at the time of the crash or if the person(s) involved in the crash dies within 30 days.
Injury Crash – A reported crash in which at least one person was injured. Injury crashes involve at least one suspected
serious injury (Class A), suspected minor injury (Class B), or possible injury (Class C). Fatal crashes are not included.
Missing Data – An indication that the applicable field on the UCR form was left blank or contained an invalid code.
Starting with crashes that occurred in 2012, improvements in the identification of missing data in the NMDOT crash database led to an increase in the reported amount of missing data.
Pedalcyclist – A person riding a mechanism of transport that is powered solely by pedals (a.k.a. bicyclist).
Pedestrian – A person on foot, walking, running, jogging, hiking, sitting or lying down who is involved in a motor vehicle
traffic crash.
Crash Data – New Mexico Department of Transportation, Traffic Safety Division, Traffic Records Bureau, Traffic Crash
Database, as of the report date below. Crash data are compiled using NMDOT Uniform Crash Reports (UCR), submitted by law enforcement agencies in the state, for any incident on a public roadway involving one or more motor vehicles that resulted in death, injury, or at least $500 in property damage. These reports are processed by the NMDOT Traffic Records Bureau and analyzed by the University of New Mexico, Geospatial and Population Studies, Traffic Research Unit (TRU).
DWI Citation Tracking System (CTS) – New Mexico Taxation and Revenue Department (NM TRD), Motor Vehicle Division
(MVD), DWI Citation Tracking System (CTS), as of October 2020. Repeat offenders are identified by the combination of account key, arrest date, and citation number. County data are based upon the county where the arrest took place. City data are based upon the city where the offender resides.
Urban Areas – Areas defined by the New Mexico Department of Transportation, Asset Management and Planning, 2010 U.S.
Census Urbanized Area Boundaries, NMDOT-Adjusted, and U.S. Census Urban Clusters, August 21, 2013. Urban areas for crash
years 2013-2017 include a 1/2 mile buffer extending out from those urban boundaries. In crashes before 2013, “urban” was
2010 42 4,768 12,196 17,006 22 244 332 598 2011 40 4,991 12,415 17,446 15 302 364 681 2012 68 4,279 12,216 16,563 28 244 370 642 2013 49 4,545 11,721 16,315 25 249 320 594 2014 65 5,018 13,007 18,090 33 286 316 635 2015 59 5,785 13,740 19,584 31 288 356 675 2016 95 6,171 13,230 19,496 49 310 330 689 2017 82 5,815 13,988 19,885 34 296 334 664 2018 88 5,854 13,699 19,641 37 269 358 664 2019 100 5,832 13,806 19,738 47 303 364 714
Figure 1: Alcohol-involved Fatal and Injury Crashes Compared with
Non-alcohol-involved Fatal and Injury Crashes in Bernalillo County, 2010-2019
Table 1: Total Crashes and Alcohol-involved Crashes by
Crash Severity in Bernalillo County, 2010-2019
Total Year
Total Crashes Alcohol-involved Crashes
Fatal Injury
Property Damage
Only
Total Fatal Injury
Property Damage Only
266
317
272
274
319
319
359
330
306
350
4,544
4,714
4,075
4,320
4,764
5,525
5,907
5,567
5,636
5,582
4,810
5,031
4,347
4,594
5,083
5,844
6,266
5,897
5,942
5,932
0 2,000 4,000 6,000 8,000 2010 2011 2012 2013 2014 2015 2016 2017 2018 20192015 2016 2017 2018 2019 January 1,576 1,367 1,601 1,615 1,655 1,563 February 1,692 1,520 1,544 1,530 1,586 1,574 March 1,648 1,581 1,745 1,640 1,681 1,659 April 1,582 1,406 1,726 1,423 1,646 1,557 May 1,614 1,631 1,700 1,492 1,684 1,624 June 1,584 1,439 1,438 1,520 1,542 1,505 July 1,583 1,421 1,585 1,510 1,542 1,528 August 1,505 1,836 1,790 1,662 1,717 1,702 September 1,699 1,783 1,768 1,865 1,646 1,752 October 1,794 1,897 1,846 1,955 1,715 1,841 November 1,625 1,774 1,482 1,669 1,690 1,648 December 1,682 1,841 1,660 1,760 1,634 1,715 Total Crashes 19,584 19,496 19,885 19,641 19,738 19,669 2015 2016 2017 2018 2019 January 60 59 53 61 55 58 February 62 79 60 57 53 62 March 54 62 54 53 71 59 April 69 47 67 55 42 56 May 59 51 52 39 69 54 June 60 47 40 41 49 47 July 48 49 55 53 70 55 August 54 59 55 54 59 56 September 62 58 62 68 64 63 October 62 67 55 54 61 60 November 47 52 46 59 61 53 December 38 59 65 70 60 58 Total Crashes 675 689 664 664 714 681
Table 2: Crashes by Month in Bernalillo County, 2015-2019
Table 3: Alcohol-involved Crashes by Month in Bernalillo County, 2015-2019
Month
Alcohol-involved Crashes 5-Year
Average Month
Crashes 5-Year
Figure 3: Alcohol-involved Crashes by Hour in Bernalillo County, 2019
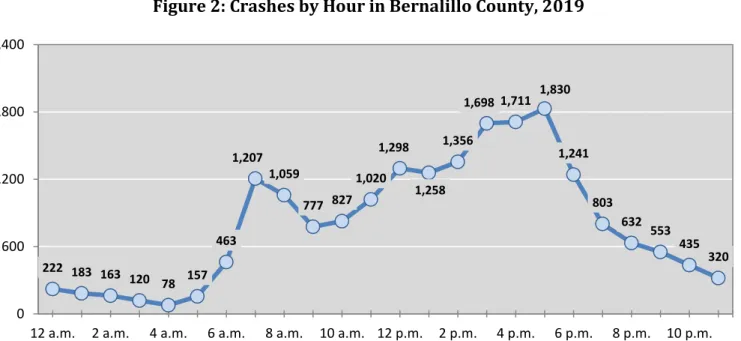
Figure 2: Crashes by Hour in Bernalillo County, 2019
* In 2019, Bernalillo County had 2 alcohol-involved crashes for which hour data were missing. * In 2019, Bernalillo County had 327 crashes for which hour data were missing.
222 183 163 120 78 157 463 1,207 1,059 777 827 1,020 1,298 1,258 1,356 1,698 1,711 1,830 1,241 803 632 553 435 320 0 600 1,200 1,800 2,400
12 a.m. 2 a.m. 4 a.m. 6 a.m. 8 a.m. 10 a.m. 12 p.m. 2 p.m. 4 p.m. 6 p.m. 8 p.m. 10 p.m.
48 40 45 21 9 10 9 6 5 4 8 8 11 12 17 24 33 44 49 49 57 76 72 55 0 30 60 90
2015 2016 2017 2018 2019 Sunday 106 102 103 107 125 109 Monday 75 64 64 85 87 75 Tuesday 69 78 72 64 68 70 Wednesday 90 95 82 77 89 87 Thursday 91 96 99 91 76 91 Friday 106 114 128 96 118 112 Saturday 138 140 116 144 151 138 Total Crashes 675 689 664 664 714 681 2015 2016 2017 2018 2019 Sunday 534 555 570 537 548 549 Monday 850 918 845 851 786 850 Tuesday 914 924 937 911 946 926 Wednesday 882 1,053 954 972 966 965 Thursday 881 952 903 886 956 916 Friday 992 1,048 1,008 1,000 1,001 1,010 Saturday 791 816 680 785 729 760 Total Crashes 5,844 6,266 5,897 5,942 5,932 5,976 2015 2016 2017 2018 2019 Sunday 45 36 52 47 68 50 Monday 77 82 82 74 85 80 Tuesday 94 94 74 76 96 87 Wednesday 64 92 83 76 84 80 Thursday 93 78 84 73 88 83 Friday 85 73 83 102 73 83 Saturday 52 51 53 80 89 65 Total Crashes 510 506 511 528 583 528 Day of Week
Pedestrian and Pedalcyclist Crashes 5-Year Average
Table 5: Fatal and Injury Crashes by Day of Week in Bernalillo County, 2015-2019
Day of Week
Fatal and Injury Crashes 5-Year
Average
Table 4: Alcohol-involved Crashes by Day of Week in Bernalillo County, 2015-2019
Day of Week
Alcohol-involved Crashes 5-Year
Average
Table 6: Pedestrian and Pedalcyclist Crashes by Day of Week in Bernalillo County,
2015-2019
Figure 5: Pedestrian and Pedalcyclist Crashes by Hour in Bernalillo County, 2019
Figure 4: Fatal and Injury Crashes by Hour in Bernalillo County, 2019
* In 2019, Bernalillo County had 6 crashes for which hour data were missing.
* In 2019, Bernalillo County had 1 crashes for which hour data were missing. 77 66 51 37 21 54 131 371 323 226 260 303 397 353 396 506 500 545 385 256 206 200 154 108 0 250 500 750
12 a.m. 2 a.m. 4 a.m. 6 a.m. 8 a.m. 10 a.m. 12 p.m. 2 p.m. 4 p.m. 6 p.m. 8 p.m. 10 p.m.
8 8 4 1 0 2 14 44 27 15 22 29 26 29 43 56 33 33 47 35 29 36 25 16 0 13 26 39 52 65
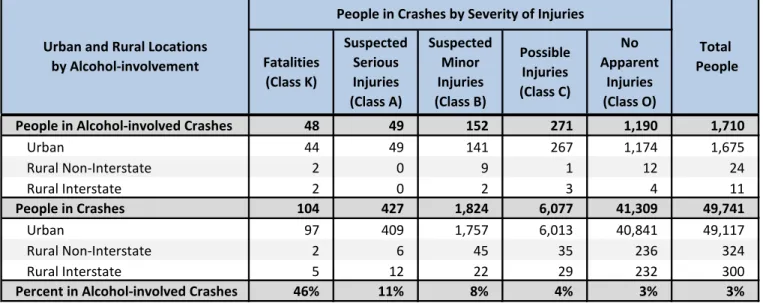
People in Alcohol-involved Crashes 48 49 152 271 1,190 1,710 Urban 44 49 141 267 1,174 1,675 Rural Non-Interstate 2 0 9 1 12 24 Rural Interstate 2 0 2 3 4 11 People in Crashes 104 427 1,824 6,077 41,309 49,741 Urban 97 409 1,757 6,013 40,841 49,117 Rural Non-Interstate 2 6 45 35 236 324 Rural Interstate 5 12 22 29 232 300
Percent in Alcohol-involved Crashes 46% 11% 8% 4% 3% 3%
2015 2016 2017 2018 2019
Total Rural Interstate 73 107 88 61 135 93
Fatal Crash 1 2 3 1 4 2
Injury Crash 25 28 28 20 48 30
Property Damage Only Crash 47 77 57 40 83 61
Total Rural Non-Interstate 148 112 102 178 163 141
Fatal Crash 3 2 0 7 2 3
Injury Crash 49 38 42 60 61 50
Property Damage Only Crash 96 72 60 111 100 88
Total Urban 19,363 19,277 19,695 19,402 19,440 19,436
Fatal Crash 55 91 79 80 94 80
Injury Crash 5,711 6,105 5,745 5,774 5,723 5,812
Property Damage Only Crash 13,597 13,081 13,871 13,548 13,623 13,544
Table 7: Severity of Injuries to People in Crashes by
Rural and Urban Location in Bernalillo County, 2019
Fatalities (Class K) Suspected Serious Injuries (Class A) Suspected Minor Injuries (Class B) Possible Injuries (Class C) No Apparent Injuries (Class O) People in Crashes by Severity of Injuries
Crash Severity by System Crashes by Year 5-Year
Average Urban and Rural Locations
by Alcohol-involvement
Total People
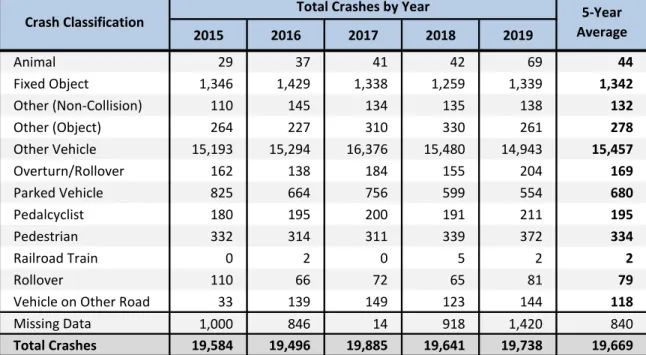
2015 2016 2017 2018 2019 Animal 29 37 41 42 69 44 Fixed Object 1,346 1,429 1,338 1,259 1,339 1,342 Other (Non-Collision) 110 145 134 135 138 132 Other (Object) 264 227 310 330 261 278 Other Vehicle 15,193 15,294 16,376 15,480 14,943 15,457 Overturn/Rollover 162 138 184 155 204 169 Parked Vehicle 825 664 756 599 554 680 Pedalcyclist 180 195 200 191 211 195 Pedestrian 332 314 311 339 372 334 Railroad Train 0 2 0 5 2 2 Rollover 110 66 72 65 81 79
Vehicle on Other Road 33 139 149 123 144 118
Missing Data 1,000 846 14 918 1,420 840 Total Crashes 19,584 19,496 19,885 19,641 19,738 19,669 2015 2016 2017 2018 2019 Bus 198 260 216 215 228 223 Motorcycle/ATV 496 478 446 409 430 452 Passenger 20,619 22,792 23,474 23,298 22,653 22,567 Pedalcyclist 182 197 205 195 213 198 Pedestrian 337 336 320 349 391 347 Pickup 5,031 5,619 5,717 5,782 5,876 5,605 Semi 694 745 743 745 801 746 Van/SUV/4WD 5,097 5,892 6,182 5,939 6,411 5,904 Other Vehicle 878 115 78 202 44 263 Missing Data 5,603 2,679 2,511 2,341 2,616 3,150 Total Vehicles 39,135 39,113 39,892 39,475 39,663 39,456
1 Pedestrians and pedalcyclists are counted as non-motorized vehicles, when involved in a crash with
a motor vehicle. See Page 17 for data on drivers of non-motorized vehicles in crashes (i.e. pedestrians and pedalcyclists).
Vehicle Type 1
Vehicles in Crashes by Vehicle Type 5-Year Average
Table 9: Total Crashes by Crash Classification in Bernalillo County, 2015-2019
Crash Classification
Total Crashes by Year 5-Year
Average
Bus Motor-
cycle Passenger Pickup Semi
Van 4WD SUV Other Vehicle Missing Data 15-19 0 22 2,299 281 4 374 0 59 3,039 20-24 9 58 3,216 446 29 460 0 85 4,303 25-29 14 51 2,614 461 74 568 1 55 3,838 30-34 10 58 2,103 544 93 667 1 60 3,536 35-39 15 35 1,786 510 90 600 0 52 3,088 40-44 15 26 1,407 481 84 524 2 40 2,579 45-49 23 32 1,210 410 89 425 2 35 2,226 50-54 33 45 1,179 376 67 382 2 29 2,113 55-59 30 32 1,074 417 64 388 5 34 2,044 60-64 42 23 1,022 366 61 326 2 33 1,875 65-69 6 9 777 217 22 294 2 29 1,356 70 + 11 6 1,381 313 9 440 6 50 2,216 Missing Data 20 33 2,585 1,054 115 963 21 2,055 6,846 Total Drivers 228 430 22,653 5,876 801 6,411 44 2,616 39,059 Bus Motor-
cycle Passenger Pickup Semi
Van 4WD SUV Other Vehicle Missing Data 15-19 0 1 31 5 0 6 0 1 44 20-24 0 1 94 17 0 10 0 1 123 25-29 0 1 73 11 0 7 0 1 93 30-34 0 3 69 17 0 12 0 0 101 35-39 0 1 39 11 0 11 0 0 62 40-44 0 0 36 11 0 4 0 0 51 45-49 0 1 22 10 1 11 0 0 45 50-54 0 1 27 6 0 4 0 0 38 55-59 0 4 13 4 0 4 0 0 25 60-64 0 2 8 6 0 1 0 1 18 65-69 0 1 7 1 0 5 0 0 14 70 + 0 0 5 1 0 1 0 0 7 Missing Data 0 0 20 4 0 3 0 4 31 Total Drivers 0 16 444 104 1 79 0 8 652 Age Groups
Alcohol-involved Motor Vehicle1 Drivers by Vehicle Type and Age Group
Total Drivers
1 See Page 17 for data on drivers of non-motorized vehicles in crashes (i.e. pedestrians and pedalcyclists).
Table 11: Motor Vehicle Drivers in Crashes by Vehicle Type
and Age Group in Bernalillo County, 2019
Age Groups
Motor Vehicle1 Drivers by Vehicle Type and Age Group
Total Drivers
Table 12: Alcohol-involved Motor Vehicle Drivers in Crashes by Vehicle Type
and Age Group in Bernalillo County, 2019
Figure 7: Alcohol-involved Motor Vehicle Drivers in Crashes by
Age Group and Sex in Bernalillo County, 2019
Age Group and Sex in Bernalillo County, 2019
* In 2019, Bernalillo County had 7254 drivers in crashes for which age or sex data were missing.
* In 2019, Bernalillo County had 32 drivers in crashes for which age or sex data were missing.
1 ,5 0 6 2 ,2 4 5 1 ,9 6 0 1 ,8 7 0 1 ,6 4 0 1 ,3 8 2 1 ,2 0 2 1 ,1 3 8 1 ,1 1 8 1 ,0 6 2 720 1 ,2 3 4 1 ,4 8 3 1 ,9 9 8 1 ,8 3 2 1 ,6 1 3 1 ,4 2 4 1 ,1 5 4 1 ,0 0 3 949 900 789 619 964 0 1,000 2,000 3,000 15-19 20-24 25-29 30-34 35-39 40-44 45-49 50-54 55-59 60-64 65-69 70 +
M
o
to
r Ve
h
ic
le
Dr
iv
er
s
in
C
ra
sh
es
Male
Female
27 75 57 70 40 40 26 23 19 15 8 5 17 47 36 31 22 11 19 15 6 3 6 2 0 20 40 60 80 100 120 15-19 20-24 25-29 30-34 35-39 40-44 45-49 50-54 55-59 60-64 65-69 70 +A
lc
o
h
o
l-in
vo
lv
ed
M
o
to
r Ve
h
ic
le
Dr
iv
e
rs
in
C
ra
sh
e
s
Male
Female
2015 2016 2017 2018 2019
15
0 1 0 0 2 316
1 3 0 0 4 817
3 7 4 4 9 2718
7 13 11 9 17 5719
8 14 11 15 12 6020
18 16 20 16 16 86 Total Drivers 37 54 46 44 60 241Male Female Male Female
15 55 59 114 3% 1 1 2 3% 16 230 224 454 12% 3 1 4 7% 17 347 343 690 18% 4 5 9 15% 18 439 429 868 22% 11 6 17 28% 19 435 428 863 22% 8 4 12 20% 20 467 449 916 23% 9 7 16 27% Total Drivers 1,973 1,932 3,905 100% 36 24 60 100%
1 For analysis of drivers under age 21, when the driver age or sex are not identified on the crash report (typically
hit-and-run drivers), the driver data are considered unreliable and are excluded from the analysis.
Table 13: Alcohol-involved Motor Vehicle Drivers Under 21 (Ages 15-20) in Crashes
in Bernalillo County, 2015-2019
Table 14: Motor Vehicle Drivers Under 21 (Ages 15-20) in Crashes
by Age, Sex and Alcohol-involvement in Bernalillo County, 2019
Age1 Year 5-Year Total Sex Sex Age1 Percent of Total Total Drivers
Total Drivers Alcohol-involved Drivers
Total Drivers
Percent of Total
Human 240 9,522 19,341 29,103
Driver Inattention 37 3,561 6,817 10,415
Failed to Yield Right of Way 12 1,253 1,832 3,097
Following Too Closely 1 783 1,897 2,681
Other Improper Driving 16 588 1,343 1,947
Excessive Speed 29 556 1,107 1,692
Disregarded Traffic Signal 7 660 861 1,528
Made Improper Turn 2 296 1,007 1,305
Improper Lane Change 3 189 993 1,185
Speed Too Fast for Conditions 9 290 680 979
Avoid No Contact - Vehicle 2 317 612 931
Alcohol Involved 49 310 365 724
Improper Overtaking 1 100 536 637
Passed Stop Sign 0 123 198 321
Improper Backing 0 30 276 306
Drove Left Of Center 6 48 203 257
Avoid No Contact - Other 3 79 158 240
Cell Phone 1 54 137 192
Vehicle Skidded Before Brake 0 48 134 182
Pedestrian Error 25 132 13 170
Drug Involved 36 47 61 144
Failed to Yield to Police Vehicle 1 24 34 59
High Speed Pursuit 0 18 21 39
Failed to Yield to Emergency Vehicle 0 10 22 32
Driverless Moving Vehicle 0 2 26 28
Texting 0 4 8 12
Vehicle 1 201 490 692
Inadequate Brakes 1 88 215 304
Other Mechanical Defect 0 75 162 237
Defective Tires 0 18 61 79
Defective Steering 0 20 52 72
Environment 1 22 47 70
Road Defect 1 11 38 50
Traffic Control Not Functioning 0 11 9 20
Low Visibility Due to Smoke 0 0 0 0
Other 98 6,039 9,731 15,868
None 90 5,078 7,652 12,820
Other - No Driver Error 8 961 2,079 3,048
1 Multiple contributing factors may be reported for any vehicle in a crash.
Contributing Factors Frequency in Fatal Crashes Frequency in Injury Crashes Frequency in Property Damage Only Crashes Frequency in All Crashes Frequency of Contributing Factor1 by Crash Severity
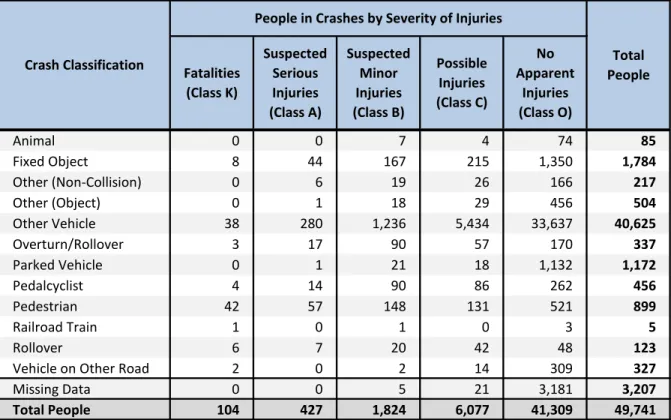
Animal 0 0 7 4 74 85 Fixed Object 8 44 167 215 1,350 1,784 Other (Non-Collision) 0 6 19 26 166 217 Other (Object) 0 1 18 29 456 504 Other Vehicle 38 280 1,236 5,434 33,637 40,625 Overturn/Rollover 3 17 90 57 170 337 Parked Vehicle 0 1 21 18 1,132 1,172 Pedalcyclist 4 14 90 86 262 456 Pedestrian 42 57 148 131 521 899 Railroad Train 1 0 1 0 3 5 Rollover 6 7 20 42 48 123
Vehicle on Other Road 2 0 2 14 309 327
Missing Data 0 0 5 21 3,181 3,207
Total People 104 427 1,824 6,077 41,309 49,741
Table 16: People in Crashes by Crash Classification and
Severity of Injuries in Bernalillo County, 2019
People in Crashes by Severity of Injuries
Crash Classification Total
People Fatalities (Class K) Suspected Serious Injuries (Class A) Suspected Minor Injuries (Class B) Possible Injuries (Class C) No Apparent Injuries (Class O)
Male Percent of Male Female Percent of Female 0-4 2 2% 4 5% 6 5-9 4 5% 3 4% 7 10-14 3 4% 6 8% 9 15-19 11 13% 19 24% 30 20-24 13 16% 7 9% 20 25-29 7 9% 16 20% 23 30-34 9 11% 4 5% 13 35-39 6 7% 3 4% 9 40-44 7 9% 1 1% 8 45-49 2 2% 4 5% 6 50-54 3 4% 3 4% 6 55-59 4 5% 3 4% 7 60-64 4 5% 1 1% 5 65-69 4 5% 0 0% 4 70 + 3 4% 2 3% 5 Missing Data 0 0% 3 4% 3 Total People 82 100% 79 100% 161
Figure 8: Seatbelt Use by People in Crashes with Fatal or
Suspected Serious Injuries in Bernalillo County, 2015-2019
1 People injured are in one of three categories: suspected serious injury, suspected minor injury, or possible injury. 2 Excludes people in or on buses, heavy trucks, motorcycles, or ATVs.
Age Groups
Unbelted People Killed or Injured 1,2
Total People
77%
69%
76%
75%
78%
10%
14%
11%
15%
13%
13%
16%
14%
10%
9%
0%
25%
50%
75%
100%
2015
2016
2017
2018
2019
Figure 9: People in Crashes by Age Group and Sex in Bernalillo County, 2019
* In 2019, Bernalillo County had 8006 people in crashes for which age or sex data were missing.
* In 2019, Bernalillo County had 170 people in alcohol-involved crashes for which age or sex data were missing.
Figure 10: People in Alcohol-involved Crashes
by Age Group and Sex in Bernalillo County, 2019
12 16 10 83 137 126 126 91 84 64 55 43 36 20 25 12 17 11 67 116 78 61 54 44 36 35 25 28 11 17 0 60 120 180 240 0-4 5-9 10-14 15-19 20-24 25-29 30-34 35-39 40-44 45-49 50-54 55-59 60-64 65-69 70 +
Peo
p
le
in
Al
co
h
o
l-in
vo
lv
e
d
C
ra
sh
e
s
Male
Female
567 549 538 2 ,1 5 3 2,6 3 4 2 ,2 8 5 2 ,1 3 2 1 ,8 6 8 1 ,5 3 7 1 ,3 7 0 1 ,2 9 8 1 ,2 4 8 1 ,1 9 2 806 1 ,3 8 0 535 609 610 2 ,2 9 7 2 ,5 1 3 2 ,2 0 1 1 ,9 1 3 1 ,7 0 3 1 ,3 6 8 1 ,1 9 0 1 ,1 0 9 1 ,0 9 0 976 781 1 ,2 8 3 0 1,200 2,400 3,600 0-4 5-9 10-14 15-19 20-24 25-29 30-34 35-39 40-44 45-49 50-54 55-59 60-64 65-69 70 +Peo
p
le
in
C
ra
sh
es
Male
Female
2015 2016 2017 2018 2019 0-4 4 6 2 4 2 18 5-9 12 13 17 9 8 59 10-14 37 24 23 26 26 136 15-19 36 46 43 46 47 218 20-24 51 54 36 39 44 224 25-29 65 53 57 55 60 290 30-34 37 43 52 78 52 262 35-39 32 37 40 39 60 208 40-44 44 43 39 34 42 202 45-49 26 38 41 30 41 176 50-54 38 46 35 39 51 209 55-59 43 33 24 40 47 187 60-64 20 30 37 30 44 161 65-69 16 17 23 20 24 100 70 + 24 17 19 19 24 103 Missing Data 34 33 37 36 32 172 Total People 519 533 525 544 604 2,725 Total Pedalcyclists 4 14 88 85 22 213 Involved 0 0 1 2 0 3 Not Involved 4 14 87 83 22 210 Total Pedestrians 42 55 138 123 33 391 Involved 27 6 21 11 4 69 Not Involved 15 49 117 112 29 322 Total People 46 69 226 208 55 604
1 Pedestrians and pedalcyclists are counted as non-motorized vehicles, when involved in a crash with a motor vehicle.
Table 18: Pedestrians and Pedalcyclists in Crashes by Age Group in
Bernalillo County, 2015-2019
Possible Injuries (Class C) No Apparent Injury (Class O) Alcohol InvolvementPedestrians and Pedalcyclists1 in Crashes
Total People Fatalities (Class K) Suspected Serious Injuries (Class A) Suspected Minor Injuries (Class B)
Table 19: Pedestrians and Pedalcyclists in Crashes by Alcohol Involvement
and Severity of Injuries in Bernalillo County, 2019
Age Groups Pedestrians and Pedalcyclists
1
in Crashes 5-Year
Total People
Figure 11: DWI Arrests in Bernalillo County,
Showing First and Repeat DWI Arrests, 2015-2019
Figure 12: DWI Convictions in Bernalillo County,
Showing First and Repeat DWI Convictions, 2015-2019
*Values are based upon the year of the conviction. *Values are based upon the year of the arrest.
1,056 837 938 1,075 1,139 580 458 526 386 481 1,636 1,295 1,464 1,461 1,620 0 500 1,000 1,500 2,000 2015 2016 2017 2018 2019
C
o
n
vi
cti
o
n
s
First DWI Convictions
Repeat DWI Convictions
Total DWI Convictions
1,599 1,460 1,583 1,674 1,781 1,051 963 1,043 1,097 1,068 2,650 2,423 2,626 2,771 2,849 0 900 1,800 2,700 3,600 2015 2016 2017 2018 2019 A rr est s
2015 2016 2017 2018 2019 Sunday 487 414 497 495 542 487 Monday 156 175 140 183 180 167 Tuesday 186 145 142 143 168 157 Wednesday 279 255 223 268 261 257 Thursday 384 319 339 401 368 362 Friday 546 530 557 564 549 549 Saturday 612 585 728 717 781 685 Total Arrests 2,650 2,423 2,626 2,771 2,849 2,664
Figure 13: DWI Arrests by Hour in Bernalillo County, 2019
* In 2019, Bernalillo County had 264 arrests for which hour data were missing.
Table 20: DWI Arrests by Day of Week in Bernalillo County, 2015-2019
Day of Week Year 5-Year
Average 376 428 425 104 46 22 17 11 8 6 10 16 14 17 30 42 52 56 59 73 123 141 209 300 0 100 200 300 400 500
2015 2016 2017 2018 2019 15-19 94 87 95 90 108 20-24 505 456 461 542 536 25-29 339 335 364 391 423 30-34 234 178 230 201 239 35-39 133 129 146 121 163 40-44 78 81 85 92 104 45-49 89 68 74 83 75 50-54 52 55 50 59 51 55-59 38 41 40 50 32 60-64 18 16 21 20 30 65-69 15 10 14 16 11 70 + 4 4 3 8 9 Missing Data 0 0 0 1 0 Total Drivers 1,599 1,460 1,583 1,674 1,781 2015 2016 2017 2018 2019 15-19 3 4 5 5 8 20-24 112 77 76 102 124 25-29 211 169 187 209 154 30-34 208 188 195 187 203 35-39 146 139 159 183 172 40-44 111 103 123 125 128 45-49 96 95 96 98 97 50-54 78 90 79 65 77 55-59 38 57 71 76 54 60-64 28 20 29 24 32 65-69 14 11 17 17 14 70 + 5 10 6 6 5 Missing Data 1 0 0 0 0 Total Drivers 1,051 963 1,043 1,097 1,068
1 Values are based upon the year of the arrest.
Table 21: Driver First DWI Arrests by Age Group in Bernalillo County, 2015-2019
Age Groups Driver First DWI Arrests
1
Age Groups Driver Repeat DWI Arrests
1
Table 22: Driver Repeat DWI Arrests by Age Group in Bernalillo County, 2015-2019
2015 2016 2017 2018 2019 15-19 57 34 39 57 47 20-24 339 249 272 294 352 25-29 232 189 213 265 268 30-34 155 112 143 157 142 35-39 95 85 87 93 102 40-44 54 47 55 63 69 45-49 51 46 41 59 55 50-54 37 27 37 31 41 55-59 18 24 29 26 32 60-64 10 14 8 9 19 65-69 4 8 9 17 8 70 + 4 2 5 4 4 Missing Data 0 0 0 0 0 Total Drivers 1,056 837 938 1,075 1,139 2015 2016 2017 2018 2019 15-19 1 2 0 2 2 20-24 51 32 34 27 40 25-29 106 82 92 75 72 30-34 115 106 114 75 91 35-39 69 61 71 58 93 40-44 68 44 55 48 60 45-49 69 46 67 29 36 50-54 54 37 50 29 34 55-59 30 30 22 32 32 60-64 10 10 15 4 14 65-69 6 4 3 6 4 70 + 1 4 3 1 3 Missing Data 0 0 0 0 0 Total Drivers 580 458 526 386 481
1 Values are based upon the year of the conviction.
Table 23: Driver First DWI Convictions by Age Group in Bernalillo County, 2015-2019
Table 24: Driver Repeat DWI Convictions by Age Group in Bernalillo County, 2015-2019
Age Groups Driver Repeat DWI Convictions
1
Age Groups Driver First DWI Convictions
1
Court Disposition of DWI Arrest1 Bernalillo County Statewide Percent of Statewide
Total DWI Arrests 2,849 10,376 27%
DWI Arrests Resulting in
Convictions 1,348 4,597 29%
DWI Arrests Resulting in
Dismissals2 448 887 51%
DWI Arrests Awaiting
Disposition 1,053 4,892 22% 1 2 Bernalillo County Statewide DWI Conviction 190 159 31 DWI Dismissal 173 160 13
These are the number of DWI arrests in 2019 and whether the case resulted in a conviction or dismissal, or is still awaiting court disposition, as reported in the NM MVD Citation Tracking System (CTS) as of October 2020.
Table 25: Court Disposition of DWI Arrests for the State and Bernalillo County, 2019
Table 26: Average Number of Days from Date of DWI Arrest
to Date of Court Disposition for the State and Bernalillo County, 2019
For this table, a very small number of "not guilty" rulings may be included in the category Dismissals.
Court Disposition
Deviation from Statewide
Average Average Number of Days
2015 877 472 918 383 2,650
2016 857 396 723 447 2,423
2017 991 403 679 553 2,626
2018 1,041 438 556 736 2,771
2019 1,022 326 448 1,053 2,849
*Table 27 contains the values used to calculate percentages shown in Figure 14.
Table 27: Court Disposition of DWI Arrests in Bernalillo County, 2015-2019
Figure 14: Court Dispositions by Percentage of DWI Arrests in Bernalillo County, 2015-2019
1 Values are based upon the year of the arrest.
First DWI Conviction Repeat DWI Conviction Dismissed Awaiting Disposition Year of DWI Arrest1 Total DWI Arrests Court Disposition 33% 35% 38% 38% 36% 18% 16% 15% 16% 11% 35% 30% 26% 20% 16% 14% 18% 21% 27% 37% 2,650 2,423 2,626 2,771 2,849 0% 25% 50% 75% 100% 2015 2016 2017 2018 2019