ISSN: 2147-611X
www.ijemst.com
The Effects of Mathematics Anxiety and
Motivation on Students’ Mathematics
Achievement
Nadide Suren1, Mehmet Ali Kandemir2 1 Derekoy Middle School
2
Balikesir University
To cite this article:
Suren, N., & Kandemir, M. A. (2020). The effects of mathematics anxiety and motivation on
students’ mathematics achievement.
International Journal of Education in Mathematics,
Science and Technology, 8
(3), 190-218.
This article may be used for research, teaching, and private study purposes.
Any substantial or systematic reproduction, redistribution, reselling, loan, sub-licensing,
systematic supply, or distribution in any form to anyone is expressly forbidden.
Authors alone are responsible for the contents of their articles. The journal owns the
copyright of the articles.
Volume 8, Number 3, 2020
The Effects of Mathematics Anxiety and Motivation on Students’
Mathematics Achievement
Nadide Suren, Mehmet Ali Kandemir
Article Info
Abstract
Article History
Received: 26 January 2020
This study aims to investigate whether there is an effect of anxiety and motivation, and if so, the level of this effect on students’ mathematics achievement in the transition test from middle school to high school. In this research, anxiety and motivation levels of the students were examined together with variables such as gender, pre-school education, support and training courses, and private tutoring. The sample of the study consisted of 777 eighth-grade students in a province of Aegean region of Turkey. Mathematical Motivation Scale (MMS) and Mathematics Anxiety Scale for Elementary School Students (MASESS) were used as data collection tools. In addition, the demographic information of the students was obtained with the personal information form developed by the researcher. Descriptive analysis, independent samples t-test, correlation analysis, and structural equation modeling analysis were used for data analysis. According to the results of the study, the mathematics anxiety and motivation levels of middle school eighth-grade students were high and there was a positive and moderate relationship between mathematics anxiety and motivation towards mathematics. It was also determined that anxiety predicted achievement at a higher level, followed by motivation.
Accepted: 06 May 2020
Keywords
Mathematics anxiety Motivation towards mathematics Mathematics achievement Structural equation modeling
Introduction
Emotions and cognition have been investigated by educators since the 1960s. Similarly, emotional factors in learning mathematics have been actively studied for nearly fifty years. Because of the importance of mathematics, many studies have been conducted to investigate the factors that affect students’ achievement in this discipline (Dowker, Sarkar, & Looi, 2016; Kyttälä & Björn, 2010; Newstead, 1998; Otts, 2010; Spaniol, 2017; Woodard, 2004) and there are many continuing studies (Mundia & Metussin, 2019; Scammacca, Fall, Capin, Roberts, & Swanson, 2019). Among these studies, McLeod (1994) stressed that anxiety has been the most striking factor in emotional issues since the 1970s. Therefore, mathematics anxiety has an important role in students’ learning mathematics (Şentürk, 2010).
Mathematics anxiety may not always completely disrupt the development of mathematical skills. Research shows that moderate mathematics anxiety is beneficial rather than harming intrinsically motivated students (Wang et al., 2015). For this reason, the combination of moderate mathematics anxiety and intrinsic motivation can increase students’ mathematics achievement; this can also help students enjoy the learning process more. In addition, determining the appropriate levels of difficulty for students by taking their mathematical abilities into account is important for mathematics education (Wang et al., 2015).
Researchers have stated that many variables are effective on students’ motivation and using these variables in a way that positively affects students’ achievement is important (Anderman et al., 1999). Motivation is effective on learning and behavior; however, although this effect is known, it is often not known how motivation should be used in the teaching and learning process or what it really means. This, in turn, causes motivation to be underestimated or ignored in an instructional design (Spitzer, 1996). Therefore, teaching will be ineffective as a result of ignoring motivation. In order to increase academic achievement in mathematics, further research is needed on how mathematics anxiety is related to motivation and especially whether there are differences between anxiety and intrinsic and extrinsic motivation (Gottfried, 1982; Hung, Huang, & Hwang, 2014; Núñez-Peña, Suárez-Pellicioni, & Bono, 2013; Ryan & Pintrich, 1997; Zakaria & Nordin, 2008).
In this research, investigating to what extent these factors affect students’ mathematics achievement was aimed because the achievement levels of Turkish students in mathematics in the international field is not at the desired level. This is supported by the fact that Turkish students among students from 79 countries, 35 of which are OECD members, rank 42th in mathematics, their average mathematics score is below OECD countries, and the students’ performance is low in the PISA 2018 results (OECD, 2019). Mathematics anxiety and motivation towards mathematics are thought to be the reasons why Turkish students did not perform at the desired level in mathematics (Yonca, 2018).
Mathematics anxiety, an emotional factor found in the literature, has been one of the most important reasons why students do not like mathematics (Shen, 2009). Therefore, overcoming mathematics anxiety is an important recipe in helping students succeed and grow in mathematics. By understanding, recognizing, controlling, and dealing with mathematics anxiety, students can advance in mathematics more than ever before (Boaler, 2008; Tobias, 1993). Motivation, which is another emotional factor, is very important in education and it should not be ignored especially in courses that are difficult to understand by students such as science and mathematics (Dede & Yaman, 2008). According to Tahiroğlu and Çakır (2014), motivation is a prerequisite for learning. Most of the time, students learn the subjects they are curious about and interested in a short time. Students who are not motivated enough are also not ready to learn, and if they are motivated enough, they will succeed to the extent that they are more motivated to study their homework and exams. In other words, there is a positive correlation between motivation and achievement (Akbaba, 2006).
Along with the anxiety and motivation variables, there are other variables that affect mathematics achievement. Some of these variables are concerns of this research for historical reasons. Gender, as the first sub-concern, is a very important variable in terms of mathematics achievement, mathematics anxiety, and motivation towards mathematics. The effect of gender on mathematics anxiety has not reached a clear conclusion. While some studies showed significant differences in favor for male gender on mathematics anxiety (Ma & Xu, 2004), some studies showed no significant difference of gender on mathematics anxiety (Cooper & Robinson, 1991; Hendershot 2000; Recber, Isiksal, & Koç, 2018; Zettle & Houghton, 1998). Similarly, the effect of gender variable on motivation towards mathematics is questionable. While some studies showed significant differences in favor for male gender on motivation towards mathematics (Preckel, Goetz, Pekrun, & Kleine, 2008; Skaalvik & Rankin, 1994), some studies showed no significant difference of gender on mathematics anxiety or significant differences in favor for female gender (Kriegbaum, Jansen, & Spinath, 2015; Pajares & Graham, 1999; Uluçay & Güven, 2017; Yaman & Dede, 2007).
Second sub-concern of this research is students’ status of receiving pre-school education. When the literature is reviewed, the studies showed that receiving pre-school education affected students’ mathematics achievement in a positive way (Altun & Çakan, 2008; Dağlı, 2007; Ergün, 2003; Güven & Balat, 2006). In addition, studies showed that students who received pre-school education had lower level of mathematics anxiety (Aktan, 2012), while students who received pre-school education had higher level of motivation towards mathematics (Aktan, 2012; McCleland, Acock, & Morrison, 2006).
Third sub-concern of this research is students’ status of receiving help in the support and training courses provided by the Ministry of National Education in each school for free of charge. The purpose of the support and training courses, which have been implemented since 2014 in Turkey, is to find a solution for different searches in parents, since students are taken to a higher institution with central examination. There are not many studies regarding this variable in the literature. In the limited number of studies, researchers found that receiving support and training courses increased student’s mathematics achievement and motivations towards mathematics (Berk, 2018; Nartgün & Dilekçi, 2016).
According to this finding, students who receive help from private tutors exhibit a better performance in mathematics (Anılan, 2004; Berk, 2018; Koca, 2011; Topal, Aksu, & Güneş, 2017). However, there are different findings regarding the mathematics anxiety. While some of these studies found that students who receive help from private tutors had higher level of mathematics anxiety (Delioğlu, 2017), other studies found that students who receive help from private tutors had lower level of mathematics anxiety (Koca, 2011; Yetgin, 2017).
Specifically, the aim of this study is to investigate the relationship between mathematics anxiety and motivation towards mathematics and how and to what extent mathematics anxiety and motivation towards mathematics of middle school eighth-grade students affect the students’ mathematics performance in the High School Entrance Exam (HSEE). HSEE was chosen as the achievement criterion because mathematics content in this exam has the highest coefficient while determining students’ overall performance. Also, the score that students receive from this exam determines which high schools they will be attending to. That is another reason why students’ performance in this exam was counted as achievement criterion.
Therefore, in the research, an answer to the question of “is there any effect of anxiety and motivation on the mathematics achievement of eight-grade students in the HSEE, and if so, to what extent this effect is?” was sought along with the following sub-questions.
1. What is the level of middle school eighth-grade students’ anxiety towards mathematics? 2. What is the level of middle school eighth-grade students’ motivation towards mathematics?
3. Do middle school eighth-grade students’ anxiety and motivation levels towards mathematics differ in terms of gender, pre-school education, support and training courses, and private tutoring?
4. Are middle school eighth-grade students’ anxiety and motivation towards mathematics related?
5. Are middle school eighth-grade students’ anxiety and motivation towards mathematics significant predictors of their mathematics achievement in the High School Entrance Exam?
Theoretical Framework
Factors Affecting Mathematics Achievement
In learning, not only cognitive factors and processes, but also environmental (Wood & Bandura, 1989) and emotional (Bloom, 1979) factors play a role. That is why surveys that measure emotional characteristics, school environment, and home environment along with achievement tests are given to the students in the international exams such as TIMSS and PISA. Thus, both the achievement levels of the students are measured, and information is collected about the other variables that are thought to be related to achievement (IEA, 2019; OECD, 2019). While measuring students’ achievement levels, information on other variables can also be obtained (Ertürk & Erdinç-Akan, 2018; Tas & Balgalmis, 2016; Yildirim & Aybek, 2019).
Acar-Güvendir (2016) conducted a study examining the relationship between intrinsic and extrinsic motivation levels and mathematical achievement of eighth-grade students and used TIMSS data in 2011 in this context. The results of the research showed that students’ interests in mathematics, self-efficacy, mathematics perceptions, frequency of mathematics exams, and teachers’ interest in students were related to mathematics achievement. The findings showed that intrinsic motivation is associated with mathematics achievement more than extrinsic motivation. A general analysis of the study also showed that mathematics achievement is related to both intrinsic and extrinsic motivation sources that need to be addressed by mathematics experts and teachers (Becker, McElvany, & Kortenbruck, 2010; Vansteenkiste, Timmermans, Lens, Soenens, & Van den Broeck, 2008).
In an academic study based on the results of the PISA 2003 study, emotional factors related to mathematics literacy of students were evaluated. In this study, the implicit variables examined in relation to mathematics literacy were indicated as motivation, interest and anxiety towards mathematics, efficacy and self-confidence in mathematics, feeling of belonging to school, and classroom discipline and environment. The most related variable with mathematics literacy was self-efficacy in mathematics (Güzel, 2006). According to the results of the study, although generally Turkish students had positive attitudes towards mathematics, their self-confidence levels were low and anxiety levels towards mathematics were high. Unfortunately, these positive attitudes of students towards mathematics cannot be directed to increase academic achievement in education system (MoNE, 2016a).
Anxiety
In the literature review, many definitions of anxiety were encountered. According to Hembree (1990), anxiety involves a multifaceted structure, and these structures have been widely defined as a mood supported by fear. This feeling is not pleasant, it is directed towards the future, and is different than the threat. Anxiety is a feeling that usually causes discomfort, and sometimes it encourages people to be creative and constructive in daily life but sometimes it prevents them to do so (Başarır, 1990).
There are more consistent findings in the literature about the components of anxiety. Previously, it was stated that anxiety has cognitive, physiological, and behavioral components (Hardy & Peafitt, 1991; Rachman & Hodgson, 1974), then cognitive and emotional processes were accepted as independent systems. According to Benner (1985, p.65), “anxiety can be defined as a sense of subjective tension and worry that emerges with a certain combination of cognitive, emotional, physiological, and behavioral signs”. Thus, it is widely accepted that anxiety consists of cognitive, emotional, physiological, and behavioral components (Eisenberg & Patterson, 1979; Köksal & Power, 1990).
Spielberger (1972) distinguishes between the two types of anxiety as state anxiety and trait anxiety (Cheng & Cheung, 2005; Rabalais, 1998). Anxiety is a severe reaction to some perceived threats. It is relatively short-lived and only occasionally occurs throughout the life of an individual. Trait anxiety is a more consistent and customary emotional response to life events.
Anxiety and Mathematics
Mathematics anxiety is seen as a state anxiety that has been investigated by educators and emerged in perceived situations related to the use of mathematics (Byrd, 1982). Mathematics anxiety is an emotional reaction that has indirect effects with poor mathematics performance in terms of education and career path choice and direct effects in terms of life-long events (Hembree, 1990). Mathematics anxiety occurs in situations involving mathematical activities (Suinn & Winston, 2003). Mathematics anxiety is often defined as tension, worry, and fear that interfere with mathematics performance (Ashcraft, 2002). These strong emotions begin at different stages in students’ educational journey (Siebers, 2015).
According to the other definitions in the literature review, mathematics anxiety is one of the most important reasons that lead people to negative thoughts about mathematics and leave them helpless (Bekdemir, 2009), is an irrational state and fear that reduces mathematics learning opportunities and restricts career choices (Haase, Guimarães, & Wood, 2019), and makes students stand in wonder when they think about mathematics. Thus, it prevents students from exhibiting their own potential and leads them to failure (Miller & Mitchell, 1994).
Effects of Mathematics Anxiety
future situation of mathematics. In this respect, the effects of mathematics anxiety are very debilitating. Students who have mathematics anxiety are less self-confident, do not enjoy mathematics, and avoid mathematics completely (Ashcraft, Kirk, & Hopko, 1998; Hembree, 1990; Maloney & Beilock, 2012).
For people with mathematics anxiety, opening a mathematics textbook or even entering a mathematics class can trigger a negative emotional reaction. Mathematics anxiety involves negative effects and tension when solving mathematical problems. Most people with normal performance in thinking and reasoning tasks perform poorly when numerical information is involved if there is mathematics anxiety (Hembree, 1990). Thus, in order to prevent mathematics anxiety, which is seen to be highly effective on mathematics achievement, the factors that cause mathematics anxiety should be known and acted on from this point because mathematics anxiety does not only affect mathematics achievement but also causes emotional and physical discomfort in the person.
Reasons of Mathematics Anxiety
Researchers conducted many studies in order to identify the reasons for mathematics anxiety. Although the reasons for mathematics anxiety are uncertain, some teaching styles are considered as risk factors (Ashcraft, 2002). According to Burns (1998), the fear of mathematics is deeply rooted and often begins with the students’ primary school experiences. Explanations on the development of mathematics anxiety include exposure to mathematics failure, negative attitudes by teachers, and cognitive predisposition (Lyons & Beilock, 2012; Young, Wu, & Menon, 2012). Jackson and Leffingwell (1999) emphasized that the negative experience of mathematics classes from kindergarten to high school may cause mathematics anxiety in students. In another study, it was stated that mathematics ability, perceived mathematics achievement, mathematics self-efficacy, family environment, teacher attitude, and teaching method were the main factors affecting mathematics anxiety (Haynes, Mullins, & Stein, 2004). Other than these reasons, gender is another factor that should be discussed under a separate heading.
Mathematics Anxiety and Gender. Female students report higher levels of mathematics anxiety than male students, as documented in most studies (Else-Quest, Hyde, & Linn, 2010; Hyde, Fennema, Ryan, Frost, & Hopp, 1990; Ma & Xu, 2004). Considering the negative effects of anxiety on psychological health, learning behaviors, self-regulation, and academic achievement, these findings are discouraging on behalf of girls (Diener, 2000; Pekrun, Goetz, Titz, & Perry, 2002; Zeidner, 1998).
Studies have shown that female students report significantly lower perceived proficiency levels based on the mathematics-related self-efficacy and perceived ability when compared to male students (Goetz, Frenzel, Hall, & Pekrun, 2008; Hyde et al., 1990). This shows that the low self-efficacy of the female students leads to an increase in anxiety; and therefore, mathematics anxiety and self-efficacy are negatively related.
Motivation
Making a general definition of the concept of motivation is not possible because researchers have made suitable definitions to the theoretical models (Mobrand, Turns, & Mobrand, 2013). Maslow (1962) described motivation as the act and effort of individuals with their own desires to achieve a specific goal. According to Koçel (2005, p. 633), “motivation is the sum of efforts to continuously set in motion one or more people for a specific purpose”. The individual’s behavior is often based on a cause that consists of subjects such as needs, interests, beliefs, and impulses. Behind every behavior there is a desire, and in the target, there is a purpose. In order to achieve this purpose, individuals’ wishes must be fulfilled so that they can be happy.
Motivation is important for emotional components as well because students’ motivation plays an important role in conceptual change processes (Lee, 1989; Lee & Brophy, 1996; Pintrich, Marx, & Boyle, 1993), critical thinking, and learning strategies (Garcia & Pintrich, 1994; Kuyper et al., 2000; Wolters, 1999). Being motivated is to take action to do something. Therefore, a person who does not have desire to act or who does not feel inspired is considered as unmotivated, whereas a person with high energy and desire to act is considered motivated (Ryan & Deci, 2000).
practices (Ryan & Deci, 2000). In general, both intrinsic and extrinsic motivations are beneficial for students in the classroom. However, intrinsic motivation that is innate and dependent on students is more important in the classroom environment. Essentially motivated students tend to enjoy learning without any extrinsic effect (Karagöl, 2008). Therefore, intrinsic motivation has emerged as an important phenomenon for educators; it has a natural place in learning and success (Ryan & Stiller, 1991). On the other hand, the purpose of a behavior in extrinsic motivation encourages the behavior to conditional behaviors outside the activity in order to gain benefit or to avoid the negative consequences that are expected to occur later (Yavuz, Özyıldırım, & Doğan, 2012).
Intrinsic motivation in humans is not the only form of motivation or an optional activity. However, it is a common and important motivation. Intrinsic motivation has been accepted for the first time in experimental research on animal behavior, in which many organisms exhibit playful and curious behavior even in the absence of reinforcements or prizes (White, 1959). According to Harter (1981), extrinsic motivation is to prefer easy work, teacher satisfaction, and getting good grades; and to focus on external criteria for success. Van Lier (1996) interprets intrinsic motivation as money owned and extrinsic motivation as loan.
Motivation Strategies
The review of learning motivation studies revealed various motivation factors such as self-perception abilities, effort, intrinsic goal orientation, task value, self-efficacy, test anxiety, self-regulation, task orientation, and learning strategies (Garcia & Pintrich, 1995; Nolen & Haladyna, 1989; Pintrich & Blumenfeld, 1985). According to Aktan and Tezci (2013), the constructs directly related to academic success are intrinsic goal orientation, extrinsic goal orientation, task value, control of learning beliefs, self-efficacy, and test anxiety. These strategies also form the factors of the motivation towards mathematics education scale developed by Liu and Lin (2010). In addition, the components of motivation in this social cognitive motivation model are values, expectations, and effects. The value component is affected by intrinsic goal orientation, extrinsic goal orientation, and task value, while expectation component is affected by learning problems, self-efficacy for performance, and control of learning beliefs. Finally, the effect component is affected by test anxiety and self-esteem (Liu & Lin, 2010). Here are the constitutional definitions of the above-mentioned constructs (Liu & Lin, 2010):
Intrinsic Goal Orientation. It focuses on the intrinsic reason why students participate in a task. For example: Curiosity, self-development or satisfaction. (Example: The most satisfying thing for me is to try to understand the content as much as possible.)
Extrinsic goal orientation. It focuses on the external cause (concerns) of students’ participation in a task. For example: Getting money, good grades or praise from others. (Example: I want to be good in this class because it is important that I show my abilities to my family and friends.)
Task value. It means students’ perception or awareness of the material or subject in terms of the usefulness, importance or applicability. (Example: I think I can use what I learned in this lesson in other lessons.)
Control of learning beliefs. It means that students believe their efforts will lead to positive results. (Example: If I work properly, I can learn the materials in the lesson.)
Self-efficacy. It refers to the confidence in one’s ability to complete the task and one’s skills to perform the task. (Example: I think I will get a perfect grade in this lesson.)
Test anxiety. It indicates a negative feeling of taking the exam. (Example: When I take the exam, I feel anxious and sad.)
Motivation and Gender
In the study of Yaman and Dede (2007) examining the differences of motivation of middle school students towards mathematics by gender, they stated that the arithmetic mean of the motivation scores of female students were higher than male students in all factors. Although significant progress has been made, significant gender differences in educational attainment and professional attainment remain. Today more and more female students take mathematics and science classes in high school, but it is worth noting that they love these classes less than male students (Livingston & Wirt, 2004).
The Relationship between Mathematics Performance and Mathematics Anxiety
Numerous studies have shown that emotional factors can play a major role in mathematical performance, especially mathematics anxiety plays a major role (Arslan, Güler, & Gürbüz, 2017; Baloğlu & Koçak, 2006; Ho et al., 2000; Ma & Kishor, 1997; McLeod, 1994; Miller & Bichsel, 2004; Sarı & Ekici, 2018). Mathematics anxiety is the sense of tension, worry and fear in situations where mathematical activities are involved (Suinn & Winston, 2003); and when complex cognitive functions are considered to be very important for mathematical operations (Ashcraft, 2002), it is conceivable to observe a quadratic curvilinear relationship between mathematics performance and mathematics anxiety.
While individuals with high mathematics anxiety avoid mathematics more, individuals with moderate level anxiety spend more effort in mathematical problem solving and try to develop more strategies for problem solving (Lyons & Beilock, 2012; Wigfield & Meece, 1988). Anxious people may think that their performance is very poor, which may distract from the task or problem at hand and disrupt the resources of working memory. Ashcraft and Kirk (2001) have shown that individuals with high mathematics anxiety have a smaller working memory than those with less mathematics anxiety, especially in tasks requiring computations. In particular, they noted that individuals with high mathematics anxiety were slower in keeping the numbers in memory and made more mistakes than others in the tasks they had to do mental additions. In general, the relevant literature shows that average anxiety levels help focus and improve functioning memory, while extremely high or low anxiety levels are associated with insufficient cognitive resources allocated to tasks (Arnsten, 2009; Diamond et al., 2007).
The Relationship between Mathematics Performance and Mathematics Motivation
Mathematical motivation is a measure of the extent to which individuals adopt mathematical difficulties and how much they value the importance of mathematics skills and good performance in mathematics (Gottfried, Marcoulides, Gottfried, Oliver, & Guerin, 2007). According to Temel (2003), intrinsic motivation is the type of motivation that will especially enable the students to learn permanently and to achieve the desired level of success; extrinsic motivation is needed when intrinsic motivation cannot be established.
The Relationship between Mathematics Anxiety and Mathematics Motivation
Mathematics anxiety and mathematics motivation are both related to mathematics, but they are different dimensions. Indicating that mathematics anxiety alone or mathematics motivation alone is effective on mathematics learning behaviors and mathematics performance would be wrong (Lyons & Beilock, 2012; Wigfield & Meece, 1988). Mathematics anxiety creates irritability and discomfort in mathematics experiences; however, provides little information on how individuals approach mathematical activities to relieve these negative emotions. Mathematics motivation defines approach-oriented response tendencies towards mathematics. Mathematics anxiety and mathematics motivation are related to the acquisition of the positive and negative aspects of the mathematics experience and both are negatively related to each other (Chiu & Henry, 1990).
Although there are very few studies that specifically address the relationship between mathematics motivation and mathematics anxiety, some studies show that motivation, which also constitutes students’ mathematics anxiety, plays an important role in mathematics performance. For example, the “explain-practice-memorize” approach is one of the most important factors contributing to students’ mathematics anxiety (Steele & Arth, 1998). Using this teaching approach, students are forced to practice most of their time by memorizing mathematical formulas that seem meaningless. For this reason, naturally, students think that mathematics is difficult, and they are afraid of mathematics (Shen, 2009).
Motivational strategies can be used to overcome students’ fears and reduce mathematics anxiety. In particular, motivation strategies can be derived from the literature on setting goals. It is believed that setting mastery goals in mathematics assessment can prevent students from competing with their peers and help them focus on the mathematics content they have learned. This reduces anxiety in the mathematics tests (Steele & Arth, 1998). Other strategies such as a cooperative learning environment can also reduce mathematics anxiety because anxious students are more likely to express their thoughts in small groups and working in groups means they can share responsibilities in solving mathematical problems. Unfortunately, not all mathematics teachers use motivational strategies to motivate students and alleviate mathematics anxiety.
Relationship between Mathematics Performance and Anxiety and Motivation
While there may be many factors that affect mathematics performance, interactions with each other and levels of anxiety and motivation affect mathematics performance. Wang et al. (2015) showed that the interactions between mathematics anxiety and mathematics motivation increased the processes between mathematical emotions and cognitions in the context of mathematics performance. In the same study, the results showed that the facilitating and attenuating effects of mathematics anxiety on mathematics performance in an environment where students have abundant mathematics learning experience and positive attitudes did not differ only between different mathematics anxiety levels.
In addition, while the mathematics performance of the students who are more motivated towards mathematics increases due to their average mathematics anxiety; mathematics performance of the students who are less motivated decreases due to their very low or very high mathematics anxiety. This observation occurred for both adolescents and adults (Wang et al., 2015). As the aim of this study is to investigate the relationship between mathematics anxiety and motivation towards mathematics and how and to what extent mathematics anxiety and motivation towards mathematics of middle school eighth-grade students affect the students’ mathematics performance in the High School Entrance Exam (HSEE), above-mentioned constructs will be used in the scales to detail the relationships between mathematics anxiety and motivation towards mathematics and mathematics achievement.
Method
This is a relational screening study that examines the role of anxiety and motivation in mathematics achievement of eighth-grade students in the transition test from middle school to high school. Relational (correlation) screening is a research model that aims to determine the relationship between two and more variables and to determine the presence and/or degree of change of these variables together (Creswell, 2002).
Participants
The sample of the study consisted of 777 students from 10 different middle schools in a district of a metropolitan area in the Aegean region of Turkey. The gender distribution of the students who form the sample of the research is shown in Table 1.
Table 1. Gender Distribution of the Participants
Gender N %
Female 405 52,12
Male 372 47,88
According to MoNE’s report for the first and second term of 2015-2016 academic year, in the High School Entrance Exam (HSEE), the average mathematics score of Turkish students in general was 42.48 (Calculated by taking the average of first and second terms’ averages; MoNE, 2016b), while the average mathematics score of students who participated in this research was 45.61 (Calculated by taking the average mathematics exam scores of participants). This shows how close the sample is to representing the universe.
Data Collection Tools
In this study, Mathematics Anxiety Scale for Elementary School Students (MASESS) that was developed by Şentürk (2010) and the Mathematics Motivation Scale (MMS) that was adapted by Aktan and Tezci (2013) with validity and reliability studies were used as data collection tools. In the selection of the scale, researchers paid attention that the studies were closer to the present and up to date. In addition, the demographic information of the students was obtained with the personal information form developed by the researcher. Finally, in order to demonstrate the mathematics achievement of the students, scores from the HSEE were used.
Mathematics Anxiety Scale for Elementary School Students (MASESS) developed by Şentürk (2010) is a 5-point Likert-type scale consisting of 22 items. The sub-dimensions of the scale were attitude anxiety (4 items), self-confidence anxiety (5 items), content knowledge anxiety (4 items), learning anxiety (4 items), and test anxiety (5 items). As a result of the reliability analysis conducted by the researcher, Cronbach alpha coefficient was found 0.883 for the whole scale.
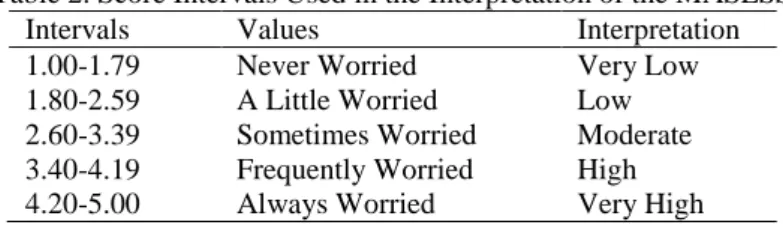
In addition, depending on the extent to which the items of the scale aroused anxiety in students, students were asked to choose “Always Worried=5”, “Frequently Worried=4”, “Sometimes Worried=3”, “A Little Worried=2”, and “Never Worried=1”. The answers were scored as given above, and the total score was calculated as the mathematics anxiety score of the student. Below intervals were considered in the interpretation of the averages because MASESS is a 5-point Likert-type scale (Table 2).
Table 2. Score Intervals Used in the Interpretation of the MASESS
Intervals Values Interpretation
1.00-1.79 Never Worried Very Low
1.80-2.59 A Little Worried Low
2.60-3.39 Sometimes Worried Moderate 3.40-4.19 Frequently Worried High
4.20-5.00 Always Worried Very High
Mathematical Motivation Scale (MMS) adapted to Turkish by Aktan and Tezci (2013) is a 5-point Likert-type scale consisting of 27 items. The MMS was developed based on the motivation part of the Motivated Strategies for Learning Questionnaire (MSLQ) developed by Pintrich et al. (1991). The sub-dimensions of the scale were intrinsic goal orientation (3 items), extrinsic goal orientation (4 items), task value (5 items), control of learning beliefs (5 items), learning self-efficacy (6 items), and test anxiety (4 items).
In addition, students were asked to choose “Strongly Disagree=1”, “Disagree=2”, “Undecided=3”, “Agree=4”, and “Strongly Agree=5” and the responses were scored as above. As a result of the reliability analysis conducted for the MMS in this study, the Cronbach's alpha coefficient was found to be 0.707 for the whole scale while all six dimensions were present. Cronbach's alpha coefficient increased to 0.838 by eliminating the dimension of test anxiety (4 items). The elimination of this dimension increased the reliability of the analysis and this increase showed that the examination of text anxiety with a separate scale was not useful as this sub-dimension was already examined with the MASESS. Based on this value, the measurements made with the MMS were reliable. Below intervals were considered in the interpretation of the averages because MMS is a 5-point Likert-type scale (Table 3).
Table 3. Score Intervals Used in the Interpretation of the MMS
Intervals Values Interpretation
1.00-1.79 Strongly Disagree Very Low
1.80-2.59 Disagree Low
2.60-3.39 Undecided Moderate
3.40-4.19 Agree High
Data Collection Process
The study was planned to be conducted with a total of 978 eighth-grade students in 10 middle schools of a province in the Aegean region of Turkey at the end of 2015-2016 school year. Participation of students in this research was voluntary. Permission was granted from the district education directorates in order to conduct the study. Later the forms were transformed into scantron forms and researchers handed out these forms to the students in each school. After receiving the answers, some of the forms were eliminated because some of the students who participated in the study left some items blank while filling out the forms, some of the students’ scores from HSEE were missing due to these students making school changes in the second semester during the study, and some of the students’ answers were found to be inconsistent during the control of the forms. As a result of the elimination, a total of 777 students’ forms were considered valid.
Data Analysis
In the analysis of the obtained data, descriptive analysis, independent samples t-test, correlation analysis, and structural equation modeling were performed for each research question.
Descriptive Analysis. In order to determine mathematics anxiety and mathematics motivation levels of the students participating in the research, means scores of the scales and standard deviation values were used. The mean scores, skewness and kurtosis values of each item and overall of the scales were examined to identify whether data obtained from the MASESS and MMS. While skewness and kurtosis values were zero in the standard normal distribution, it can be said that the data exhibits univariate normal distribution because skewness and kurtosis values of the MASESS and MMS stayed between 2 (Chou & Bentler, 1995; Curran, West, & Finch, 1996). From this point of view, it was observed that the data had a normal distribution according to skewness and kurtosis values and the general average of the scales was suitable for the normal distribution. The Independent Samples t-Test. This test was used to compare students’ mathematics anxiety and motivation towards mathematics according to gender, pre-school education, support and training courses, and private tutoring. Levene test was used to check whether the variances of the data were distributed homogeneously. The relationship between the dimensions of the scales was analyzed by Pearson correlation analysis. SPSS 20.0 package program was used for the mentioned analyses.
Correlation Analysis. Pearson moments correlation analysis was used to determine whether there was a relationship between students’ mathematics anxiety and motivation towards mathematics.
Structural Equation Model (SEM). This approach was used to determine the power of students’ mathematics achievement in HSEE to interpret their mathematics anxiety and motivation towards mathematics and test the model that was established related to the relationships between these variables. SEM is a comprehensive statistical method used to test models with hypotheses for causal and correlational relationships between observed and invisible (latent) variables (Holye, 1995). As explained above, HSEE was chosen as the achievement criterion because mathematics content in this exam has the highest coefficient while determining students’ overall performance. Also, the score that students receive from this exam determines which high schools they will be attending to. That is another reason why students’ performance in this exam was counted as achievement criterion. Especially in Turkey, the placement by examination system, which started in the transition from middle school to high school, continues in the transition to all subsequent education levels. In addition, considering the fact that there is an examination in the staff selection process to the governmental agencies, the importance of mathematics in exams is more understandable (Başar, Ünal, & Yalçın, 2002). This analysis was performed using LISREL 9.30 package program. In the evaluation of SEM analysis, the path diagram was first examined. In the diagram, standardized values and t-values were examined. Since the absolute value of the standardized values should not be greater than 1, these values were checked, and it was seen that the absolute value of all values was not greater than 1.
Findings
Finding Regarding Descriptive Analysis
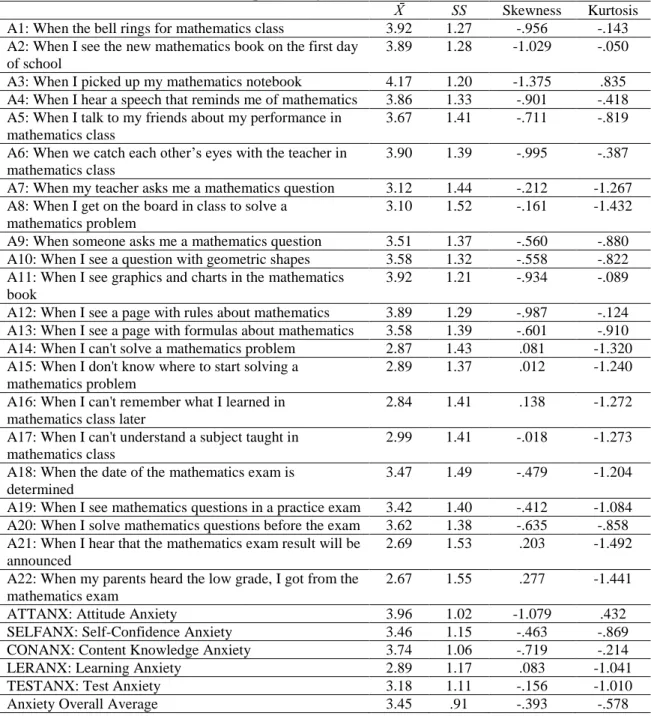
Table 4. Descriptive Analysis Results of the MASESS
SS Skewness Kurtosis
A1: When the bell rings for mathematics class 3.92 1.27 -.956 -.143 A2: When I see the new mathematics book on the first day
of school
3.89 1.28 -1.029 -.050
A3: When I picked up my mathematics notebook 4.17 1.20 -1.375 .835 A4: When I hear a speech that reminds me of mathematics 3.86 1.33 -.901 -.418 A5: When I talk to my friends about my performance in
mathematics class
3.67 1.41 -.711 -.819
A6: When we catch each other’s eyes with the teacher in mathematics class
3.90 1.39 -.995 -.387
A7: When my teacher asks me a mathematics question 3.12 1.44 -.212 -1.267 A8: When I get on the board in class to solve a
mathematics problem
3.10 1.52 -.161 -1.432
A9: When someone asks me a mathematics question 3.51 1.37 -.560 -.880 A10: When I see a question with geometric shapes 3.58 1.32 -.558 -.822 A11: When I see graphics and charts in the mathematics
book
3.92 1.21 -.934 -.089
A12: When I see a page with rules about mathematics 3.89 1.29 -.987 -.124 A13: When I see a page with formulas about mathematics 3.58 1.39 -.601 -.910 A14: When I can't solve a mathematics problem 2.87 1.43 .081 -1.320 A15: When I don't know where to start solving a
mathematics problem
2.89 1.37 .012 -1.240
A16: When I can't remember what I learned in mathematics class later
2.84 1.41 .138 -1.272
A17: When I can't understand a subject taught in mathematics class
2.99 1.41 -.018 -1.273
A18: When the date of the mathematics exam is determined
3.47 1.49 -.479 -1.204
A19: When I see mathematics questions in a practice exam 3.42 1.40 -.412 -1.084 A20: When I solve mathematics questions before the exam 3.62 1.38 -.635 -.858 A21: When I hear that the mathematics exam result will be
announced
2.69 1.53 .203 -1.492
A22: When my parents heard the low grade, I got from the mathematics exam
2.67 1.55 .277 -1.441
ATTANX: Attitude Anxiety 3.96 1.02 -1.079 .432
SELFANX: Self-Confidence Anxiety 3.46 1.15 -.463 -.869
CONANX: Content Knowledge Anxiety 3.74 1.06 -.719 -.214
LERANX: Learning Anxiety 2.89 1.17 .083 -1.041
TESTANX: Test Anxiety 3.18 1.11 -.156 -1.010
Anxiety Overall Average 3.45 .91 -.393 -.578
In the descriptive analysis of the data obtained from the MASESS, the item with the highest average ( =4.17, SS=1.20) belongs to item 3, which is stated as “when I picked up my mathematics notebook”. The anxiety level was found to be highest in this item. The item with the lowest average ( =2.67, SS=1.55) belongs to item 22, which is stated as “when my parents heard the low grade, I got from the mathematics exam”. In this item, the anxiety level was found to be the lowest. The averages of attitude anxiety ( =3.96, SS=1.02), self-confidence anxiety ( =3.46, SS=1.15), and content knowledge anxiety ( =3.74, SS=1.06) sub-dimensions were found to be high. The averages of learning anxiety ( =2.89, SS=1.17) and test anxiety ( =3.18, SS=1.11) sub-dimensions were found to be low. It can be concluded that students experience less learning and test anxiety. The overall average of the students’ anxiety level ( =3.45, SS=.91) was also high.
The item with the lowest average ( =2.96, SS=1.40) belongs to item 2, which is stated as “studying mathematics makes me very happy”. The motivation level was found to be lowest in this item. The averages of intrinsic goal orientation ( =3.42, SS=1.02), extrinsic goal orientation ( =4.44, SS=.63), task value ( =3.47, SS=1.02), learning belief ( =3.73, SS=.89) and self-efficacy ( =3.41, SS=1.03) sub-dimensions were found to be high. Students’ motivation levels were high in all sub-dimensions. The sub-dimension with the highest average was the extrinsic goal orientation. This shows that the most motivating factors are the external goals. The overall average of the students’ motivation level ( =3.69, SS=.72) was also high.
Table 5. Descriptive Analysis Results of the MMS
SS Skewness Kurtosis
M1: I would like to learn the topics that I like, albeit difficult, in mathematics class.
4.01 1.14 -1.206 .752
M2: Studying mathematics makes me very happy. 2.96 1.40 -.034 -1.244 M3: I do my mathematics homework to learn something,
not for a good grade.
3.29 1.33 -.361 -.971
M4: Getting a good grade from mathematics class makes me very happy.
4.75 .55 -2.341 5.220
M5: I would like to get good grades from the exams so that mathematics is good in my report card.
4.58 .78 -2.292 5.773
M6: I would like to get higher grades than my friends in mathematics class.
4.15 1.10 -1.213 .602
M7: I would like to show my friends and family that I can be successful in mathematics class.
4.26 1.02 -1.509 1.787
M8: I can use what I learned in mathematics class in other classes.
3.52 1.24 -.568 -.568
M9: It is important for me to learn the subjects in mathematics class.
3.93 1.18 -1.087 .367
M10: I am interested in the subjects of mathematics class. 3.16 1.36 -.242 -1.070 M11: The subjects of mathematics class are useful to me. 3.67 1.25 -.751 -.358 M12: I like the subjects of mathematics class. 3.07 1.40 -.165 -1.216 M13: Understanding the subjects in mathematics class is
very important to me.
3.92 1.21 -1.086 .326
M14: If I study properly, I can learn the subjects in mathematics class.
4.09 1.09 -1.221 .882
M15: If I cannot learn the subjects in mathematics class, that is my fault.
3.21 1.36 -.266 -1.083
M16: If I study hard enough, I can learn the subjects of mathematics class.
4.00 1.16 -1.106 .437
M17: If I do not understand the subjects in mathematics class, this is because I am not studying hard enough.
3.41 1.28 -.484 -.795
M18: If I study mathematics, I think I will get a very good grade.
3.98 1.15 -1.057 .343
M19: I am sure I can understand the most difficult subjects in mathematics textbook.
3.09 1.34 -.144 -1.020
M20: I am sure I can learn the knowledge taught in mathematics class.
3.54 1.22 -.578 -.496
M21: I am sure I can understand the most difficult subjects that the teacher teaches in mathematics class.
3.21 1.29 -.237 -.918
M22: I am sure that I will get a high grade in homework and exams in mathematics class.
3.34 1.24 -.346 -.695
M23: I am sure I will be very successful in mathematics class.
3.31 1.29 -.316 -.837
Intrinsic: Intrinsic Goal Orientation 3.42 1.02 -.528 -.326
Extrinsic: Extrinsic Goal Orientation 4.44 .63 -1.217 .940
Task: Task Value 3.47 1.02 -.476 -.415
Belief: Learning Belief 3.73 .89 -.813 .462
Efficacy: Self-Efficacy 3.41 1.03 -.436 -.325
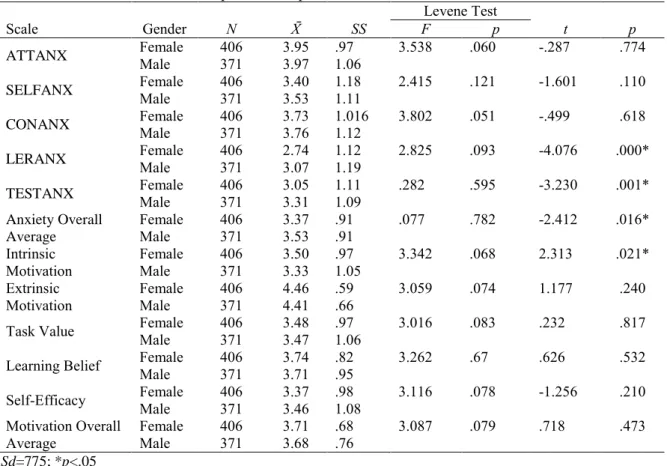
Independent samples t-test was used to determine whether the sub-dimensions and overall averages of the students’ anxiety and motivation levels in mathematics class differed by gender. The results of the analysis are presented in Table 6.
Table 6. Independent Samples t-test Results in terms of Gender
Scale Gender N SS
Levene Test
t p
F p
ATTANX Female Male 406 371 3.95 3.97 .97 1.06 3.538 .060 -.287 .774
SELFANX Female 406 3.40 1.18 2.415 .121 -1.601 .110
Male 371 3.53 1.11
CONANX Female Male 406 371 3.73 3.76 1.016 1.12 3.802 .051 -.499 .618
LERANX Female 406 2.74 1.12 2.825 .093 -4.076 .000*
Male 371 3.07 1.19
TESTANX Female Male 406 371 3.05 3.31 1.11 1.09 .282 .595 -3.230 .001* Anxiety Overall
Average
Female 406 3.37 .91 .077 .782 -2.412 .016*
Male 371 3.53 .91
Intrinsic
Motivation Female Male 406 371 3.50 3.33 .97 1.05 3.342 .068 2.313 .021* Extrinsic
Motivation Female Male 406 371 4.46 4.41 .59 .66 3.059 .074 1.177 .240
Task Value Female Male 406 371 3.48 3.47 .97 1.06 3.016 .083 .232 .817
Learning Belief Female Male 406 371 3.74 3.71 .82 .95 3.262 .67 .626 .532
Self-Efficacy Female Male 406 371 3.37 3.46 .98 1.08 3.116 .078 -1.256 .210 Motivation Overall
Average Female Male 406 371 3.71 3.68 .68 .76 3.087 .079 .718 .473
Sd=775; *p<.05
As a result of the analysis of the scores obtained from the MASESS in terms of gender, attitude anxiety (t=-.287, p>.05), self-confidence anxiety (t=-1.601, p>.05), and content knowledge anxiety (t=-.499, p>.05) sub-dimensions towards mathematics were not significantly different. A significant difference was found in learning anxiety sub-dimension of the MASESS (t=-4.076, p<.05). The learning anxiety of male students was found to be higher than female students. A significant difference was also found in test anxiety sub-dimension of the MASESS (t=-3.230, p<.05). Male students’ test anxiety was higher than female students. A significant difference was also found in the overall scores obtained from the MASESS (t=-2.412, p<.05). Male students have higher anxiety than female students.
As a result of the analysis of the scores obtained from the MMS in terms of gender, significant differences were found only in intrinsic motivation sub-dimension (t=2.313, p<.05). The intrinsic motivation levels of female students were higher than male students. There was no significant difference in the extrinsic motivation (t=1.177, p>.05), task value (t=.232, p>.05), learning belief (t=.626, p>.05), and self-efficacy (t=-1.256, p>.05) sub-dimension of the MMS and overall scale scores (t=.718, p>.05).
Findings Regarding Independent Samples t-Test
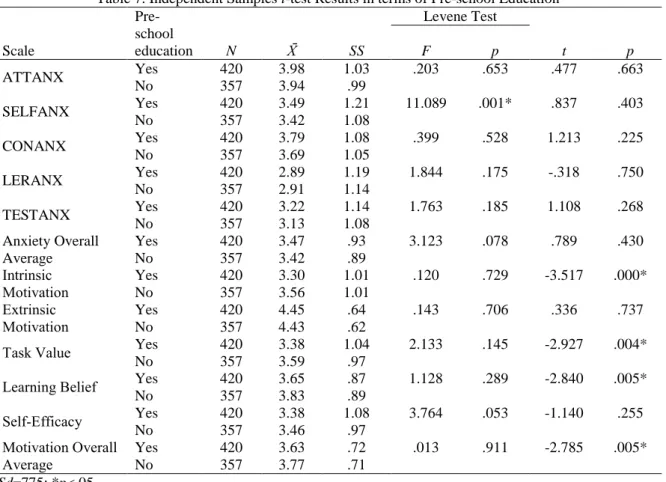
Independent samples t-test was used to determine whether the sub-dimensions and overall averages of the students’ anxiety and motivation levels in mathematics class differed by pre-school education. The results of the analysis are presented in Table 7. As a result of the analysis of the scores obtained from the MASESS in terms of taking pre-school education, attitude anxiety (t=.477, p>.05), self-confidence anxiety (t=.837, p>.05), content knowledge anxiety (t=1.213, p>.05), learning anxiety (t=-.318, p>.05), and test anxiety (t=1.108, p>.05) sub-dimensions towards mathematics were not significantly different.
significant differences were found in the intrinsic motivation (t=-3.517, p<.05), task value (t=2.927, p˂.05), and learning belief (t=-2.840, p˂.05) sub-dimensions and the overall scores of the scale (t=-2.785, p˂.05). The levels of intrinsic motivation, task value, and learning belief of students who said “No” were higher than those who said “Yes”. There were no significant differences in the extrinsic motivation (t=.336, p>.05) and self-efficacy (t=-1.140, p>.05) sub-dimensions of the MMS.
Table 7. Independent Samples t-test Results in terms of Pre-school Education
Scale
Pre-school
education N SS
Levene Test
t p
F p
ATTANX Yes 420 3.98 1.03 .203 .653 .477 .663
No 357 3.94 .99
SELFANX Yes 420 3.49 1.21 11.089 .001* .837 .403
No 357 3.42 1.08
CONANX Yes 420 3.79 1.08 .399 .528 1.213 .225
No 357 3.69 1.05
LERANX Yes 420 2.89 1.19 1.844 .175 -.318 .750
No 357 2.91 1.14
TESTANX Yes 420 3.22 1.14 1.763 .185 1.108 .268
No 357 3.13 1.08
Anxiety Overall Average
Yes 420 3.47 .93 3.123 .078 .789 .430
No 357 3.42 .89
Intrinsic Motivation
Yes 420 3.30 1.01 .120 .729 -3.517 .000*
No 357 3.56 1.01
Extrinsic Motivation
Yes 420 4.45 .64 .143 .706 .336 .737
No 357 4.43 .62
Task Value Yes 420 3.38 1.04 2.133 .145 -2.927 .004*
No 357 3.59 .97
Learning Belief Yes 420 3.65 .87 1.128 .289 -2.840 .005*
No 357 3.83 .89
Self-Efficacy Yes 420 3.38 1.08 3.764 .053 -1.140 .255
No 357 3.46 .97
Motivation Overall Average
Yes 420 3.63 .72 .013 .911 -2.785 .005*
No 357 3.77 .71
Sd=775; *p<.05
Independent samples t-test was used to determine whether the sub-dimensions and overall averages of the students’ anxiety and motivation levels in mathematics class differed by support and training courses. The results of the analysis are presented in Table 8. As a result of the analysis of the scores obtained from the MASESS in terms of attending the support and training courses in the schools, significant differences were found in the self-confidence anxiety (t=3.047, p˂.05) and content knowledge anxiety (t=2.308, p˂.05) sub-dimensions towards mathematics.
The averages of the students who said “Yes” in terms of self-confidence anxiety and content knowledge anxiety were found to be higher than those who said “No”. Students who attended the support and training courses had higher levels of self-confidence anxiety and content knowledge anxiety than those who did not. There was no significant difference in the attitude anxiety (t=1.946, p>.05), learning anxiety (t=.166, p>.05), and test anxiety (t=-.015, p>.05) sub-dimensions towards mathematics and the overall scores obtained from the MASESS (t=1,780, p>.05).
Table 8. Independent Samples t-test Results in terms of Support and Training Courses Scale
Support and
training courses N SS
Levene Test
Sd t p
F p
ATTANX Yes 404 4.03 .95 9.475 .002 744.628 1.946 .052
No 373 3.89 1.08
SELFANX Yes 404 3.58 1.09 10.798 .001* 775.011 3.047 .002*
No 373 3.33 1.21
CONANX Yes 404 3.83 .97 11.041 .001* 733.046 2.308 .021*
No 373 3.65 1.15
LERANX Yes 404 2.90 1.13 2.522 .113 775 .166 .868
No 373 2.89 1.21
TESTANX Yes 404 3.18 1.06 5.128 .024* 751.981 -.015 .988
No 373 3.18 1.17
Anxiety Overall Average
Yes 404 3.50 .85 7.800 .005* 744.686 1.780 .076
No 373 3.39 .97
Intrinsic Motivation
Yes 404 3.58 .96 3.253 .072 775 4.460 .000*
No 373 3.25 1.05
Extrinsic Motivation
Yes 404 4.52 .59 10.643 .001* 745.490 3.882 .000*
No 373 4.35 .66
Task Value Yes 404 3.60 .99 .294 .588 775 3.443 .001*
No 373 3.35 1.02
Learning Belief Yes 404 3.81 .88 .474 .491 775 2.531 .012*
No 373 3.65 .89
Self-Efficacy Yes 404 3.47 1.01 .809 .369 775 1.686 .092
No 373 3.35 1.05
Motivation Overall Average
Yes 404 3.80 .69 1.597 .207 775 4.081 .000*
No 373 3.59 .73
*p<.05
Table 9. Independent Samples t-test Results in terms of Private Tutoring Scale
Private
tutoring N SS
Levene Test
t p
F p
ATTANX Yes 286 4.11 .99 2.691 .101 3.185 .002*
No 491 3.87 1.02
SELFANX Yes 286 3.70 1.16 .000 .911 4.482 .000*
No 491 3.32 1.13
CONANX Yes 286 3.87 1.05 .210 .647 2.518 .012*
No 491 3.67 1.07
LERANX Yes 286 3.03 1.18 .126 .723 2.505 .012*
No 491 2.82 1.15
TESTANX Yes 286 3.31 1.13 .400 .527 2.640 .008*
No 491 3.10 1.09
Anxiety Overall Average
Yes 286 3.61 .90 .208 .649 3.726 .000*
No 491 3.36 .91
Intrinsic Motivation Yes 286 3.32 1.04 .354 .552 -2.139 .033*
No 491 3.48 .99
Extrinsic Motivation Yes No 286 491 4.44 4.44 .63 .63 .001 .973 .079 .937
Task Value Yes 286 3.44 1.08 2.995 .082 -.649 .516
No 491 3.49 .97
Learning Belief Yes No 286 491 3.67 3.76 .91 .87 1.277 .259 -1.438 .151
Self-Efficacy Yes 286 3.53 1.08 3.455 .063 2.409 .016*
No 491 3.35 .99
Motivation Overall Average
Yes 286 3.68 .75 .707 .401 -.439 .661
No 491 3.70 .70
Sd=775; *p<.05
scale. Significant differences were found in the attitude anxiety (t=3.185, p˂.05), self-confidence anxiety (t=4.482, p˂.05), content knowledge anxiety (t=2.518, p˂.05), learning anxiety (t=2.505, p˂.05), test anxiety (t=2.640, p˂.05) and the overall scores obtained from the MASESS (t=3.726, p˂.05). The averages of the students who said “Yes” in terms of all sub-dimensions of the scale were higher than the students who said “No”. It was observed that the anxiety levels of the students taking private tutoring were higher than those who did not.
As a result of the analysis of the scores obtained from the MMS in terms of taking private tutoring, only significant differences were found in the intrinsic motivation (t=4.640, p<.05) and self-efficacy (t=1.686, p<.05) sub-dimensions. The intrinsic motivation levels of the students who said “No” were higher than those who said “Yes”. On the other hand, the self-efficacy levels of the students who said “Yes” were higher than those who said “No”. There was no significant difference in the extrinsic motivation (t=.079, p>.05), task value (t=-.649, p>.05), learning belief (t=-1.438, p>.05) sub-dimension of the MMS and the overall scores obtained from the scale (t=-.439, p>.05).
Findings Regarding Correlation Analysis
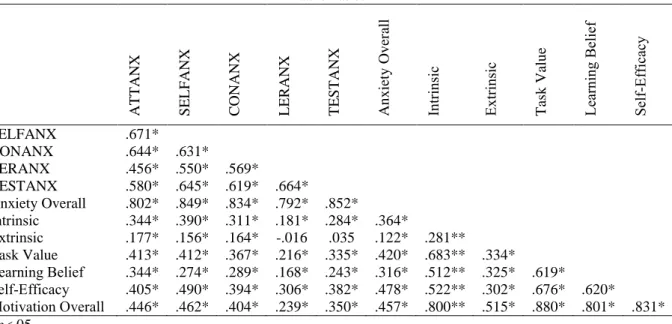
Correlation analysis was performed to determine whether there was a relationship between students’ mathematics anxiety and motivation towards mathematics. The results of the analysis are presented in Table 10.
Table 10. Correlation Analysis Results between Students’ Mathematics Anxiety and Motivation towards Mathematics AT T ANX SEL FANX C ONAN X L E R ANX T E STAN X An x iety Ov er all In tr in sic E xtr in sic T ask Valu e L ea rn in g B elief Self -E ff icac y
SELFANX .671*
CONANX .644* .631*
LERANX .456* .550* .569*
TESTANX .580* .645* .619* .664* Anxiety Overall .802* .849* .834* .792* .852*
Intrinsic .344* .390* .311* .181* .284* .364*
Extrinsic .177* .156* .164* -.016 .035 .122* .281**
Task Value .413* .412* .367* .216* .335* .420* .683** .334*
Learning Belief .344* .274* .289* .168* .243* .316* .512** .325* .619*
Self-Efficacy .405* .490* .394* .306* .382* .478* .522** .302* .676* .620*
Motivation Overall .446* .462* .404* .239* .350* .457* .800** .515* .880* .801* .831* *p<.05
(Chi square=3667.52, sd=1030, p-value=0.000, RMSEA=0.057) Figure 1. Standardized Results
As a result of the correlation analysis, the highest correlation between the learning anxiety (LERANX) and motivation sub-dimensions was between the self-efficacy sub-dimension of the motivation (r=.31, p<.05). The lowest correlation between the learning anxiety (LERANX) and motivation sub-dimensions was between the learning belief sub-dimension of the motivation (r=.17, p<.05). The correlation between these dimensions was low. In addition, there was no significant relationship between learning anxiety (LERANX) and extrinsic sub-dimension of the motivation (r=-.02, p>.05). As a result of the correlation analysis, the highest correlation between the test anxiety (TESTANX) and motivation dimensions was between the self-efficacy sub-dimension of the motivation (r=.38, p<.05). The lowest correlation between the test anxiety (TESTANX) and motivation sub-dimensions was between the learning belief sub-dimension of the motivation (r=.24, p<.05). The correlation between these dimensions was low. In addition, no significant relationship was found between the test anxiety (TESTANX) and the extrinsic sub-dimension of the motivation (r= .04, p<.05).
Findings Regarding Structural Equation Modeling (SEM)
Structural Equation Modeling (SEM) analysis was conducted in this study where the effect of mathematics anxiety and motivation towards mathematics on middle school eighth-grade students’ mathematics achievement was examined. As a result of the analysis, the diagram showing the standardized path coefficients for the proposed model is shown in the Figure 1. In the SEM analysis, the following fit indices were obtained. When these values were examined, it was observed that fit indices were excellent or acceptable except SRMR value (SRMR=.13; Table 11). The t-values obtained at the end of SEM are shown in Figure 2.
Table 11. Fit indices for the proposed model
Fit Index Acceptable limit Perfect fit limit
NFI = 0.96 = .90 and above = .95 and above
NNFI = 0.97 = .90 and above = .95 and above
PNFI = 0.91 = .90 and above = .95 and above
CFI = 0.97 = .95 and above = .97 and above
IFI = 0.97 = .90 and above = .95 and above
RFI = 0.95 = .90 and above = .95 and above
SRMR = 0.13 = .80 and above = .05 and above
RMSEA = 0.057 = between .05 and 0.8 = between .00 and <.05 x2/sd = 3667.52/1030 = 3.56 x2/sd < 5 x2/sd < 3
Shur (2008, p.4) stated that the value of the path coefficient is weak if it is less than 0.10; if it is between 0.10-0.50, then it is moderate; and if it is greater than 0.10-0.50, it shows a strong effect. Accordingly, when the direct effects were examined, the state that the success was related to “anxiety” predicted the attitude anxiety (ß=.87, t=18.69) at a strong level, the self-confidence anxiety (ß=.86, t=17.54) at a strong level, the content knowledge anxiety (ß=.87, t=19.07) at a strong level, the learning anxiety (ß=.75, t=18.03) at a strong level, and the test anxiety (ß=.88, t=20.69) at a strong level. The sub-dimensions of the anxiety, ATTANX, SELFANX, CONANX, LERANX, and TESTANX, predicted anxiety. All path coefficients were significant. The highest path coefficient belonged to TESTANX with .88.
The state that the success was related to “motivation” predicted the intrinsic motivation (ß=.85, t=16.73) at a strong level, the extrinsic motivation (ß=.70, t=10.44) at a strong level, the task value (ß=.92, t=16.70) at a strong level, the learning belief (ß=.80, t=16.52) at a strong level, and the self-efficacy (ß=.80, t=17.08) at a strong level. The sub-dimensions of the motivation, INTRINSIC, EXTRINSIC, TASK, BELIEF, and SELF-EFFICACY, predicted motivation. All path coefficients were significant. The highest path coefficient belonged to TASK with .92. It was found that the internal variable of our study, SUCCESS, was predicted by MAT1NOT and MAT2NOT, and MAT1NOT scores predicted success better (ß=.86, t=21.84). It was determined that anxiety (ANXIETY) predicted success better (ß=.44, t=10.94), followed by motivation (MOTIV; ß=.32, t=7.62). In this case, it can be said that anxiety and motivation factors are important for increasing the success of the students in the exam they will enter during the transition process from middle school to high school.
(Chi square=3667.52, sd=1030, p-value=0.000, RMSEA=0.057) Figure 2. t-values
Discussion and Conclusion
As a result of examining the relationship between sub-dimensions of the MASESS and gender of the students, there was no significant difference in attitude anxiety, self-confidence anxiety and content knowledge anxiety sub-dimensions. However, there was a significant difference in learning anxiety and test anxiety sub-dimensions in terms of gender. Male students’ learning anxiety and test anxiety were found to be higher than female students. A significant difference was also found in the overall scores obtained from the MASESS, and the male students’ anxiety was higher than female students. Some studies emphasized that mathematics anxiety levels of students did not differ significantly according to gender (Dede & Dursun, 2008; Takunyacı, 2012), while some studies determined that female students had higher mathematics anxiety levels than male students (Hyde, Fennema, Ryan, Frost, & Hopp, 1990; Yuksel-Sahin, 2008). In the findings of Şentürk’s (2010) study, which was consistent with the findings of this study and also used the anxiety scale used in this study, researcher emphasized that male students had higher levels of anxiety than female students; and that this might be a positive development due to the increasing importance given to the education of girls in recent years. Finally, in the literature, many studies stated that female students have more anxiety than male students (Doruk & Kaplan, 2013; Else-Quest, Hyde & Linn, 2010; Mutodi & Ngirande, 2014). In the above mentioned sources, the reason why female students’ mathematics anxiety was found to be higher was explained as the results of the low perception of female students’ self-efficacy, the gender stereotypes in society, and the false perception that males are more successful in quantitative fields such as mathematics and science (Dowker, Sarkar, & Looi, 2016).
Pre-school education had no effect on anxiety levels of the students. In the study of Aktan (2012), the anxiety levels of the students who received pre-school education were found to be lower than their peers who did not. Similarly, in many studies, students who received pre-school education were found to be more successful in academic fields such as mathematics and Turkish than students who did not receive pre-school education; and, students reflect the physical, social and emotional skills they have acquired in pre-school education to their later life (Dağlı, 2007; Güven & Balat, 2006; Kandır & Uyanık, 2010).
It was concluded that the support and training courses opened in the school did not have a significant effect on students’ mathematics anxiety. Similarly, in their studies with middle school students, Adal and Yavuz (2017) reported that mathematics anxiety levels of students did not differ according to their participation in the support and training courses related to mathematics. In a study conducted by Berk (2018), administrators and teachers emphasized that academic support programs conducted outside the school play an important role in reducing the differences between learning levels based on individual characteristics.
It was concluded that taking private tutoring outside the school had a significant effect on the overall and sub-dimensions of mathematics anxiety levels. Anxiety levels of students taking private tutoring were higher than those who did not. Delioğlu (2017), in her study, found that students taking private tutoring had higher mathematics anxiety compared to students who did not. Finally, the reason why the anxiety levels of students who do not take any private tutoring are lower than their peers taking private tutoring might be explained as the increase in anxiety levels while the students strive for more success. However, since the reasons why students who do not take private tutoring are doing so cannot be known, as the only factor that causes the increase in anxiety levels of the students who take private tutoring can be seen the increase in the expectations created by the responsibility and awareness of taking private tutoring.