R E S E A R C H A R T I C L E
Open Access
Proteochemometric modeling in a Bayesian
framework
Isidro Cortes-Ciriano
1, Gerard JP van Westen
2, Eelke Bart Lenselink
3, Daniel S Murrell
4, Andreas Bender
4*and Thérèse Malliavin
1*Abstract
Proteochemometrics (PCM) is an approach for bioactivity predictive modeling which models the relationship between protein and chemical information. Gaussian Processes (GP), based on Bayesian inference, provide the most objective estimation of the uncertainty of the predictions, thus permitting the evaluation of the applicability domain (AD) of the model. Furthermore, the experimental error on bioactivity measurements can be used as input for this probabilistic model.
In this study, we apply GP implemented with a panel of kernels on three various (and multispecies) PCM datasets. The first dataset consisted of information from 8 human and rat adenosine receptors with 10,999 small molecule ligands and their binding affinity. The second consisted of the catalytic activity of four dengue virus NS3 proteases on 56 small peptides. Finally, we have gathered bioactivity information of small molecule ligands on 91 aminergic GPCRs from 9 different species, leading to a dataset of 24,593 datapoints with a matrix completeness of only 2.43%.
GP models trained on these datasets are statistically sound, at the same level of statistical significance as Support Vector Machines (SVM), withR20values on the external dataset ranging from 0.68 to 0.92, and RMSEP values close to the experimental error. Furthermore, the best GP models obtained with the normalized polynomial and radial kernels provide intervals of confidence for the predictions in agreement with the cumulative Gaussian distribution. GP models were also interpreted on the basis of individual targets and of ligand descriptors. In the dengue dataset, the model interpretation in terms of the amino-acid positions in the tetra-peptide ligands gave biologically meaningful results.
Keywords: Proteochemometrics, Bayesian inference, Gaussian process, Chemogenomics, GPCRs, Adenosine receptors, Applicability domain
Background
The advent of high-throughput (HT) technologies has contributed in the last decades to a vast data increase in proprietary and public bioactivity databases. In a parallel manner, a large amount of biological data has been col-lected on protein structure and sequence information for numerous species. Chemogenomic techniques [1-3] can capitalize on this large amount of information by model-ing the relationships between the chemical and the bio-logical space. This data integration permits the bioactivity
*Correspondence: [email protected]; [email protected]
4Unilever Centre for Molecular Science Informatics, Department of Chemistry,
University of Cambridge, Cambridge, UK
1Institut Pasteur, Unité de Bioinformatique Structurale; CNRS UMR 3825;
Département de Biologie Structurale et Chimie, 25, rue du Dr Roux, 75015 Paris, France
Full list of author information is available at the end of the article
prediction of compound-target combinations lying in regions of the drug-target interaction space which are sparsely sampled by experimental measurements. These techniques are based on the similarity principle [4,5], which follows the premise that similar compounds (and targets) [6] are more likely to exhibit akin bioactivity profiles in comparison to structurally distant structures. Among others, chemogenomic approaches have enabled: (i) the prediction of protein targets for new compounds based on the bioactivity profiles of similar compounds, [7-9] (ii) the study of protein similarity on the basis of the similarity of their ligands, [10,11] and (iii) receptor deorphanization [12].
In the field of chemogenomics, Proteochemometrics (PCM) [6] uses machine learning models to relate com-pounds to their biomolecular targets (usually proteins). PCM extends traditional Quantitative Structure-Activity
Relationship (QSAR) [13] by allowing to both inter- and extrapolate on the target and/or chemical spaces. There-fore, compounds can be optimized not only with respect to their affinity on a target, [14] but also by taking into account their selectivity [15]. In that way, PCM also permits to detect compound substructures confer-ring inhibitory activity to a panel of related biomolecular targets [14].
Although the relevance of PCM has been confirmed by bothin silicoand experimental validation, [6,16] current methods cannot: (i) inherently determine the applicabil-ity domain (AD) of a model, or (ii) provide individual confidence intervals for each prediction.
The applicability domain (AD) of a bioactivity model is defined as the range of chemical (and target in PCM) space to which the model can be reliably applied [17-19]. Therefore, the AD is a measure of the generalization prop-erties of a given model: the volume of chemical (descrip-tor) space that can be reliably predicted [20]. Given that compounds are encoded with descriptors when training predictive models, it is important to distinguish between the chemical space (referring to chemical structures) and the chemical descriptor space. This distinction is impor-tant as in the calculation of some popular descriptors (e.g.Morgan fingerprints) [21], chemical substructures are hashed: different chemical substructures are mapped at the same descriptor position. Consequently, two different structures in the chemical space can be represented by the same descriptor values. A detailed discussion of the differ-ent methods proposed to assess models AD can be found in Ref., [20] to which the interested reader is referred. In PCM, the AD is an essential feature, as extrapolation has to be used to predict the bioactivity fornewchemicals on newtargets [6].
In parallel to the concern about the evaluation of indi-vidual bioactivity predictions, recent publications have aimed at establishing the level of uncertainty in public bioactivity databases [22-25]. In this vein, Brownet al.[26] highlighted the importance of including the uncertainty of bioactivity data into the evaluation of models quality. Hence, predictive models should be assessed through: the analysis of the experimental error of the data, the evalua-tion of the models AD as well as the definievalua-tion of intervals of confidence for the predictions. However, acceptable levels of prediction errors are also determined by the con-text in which the model will be applied. Indeed, models exhibiting high prediction errors can be nevertheless use-ful in a high-throughput (HTS) campaign while not being suitable in lead optimization [26].
Bayesian inference provides a reliable theoretical frame-work to handle all previously mentioned aspects within a unique bioactivity model. Gaussian Processes (GP) are a non-parametric machine learning method based upon Bayesian inference: they thus permit an evaluation of
the AD of a given model as well as providing the most objective estimation of the predictions uncertainty. Fur-thermore, the experimental bioactivity errors can be used as model input. A GP prediction of a given compound-target combination is a Gaussian distribution whose vari-ance defines intervals of confidence: in principle, this variance measures the distance of the compound-target pair to the training set. GP models can be globally val-idated by traditional statistical metrics (e.g. R2 or Q2) [27-29] while also providing individual assessment for predictions. GP were firstly introduced in the field of QSAR modeling by Burdenet al.[30]. Later on, GP were also used for: (i) the modeling of ADMET properties, [31,32] (ii) the prediction of electrolyte solubility, [33] (iii) the bioactivity prediction of small peptide datasets, [34-36] (iv) protein engineering, [37] and (v) the bioactivity prediction of bioactivity-focused (GPCRs) combinatorial chemolibraries [38]. The purpose of the present study is to propose Gaussian Process (GP) to simultaneously model chemical and multispecies protein information in the frame of PCM. GP models are validated by compar-ing their performance to that of SVM uscompar-ing a panel of kernels on two PCM datasets extracted from ChEMBL database, [39] involving adenosine receptors (10,999 data points, 8 sequences) and aminergic GPCRs (24,593 data points, 91 sequences), and on a third dataset extracted from the literature concerning the catalytic activity of four dengue virus NS3 proteases (199 data points, 4 sequences). GP perform as well as SVM, with statistically non-significant differences in performance. Nonetheless, GP provide additional information with respect to SVM, namely the uncertainties on individual bioactivity pre-dictions. GP also permit the interpretation of the mod-els with respect to the targets of adenosine receptors and GPCR datasets, and also with respect to the ligand descriptors.
Methods Datasets Aminergic GPCRs
et al.[40] Further information about the dataset can be found in Table 1 and Additional file 1: Table S2.
Adenosine receptors
This dataset previously published by van Westenet al.[16] is composed of 10,999 bioactivity data points measured on the rat and human adenosine receptors,A1,A2A,A2B andA3. The dataset was extracted from ChEMBL 2. Only
compounds tested on rat or human receptors by radio-ligand binding assays and for whichpKibioactivity values were annotated with a ‘=’ relationship were included in the final dataset. Bioactivity values range from 4.50 to 10.52 pKiunits. Compounds were normalized and ionized at pH 7.4. Subsequently, they were assigned 2D coordinates and converted to fingerprints. See Table 1 for further details about the dataset.
Dengue virus NS3 proteases
This dataset was collected from the proteochemometric study published by Prusiset al., [41] which modeled the catalytic activity of the Dengue virus NS3 proteases from four viral serotypes using datapoints measured on 56 dif-ferent tetra-peptide substrates (Table 1). These substrates were designed to evaluate the role amino acid residues located at P1’-P4’ in the sequence. The catalytic effi-ciency was measured as the turnover number (kcat) for the cleavage of the substrate. In contrast to the two datasets presented above, the number of data points in this case was only 199.
Descriptors
Chemical compounds were described by Scitegic cir-cular fingerprints (ECFP_6 type), [21,42] calculated in PipelinePilot 8.5.0.200 [43]. For the calculation of keyed ECFP_6 fingerprints, each compound substructure, with a maximal diameter of three bonds, is treated as a com-pound feature. The substructures are then mapped into an unhashed array of counts, thus enabling the estimation
of their contribution to bioactivity (see Results and Discussion). The efficiency of these fingerprints to iden-tify chemical features relevant for bioactivity has been previously demonstrated [16,44]. Pairwise compound similarity plots were calculated in R using thevegan pack-age [45]. Protein amino acids of the GPCRs and adenosine receptors binding sites, as well as the Dengue virus NS3 proteases substrates, were described with five amino acid extended principal property scales (5 z-scales). The prop-erty calculation was conducted in R [46] via in-house scripts following the work of Sandberget al.[47]. In the GPCRs dataset a descriptor accounting for the amino acids side chain charge at pH 7.4 was also added (with values of: +1 if the charge is positive, -1 if negative and 0 for neutral amino acids). The four Dengue virus NS3 protease variants were described with binary descriptors.
Modeling with Bayesian inference Gaussian processes
Given a datasetD= X,ywhereX= xini=1is the set of compound and target descriptors, andy = yini=1is the vector of observed bioactivities, the aim is to find a Gaussian Process [48],GP(D), capable to infer the rela-tionships withinD, in order to predict the bioactivityy for new compound-target combinationsx. In the frame of Bayesian inference, GP are defined as:
P(GP(D)|D)∝P(y|GP(D),X)P(GP(D)) (1)
where: (i)P(GP(D)|D) is theposteriorprobability distri-bution giving the bioactivity predictions, (ii) the likelihood P(y|GP(D),X) is the probability of the observations,y, given the training set,Xand the modelGP(D), and (iii) P(GP(D))is thepriorprobability distribution of the func-tionsGP(D)candidates to model the datasetD.
The prior probability distribution is updated with the information contained inDvia the likelihood, leading to the definition of theposteriorprobability distribution as
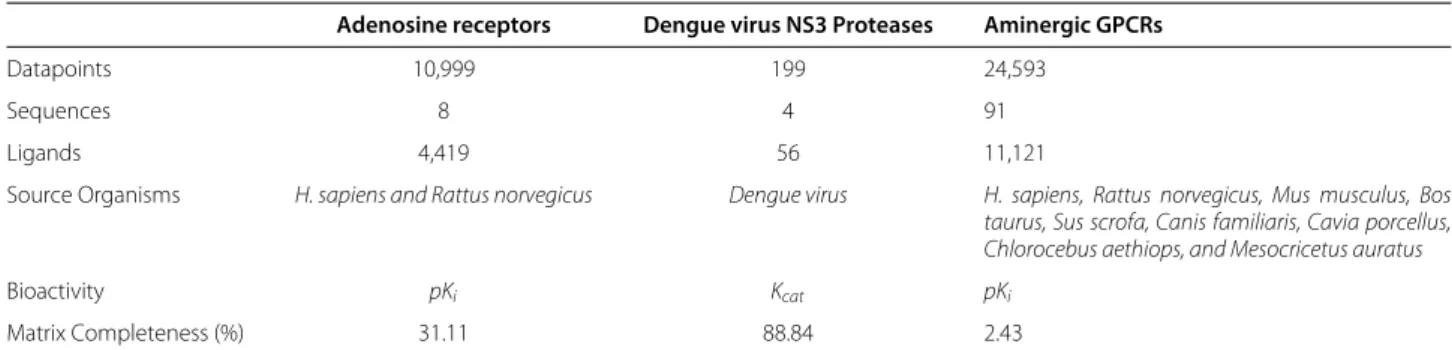
Table 1 Overview of the proteochemometric datasets modeled in this work
Adenosine receptors Dengue virus NS3 Proteases Aminergic GPCRs
Datapoints 10,999 199 24,593
Sequences 8 4 91
Ligands 4,419 56 11,121
Source Organisms H. sapiens and Rattus norvegicus Dengue virus H. sapiens, Rattus norvegicus, Mus musculus, Bos taurus, Sus scrofa, Canis familiaris, Cavia porcellus, Chlorocebus aethiops, and Mesocricetus auratus
Bioactivity pKi Kcat pKi
Matrix Completeness (%) 31.11 88.84 2.43
the set of functions efficiently modelingD. The average of theposteriordistribution is considered as the bioactivity prediction (Additional file 1: Figure S1).GP(D)is a ran-dom function which functional values follow a centered Gaussian distribution for any set of datapoints. Thus, the P(GP(D)) values for a finite subset of compound-target vectorsxi, ..,xn follow a multidimensional normal distribution with meanμand covariance matrixCX:
GP(D)∼N0,CX+σd2δ
xj,xk j,k∈1,. . .,n
(2)
whereδxj,xk
is the Kronecker delta function andσd2is the noise of the datapoints (experimental error), which is assumed to be normally distributed with mean zero. The value ofσd2accounts for the noise in the observed bioac-tivities, y = GP(D) +N0,σd2 which in turn reflects the trade-off between the quality and smoothness of the fitting.
CX is obtained by applying a positive definite
ker-nel function (also known as statisticcovariance) [49] to X,CX = Cov(X). Owing to the fact that the covariance function is based upon dot products, thekernel trickcan be applied in a similar way as in SVM [50]. Kernel param-eters are called hyperparamparam-eters since their values define the probability of each function of theprior probability distribution. The different kernels implemented in this study are listed in Additional file 1: Table S2.
Bioactivity prediction for new datapoints
The bioactivity,y, of a new compound-target combina-tion,x, can be predicted from the joint prior probability distributionP = yy
ofyandy, due to the multivariate
Gaussian distribution assumed forD:
y y
∼N
0,C=
CX=Cov(X), k=Cov(X,x) kT, m=Cov(x,x) (3)
wherekTis the transpose of the matrixk, which describes the similarity betweenXandx. The predicted bioactivity
is obtained as the mean value of the probability:
Py|x,D,y (4)
and the uncertainty of the prediction corresponds to the standard deviation of this probability distribution.
To calculate P(y|x,D,y), the joint probability
distri-bution,Pyy
, is divided by the probability of the observed bioactivities, P(y). Subsequently, the predicted probabil-ity foryis obtained by calculating the Schur complement
[51]:
P(y)∼N
μy =kTC−1
X y, σy2 =m−kTCX−1k
(5)
where the best estimate for the bioactivity of x is the average value ofy,μy = P(y), andσy, the standard
deviation, its uncertainty.
As can be seen in Eq. 5, those compound-target com-binations inXsimilar tox, contribute more to the pre-diction of y, as y is weighted by kT. This means that GP, as a kernel method, mainly infers the value of y
from the most similar compound-target combinations in descriptor space present in the training set,X.
On the other hand, the predicted variance,σy2, is equal
to the difference between thea priori knowledge about x:m = Cov(x,x), and what can be inferred aboutx
from similar compound-target combinations present in X:kTC−X1k. Thus, in the case ofx being similar to the compound-target combinations in X, the value of σy2 is
small. By contrast, a high value ofσy2 indicates thatxis
not similar (is distant) to the compound-target combina-tions inX. In that case, the GP cannot learn much about xfrom the training set, so the prediction should be
con-sider as less reliable. Consequently,σy2gives an idea of the
applicability domain (AD) of the model and thus serves to evaluate the uncertainty of the prediction.
Computational details
Determining the kernel hyperparameters
As previously stated (Equation 2), the prior distribu-tion of a GP is mainly defined by its covariance, CX, which is in turn characterized by its hyperparameter val-ues. For the simplest kernel, Radial Basis function ker-nel (RBF), also known as Squared Exponential or simply Radial (Additional file 1: Table S1), the hyperparameters are=l,σd2wherelare the length scales, (one per descriptor) and σd2 the noise variance. In this case, the covariance between two input vectors can be defined as:
Covxi,xj
=e− 1 2
P p=1
xip−xjp 2
lp2
(6)
where p is the descriptor index and P the total number of descriptors. Each length scale,l, is treated as a hyperpa-rameter wich value needs to be optimized during model training. High length scale values will be assigned to irrel-evant features for the model. Therefore, the inverse of the optimizedlvalue obtained for a given descriptor gives an idea of its importance for the model. This inherent abil-ity of Bayesian inference to infer the relevance of each descriptor is the so-called Automatic Relevance Determi-nation (ARD) [48]. In the context of PCM, ARD can be exploited to provide a biologically meaningful interpreta-tion of the models.
hyperparameter values maximizing the posterior proba-bility distribution over the hyperparameters:P(|D). In a Bayesian line of reasoning, this posterior probability can be expressed as:
P(|D)∼P(y|,X)P() (7)
whereP(y|,X), is the marginal likelihood:P(y|,X) =
P(y|GP(D)P(GP(D))dGP(D). The hyperparameter val-ues can thus be determined by maximizing the loga-rithm of the marginal likelihood [48,52]:
lnP(y|,X)= −1 2y
TC−1y− 1
2ln|C| − n
2ln 2π (8)
Several methods can be implemented to accomplish this multivariate optimization problem, such as a simplex method, Monte Carlo (MC) Sampling, [53] a genetic algo-rithm, nested sampling, [54] forward variable selection [31] or the conjugate gradient method [48].
In the present study, kernel hyperparameters were opti-mized by grid search andk-fold cross-validation (CV) in the case of the adenosine receptors and aminergic GPCRs datasets (section S1 of the Additional file 1), because of their large size and high number of descriptors. The experimental error, σd2, (Equation 2) was considered as fixed with a value of 0.29pKiunits, this value being taken from the work of Kramer et al. [22] The same length scale value,l, was used for all descriptors to simplify the hyperparameter optimization.
In the case of the dengue virus dataset, due to its small size, and to the lack of information concerning the experi-mental uncertainty, the noise variance,σd2, was optimized by conjugate gradient as implemented in the GPML tool-box [55]. As the number of descriptors is only 24, we optimized the length scales using the radial kernel. In the frame of Automatic Relevance Determination (ARD), the importance of each descriptor for the model was esti-mated using the inverse of the optimizedlvalues, in the way described above.
GP Tolerance to noise
To better understand the influence of the experimental error in GP modeling, we trained 15 models for each dataset with increasing levels of noise with both the radial and the normalized polynomial (NP) kernel, thus leading to a total number of 90 models. Their predictive ability was monitored on the external set. The levels of added noise (noise variance) ranged from 0 to a maximum value of 10, which corresponds to a noise deviation of 3.2pKi units for the adenosine receptors and GPCR datasets, and 3.2 log units for the dengue virus NS3 proteases dataset.
Machine learning analyses and implementation
Machine learning models were built in R using thecaret package [56]. Non-default kernels for GP were introduced
in the caret framework by in-house R scripts and by the definition of custom models (customoption in thecaret package) implementing kernel functions from either the kernlab[57] package or in-house kernel functions. Source code is available from the authors upon request. Likewise, The Gaussian Process for Machine Learning (GPML) Toolbox version 3.2 [55] was used to build GP models in Matlab version 7.15 [58] to assess the importance of ligand descriptors (Automatic Relevance Determination). The python packageinfpy[59] helped to generate Additional file 1: Figure S1. The data pre-processing and thein silico modeling pipeline are described in Additional file 1, along with model training and validation.
Assessment of maximum model performance
The Tropsha validation criteria, [27-29] (Equations S7-S10 in Additional file 1) were used for accepting or dismiss-ing the model (section Internal validation of Additional file 1). Hence, the distributions of minimum RMSEPext
and maximum, Q2ext, R20ext, and R2ext (Equations S3-S6 in Additional file 1) were calculated for each dataset in the following way. Firstly, a random sample, A, of the same size of the external set was drawn from the exper-imental bioactivity values. Secondly, the sample B was calculated by adding to A a random noise with mean zero and standard deviation equal to the experimental error. Then, the statistical metrics were calculated forA with respect toB. The calculation of statistical metrics on 1,000 generations of random samplesAand noisy samples B provided a distribution of statistical metrics for each dataset. These maximum and minimum values of the dis-tribution were then used to validate the metrics values obtained when evaluating the bioactivities predicted for the external sets. If the obtained metrics were beyond the maximum values (forQ2ext,R20ext, andR2ext) or the mini-mum values (for RMSEPext) of the distribution, the model
is likely to be over-optimistic. The experimental errors required to define the random samplesBwere determined in the following way. For adenosine and GPCR datasets, the experimental error ofpKi data was considered to be approximately 0.29pKi units, which corresponds to the average standard deviation value for public Ki datasets estimated by Krameret al.[22] The experimental error of the dengue dataset was inferred from the data by con-sidering its uncertainty as a hyperparameter of the GP model since we could not find information about the experimental uncertainty in the study of Prusiset al.[41].
Interpretation of ligand substructures
compound descriptors, and the difference between the predicted values in the presence or absence of a given feature were calculated. The average value of these differ-ences, weighted by the number of counts of the feature in each compound, corresponds to the contribution of that feature to bioactivity. The contribution was estimated for all compound features considered in the model. The sign of the difference ({+/-}) indicates if the feature is respec-tively beneficial or deleterious for compound bioactivity. This approach is closely related to the method proposed by van Westenet al., [14] although two modifications have been made: (i) the weighting of the average difference between predicted and observed bioactivities, and (ii) the calculation of descriptor importance on a per target basis.
Results
Model validation
PCM GP models agree with the validation criteria
Overall, the models obtained for the three datasets with Gaussian Process modeling display statistics in agreement with our validation criteria (Table 2 and Additional file 1: Table S3). To ensure that these results were not the con-sequence of spurious correlations, we trained GP models with randomized bioactivity values (y-scrambling) [60]. For all datasets, the intercept was negative, thus ensur-ing the statistical soundness of our modelensur-ing. The best GP model for the adenosine receptors dataset was obtained with the normalized polynomial (NP) kernel, exhibiting RMSEPext and R20ext values of 0.58 pKi units and 0.75 respectively. Similarly, in the case of the GPCRs dataset, the NP kernel led to the best predictive model, with RMSEPextandR20extvalues of 0.66pKiunits and 0.72. As these GP models were trained with a noise deviation of 0.54pKiunits, the subtraction of the experimental uncer-tainty, 0.54pKiunits, from the RMSEPextgives a residual
error arising from the modeling below 0.12 pKi units. These RMSEPextvalues correspond to 6.05% and 10.88%
of the range of bioactivity values in the training set for the GPCRs and the adenosine receptors datasets. In the case of the dengue virus dataset, GP models show bet-ter predictive ability than those reported by Prusiset al., [41] as Q2ext value of 0.92 is obtained here (Additional file 1: Table S3) for the best GP model based on the Bessel kernel. The optimization of the noise variance,σd2, as an hyperparameter during the training process led to a value of 0.27 log units, similar to the values of about 0.3 log units reported by Prusiset al.[61] in a recent study with similar experimental setup.
GP statistics are within the limits of the theoretical maximum model performance
The distributions of maximum R2ext, R20ext, and Q2ext and minimum RMSEPext theoretical values, obtained as
described in subsection Assessment of maximum model performance in Methods, are given in Additional file 1: Figure S2 for the three datasets. The mean value of the distribution of maximumR20ext values are equal to 0.80, 0.68 and 0.96 for the adenosine, GPCRs, and dengue virus NS3 proteases datasets, which highlights that the maximum correlation values that can be obtained when modeling public data are far from the optimal maxi-mum correlation value of one. This is not surprising given the noise levels in public bioactivity data [22,23]. The best RMSEPext andR20ext values (Table 2) obtained with GP are respectively: 0.58 and 0.75 (adenosine recep-tors), 0.66 and 0.72 (GPCRs), and 0.44 and 0.92 (dengue virus NS3 proteases), which remain in the limits of these extreme theoretical values (Additional file 1: Figure S2), thus supporting the suitability of our modeling pipeline to handle data uncertainty. The mean values of the the-oretical RMSEP distribution were close to the exper-imental uncertainty on bioactivity, for the adenosine receptors and the dengue virus NS3 proteases datasets, with respective mean RMSEPextvalues of 0.54pKiunits and 0.27 log units (Additional file 1: Figure S2). How-ever, the mean RMSEPextvalue increases up to 0.68 pKi units for the GPCRs dataset owing to its larger size and sparsity.
PCM outperforms QSAR on the studied datasets
A comparison between models trained on only compound descriptors (‘Family QSAR’) [62] and PCM permits to assess whether the use of GP improved the bioactivity modeling, by simultaneously modeling the target and the chemical spaces within a PCM study [6]. Indeed, radial kerneled Family QSAR models with ligand descriptors (Table 2) failed to model the data, being the RMSEPextand R20extvalues respectively: 0.96 and 0.31 (adenosine recep-tors), 0.97 and 0.38 (GPCRs), and 1.13 and 0.48 (dengue virus NS3 proteases).
Strong mapping power of the normalized polynomial kernel
Radial and polynomial kernels have been traditionally used in QSAR and PCM modeling, [16,63] but the ver-satility of other kernels for bioactivity modeling has been recently demonstrated [63-65]. To investigate this point in the frame of GP models, we compared the performance of various kernels (Bessel, Laplacian, NP, and PUK) with the radial and polynomial kernels.
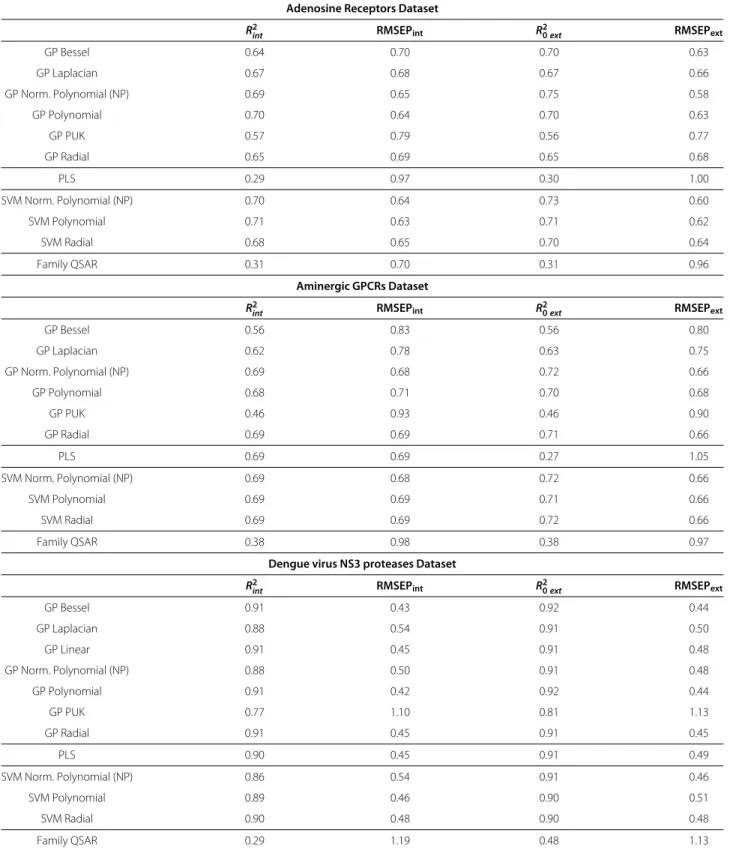
Table 2 Internal and external validation metrics for the PCM models
Adenosine Receptors Dataset
R2
int RMSEPint R20ext RMSEPext
GP Bessel 0.64 0.70 0.70 0.63
GP Laplacian 0.67 0.68 0.67 0.66
GP Norm. Polynomial (NP) 0.69 0.65 0.75 0.58
GP Polynomial 0.70 0.64 0.70 0.63
GP PUK 0.57 0.79 0.56 0.77
GP Radial 0.65 0.69 0.65 0.68
PLS 0.29 0.97 0.30 1.00
SVM Norm. Polynomial (NP) 0.70 0.64 0.73 0.60
SVM Polynomial 0.71 0.63 0.71 0.62
SVM Radial 0.68 0.65 0.70 0.64
Family QSAR 0.31 0.70 0.31 0.96
Aminergic GPCRs Dataset
R2
int RMSEPint R20ext RMSEPext
GP Bessel 0.56 0.83 0.56 0.80
GP Laplacian 0.62 0.78 0.63 0.75
GP Norm. Polynomial (NP) 0.69 0.68 0.72 0.66
GP Polynomial 0.68 0.71 0.70 0.68
GP PUK 0.46 0.93 0.46 0.90
GP Radial 0.69 0.69 0.71 0.66
PLS 0.69 0.69 0.27 1.05
SVM Norm. Polynomial (NP) 0.69 0.68 0.72 0.66
SVM Polynomial 0.69 0.69 0.71 0.66
SVM Radial 0.69 0.69 0.72 0.66
Family QSAR 0.38 0.98 0.38 0.97
Dengue virus NS3 proteases Dataset
R2
int RMSEPint R20ext RMSEPext
GP Bessel 0.91 0.43 0.92 0.44
GP Laplacian 0.88 0.54 0.91 0.50
GP Linear 0.91 0.45 0.91 0.48
GP Norm. Polynomial (NP) 0.88 0.50 0.91 0.48
GP Polynomial 0.91 0.42 0.92 0.44
GP PUK 0.77 1.10 0.81 1.13
GP Radial 0.91 0.45 0.91 0.45
PLS 0.90 0.45 0.91 0.49
SVM Norm. Polynomial (NP) 0.86 0.54 0.91 0.46
SVM Polynomial 0.89 0.46 0.90 0.51
SVM Radial 0.90 0.48 0.90 0.48
Family QSAR 0.29 1.19 0.48 1.13
For the three datasets, the best models are obtained with GP, being the lowest RMSEPextand highestR20extvalues: (i) adenosine receptors: 0.58 and 0.75 with NP
kernel, (ii) GPCRs: 0.66 and 0.72 with NP kernel, and (iii) Dengue virus NS3 proteases 0.44 and 0.92 with Bessel kernel. Overall, GP models for the three datasets agree with the validation criteria.
R20ext values of 0.44 and 0.92 (Table 2). The PUK kernel [65] exhibited strong mapping power in previous stud-ies of HIV-1 proteases and histone deacetylases (HDAC) inhibitors, [63,64] but in the present study we could not obtain satisfactory models for none of the three datasets. The Laplacian and Bessel kernels allow a proper mapping of the three datasets withR20ext values within the range 0.60–0.90 (see Table 2 for further details).
For the adenosine receptors dataset, different statistics values are observed between the internal and external val-idation, as the RMSEPext values are larger for the radial
kernel (0.68) than for the polynomial and Bessel kernels (0.63 in both cases). Nonetheless, a different picture is observed for RMSEPint, as the values for the radial,
poly-nomial and Bessel kernels are 0.69, 0.64 and 0.70pKiunits. Although RMSEPextand RMSEPintvalues are similar, the
small increase of RMSEPext with the Bessel kernel might
suggest a slight degree of overfitting [66].
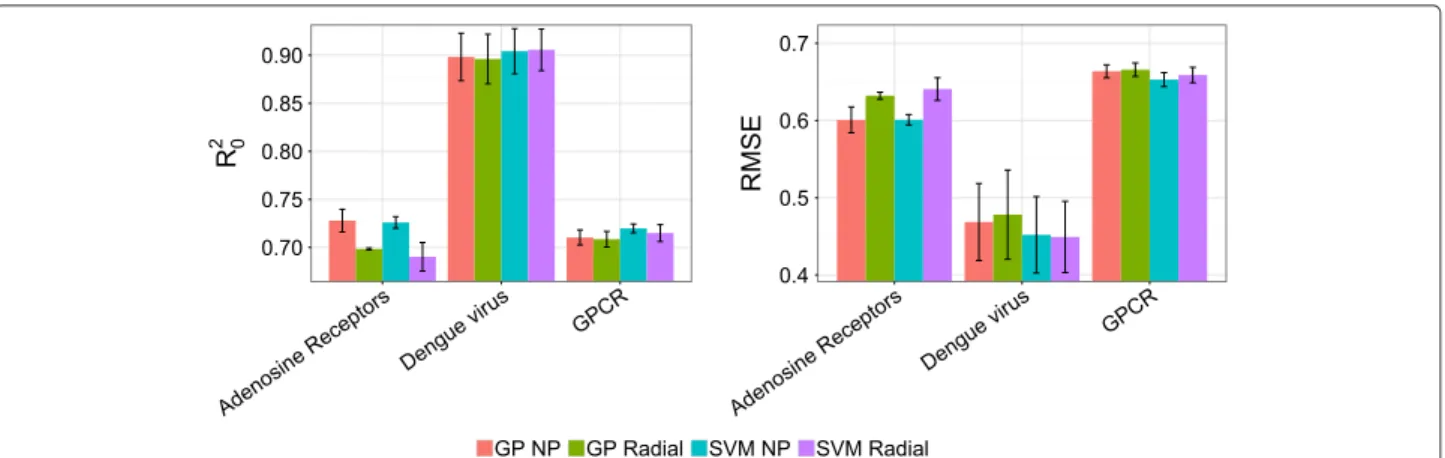
GP and SVM perform on par
The performance of the GP and SVM models was compared for each dataset using the radial, the poly-nomial, and the NP kernels, as the first two are the most widespread kernels within the modeling community [15,16,63]. Using different seed values, we trained ten dif-ferent models for each modeling technique and dataset, resulting in a total of 60 models (Figure 1). To be able to statistically test the difference between the models results, distributions of the RMSEPext and R20ext were gener-ated for each kernel/dataset combination. Both RMSEPext
andR20extstatistics were normally distributed in all cases (Shapiro-Wilk normality test, α 0.05), and a two-tailed t-test of independent samples (α0.05) was applied to com-pare the behavior of SVM and GP. As it can be seen in
Figure 1 and from the result of thet-test, both SVM and GP perform on par in the three case studies for radial and NP kernels. Similar results (data not shown) were obtained for the polynomial kernel.
To probe the linearity of the datasets, we trained lin-ear PLS models. For two datasets, PLS applin-ears unable to infer the complex (non-linear) relationships within the data, leading to RMSEPextandR20ext of 1.00 and 0.30 for the adenosine receptors, and 1.05 and 0.27 for the GPCRs datasets, respectively (Table 2). At contrary, the dengue NS3 proteases dataset presents a clearly linear relation-ship, with RMSEPextandR20extvalues of the PLS model of 0.49 and 0.91. However, on the same dataset, the model obtained with a linear kerneled GP model slightly outper-formed PLS, with respective RMSEPext andR20ext values
of 0.48 and 0.91.
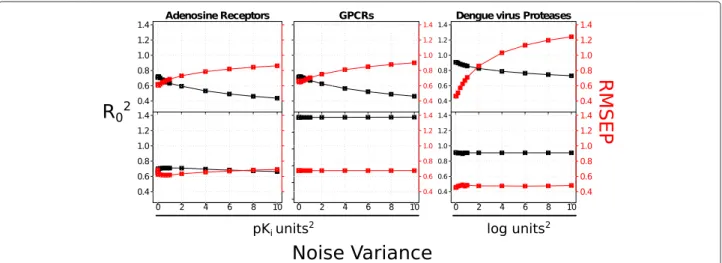
Noise influence on GP depends on the kernel
RMSEPextandR20extwere calculated for adenosine recep-tors, GPCRs, and dengue virus NS3 proteases for different levels of noise σd2 added to the diagonal of the covari-ance matrix CX (Equation 2). The results obtained for radial kernels (Figure 2, upper plots) appear more sensi-tive to the noise than the ones obtained for NP kernels (Figure 2, bottom plots), for which the variations of the RMSEPextandR20ext sets are lower than 0.10 pKi or log units. This trend is more obvious for the dengue virus NS3 proteases dataset, probably originating from the small size of this dataset. The polynomial kernel (data not shown) displays robustness similar to those of NP kernel. These analyses suggest that NP or polynomial kernels would constitute a reasonable choice when modeling noisy data. To summarize, GP models performon parwith SVM and outperform Family QSAR and PLS on the three datasets.
0.70 0.75 0.80 0.85 0.90
Adenosine Receptors Dengue vir
us
GPCR
R0
2
0.4 0.5 0.6 0.7
Adenosine Receptors
Dengue vir us
GPCR
RMSE
GP NP GP Radial SVM NP SVM Radial
Figure 2Noise influence in model performance.RMSEPext(red) andR20ext(black) values obtained when increasing the noise level (noise
variance added to the diagonal of the covariance matrix) were calculated for: adenosine receptors (left figure), GPCRs (medium figure) and dengue virus NS3 proteases (right figure). Upper plots correspond to GP models calculated with the radial kernel while the bottom plots refer to GP models with the normalized polynomial (NP) kernel. In all cases, the radial kernel appears more sensitive to noise, while the NP kernel performs equally well when noise is added to the data. These data suggest that the NP kernel is more appropriate for the modeling of noisy PCM datasets.
The NP kernel leads to the best GP models being also the most tolerant kernel to noisy bioactivities. GP models trained on the dengue virus NS3 proteases systematically display better metrics than the other datasets, likely due to the high matrix completeness (88.84%) of this dataset (Table 1).
Predicted confidence intervals follow the cumulative density function of the Gaussian distribution GP predictions mostly follow the cumulative Gaussian distribution
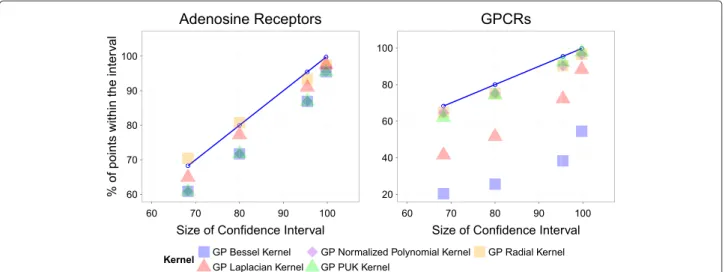
To analyze the reliability of the error bars obtained with GP with the tested kernels, different intervals of confi-dence (IC) for each predicted bioactivity value on the external set were defined, namely: 68%, 80%, 95%, and 99%. Subsequently, the percentage of compound-target combinations for which the experimental bioactivity value lied within the bounds of each interval was calculated. Fol-lowing the cumulative density function of the Gaussian distribution (cumulative Gaussian distribution), [33] the percentage of satisfactory cases should be proportional to the interval size.
To test this hypothesis, the percentages of predicted bioactivities for which the experimental values were within the confidence intervals were compared to the size of these intervals (Figure 3). As the small size of the dengue virus NS3 proteases did not allow a good sam-pling of the Gaussian distribution, this dataset was not included in the comparison. This analysis was thus per-formed for the adenosine receptors and GPRCs datasets with the Bessel, Laplacian, NP, PUK, and radial kernels. It is noteworthy that the predicted variance obtained with the polynomial kernel is much larger than the range
of bioactivity values, thus making impossible to evalu-ate their concordance with the cumulative distribution. However, the NP kernel allows to obtain values within the interval{0, 1}for the predicted variance thanks to its normalized formulation.
The experimental values for the radial kernel match the theoretically expected behavior, represented on Figure 3 by bullet points connected by a blue line, and calculated in the context of a Gaussian cumulative function. The match between experiment and theory holds for the PUK and NP kernels for both datasets. The difference between the cumulative Gaussian distribution and the different inter-vals of confidence calculated for the Adenosine receptors dataset is around 10% for the other kernels (Figure 3, left plot). By contrast the Bessel and Laplacian kernels do not provide informative intervals of confidence for the GPCRs dataset (Figure 3, right plot).
GP determine the applicability domain of the model
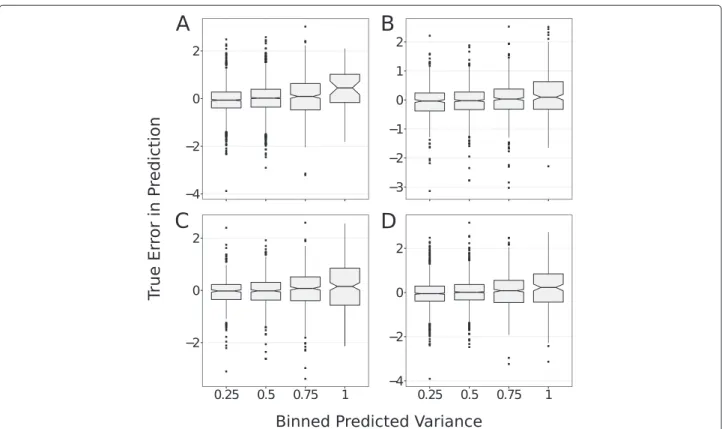
The variance predicted with GP models, σy2, quantifies
how much information the model can infer from the data (Eq. 5). Therefore, we hypothesized that: the dis-tribution of the differences between the predicted and the observed bioactivity values, are more dispersed for compound-target pairs distant from the training set (high values of σy2). To verify this hypothesis, we binned the
60 70 80 90 100
60 70 80 90 100
Size of Confidence Interval
% of points within the inter
v
al
Adenosine Receptors
20 40 60 80 100
60 70 80 90 100
Size of Confidence Interval
GPCRs
Kernel GP Bessel Kernel
GP Laplacian Kernel
GP Normalized Polynomial Kernel GP PUK Kernel
GP Radial Kernel
Figure 3Analysis of the confidence intervals predicted on (left) the adenosine receptors and (right) aminergic GPCRs external sets.The percentages of annotated values lying within the intervals of confidence of 68%, 80%, 95% and 99% (ordinate axis) are depicted versus the size of the intervals. The blue line defines the theoretical proportionality between the size of confidence intervals and the number of points within the intervals, in the frame of the Gaussian cumulative function. The radial, PUK, and normalized polynomial (NP) kernels are in close conformity with the cumulative Gaussian distribution in both datasets, while the Laplacian and Bessel exhibit a diverse behavior depending on the dataset. Therefore, GP provide prediction errors in agreement with the Cumulative Gaussian distribution which can be reliably used to define intervals of confidence for the predictions.
dispersion of the distribution of the differences increases with the errors predicted by GP, irrespective of the ker-nel or dataset considered, this error can be thus con-sidered as a reliable estimate of the applicability domain (AD).
Interestingly, while the average differences between pre-dicted and observed bioactivities are close to zero for the subsets of GP errors of 0.25, 0.5 and 0.75, this average value is biased towards few tenths of apKiunit (Figure 4) for the subset displaying the largest GP error. This obser-vation indicates that errors on bioactivities are underesti-mated by the GP model for compound-target pairs distant from the training set. GP models with the NP and radial kernels provide prediction errors in agreement with the cumulative Gaussian distribution, which is the maximum theoretical precision attainable. Furthermore, the applica-bility domain of GP models can be determined from the errors predicted by GP.
Analysis of GP performancepertarget
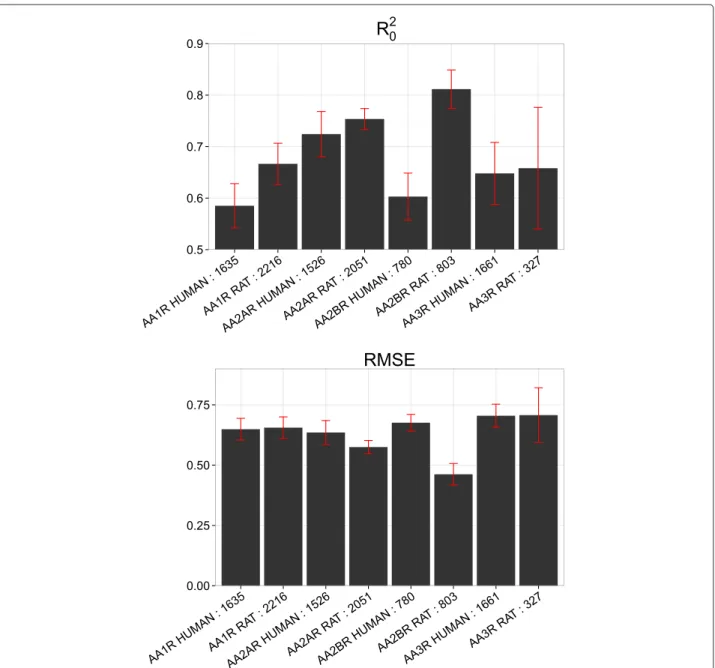
To further understand the predictive capability of GP models on each analyzed target, we trained ten GP mod-els with the NP kernel. Different seed values were used for the generation of the training and the external sets. Once the GP predictions have been obtained, we divided the external set into subsets grouped by target, and calculated averageR20extand RMSEPextvalues on these subsets. This
analysis per target was conducted only on the datasets of adenosine receptors and GPCRs, because of their large sizes and numbers of involved targets.
Adenosine receptors
The highest mean RMSEPext value is between 0.70 and
0.75 pKi units, and the lowest mean R20ext value is 0.62 (Figure 5). In this dataset, the performance is not directly related to the number of compounds annotated per tar-get. Indeed, the best result is obtained on the rat A2b receptor (AA2BR RAT, 803 compounds) whereas one of the worst results is displayed by the humanA1receptor
(AA1R HUMAN, 1635 compounds).
On the other hand, the results cannot be related to the chemical diversity of the compounds, analyzed with pair-wise Tanimoto similarity (Additional file 1: Figure S3). Indeed, the two targets displaying the largest variabil-ity in the range of 0.50–0.75 Tanimoto similarvariabil-ity are rat A3 (AA3R RAT) and human A2b (AA2BR HUMAN), for which quite different performances are observed (RMSEPext in the 0.70–0.75 range and in the 0.59–0.61
range respectively: Figure 5). Similarly, humanA1(AA1R
HUMAN) andA2a(AA2AR HUMAN) receptors, display the smallest variability for compounds, and show quite different levels of performance (R20ext in the 0.56–0.60 range and in the 0.70–0.74 range respectively).
Figure 4GP determine models applicability domain.The differences between the true and predicted bioactivities (y axis) and the errors on predictions estimated by the GP model (x axis) are compared for the adenosine receptor dataset with radial(A)and NP(B)kernel, and for the GPCRs dataset with radial(C)and NP(D)kernels. The distribution of the differences between true and predicted bioactivities increases with the GP error on the prediction. This validates that the GP error is a measurement of the Applicability Domain (AD) of the model.
GPCRs
In the GPCR dataset, the best RMSEPext(Additional file 1:
Figure S4) andR20ext(Additional file 1: Figure S5) values are obtained on target subsets with a number of anno-tated compounds larger than 200 (in grey in Additional file 1: Figures S4 and S5). Between the subsets, no major differences in performance are observed for an amount of annotated compounds between several hundreds and over 1500. It is however noticeable that the predictive abil-ity of the models increased as the target space included in the training dataset broadened. Indeed, a bioactiv-ity selection previously done including information from 26 human aminergic GPCRs (4,951 datapoints), marked with an asterisk in Additional file 1: Table S2, did not produce any sound statistical metrics, as R20ext values lower than 0.40 were obtained whatever the kernel or machine learning algorithm used. But, the addition to the first selection of the bioactivities measured on mammal orthologues improved the prediction, although some of the additional bioactivity sets were singletons (Additional file 1: Table S2).
A large diversity of performance with RMSEPextvalues
in the range of 0.00–2.50 pKi units is observed for the targets annotated with one compound (Additional file 1: Figure S4). A relationship can be nevertheless established
between these performances and the number of anno-tated compounds on orthologues proteins. For example, the 5-HT2C mouse receptor (5HT2C MOUSE) anno-tated with three compounds exhibits a mean RMSEPext
value between 0.00 and 0.20pKi units (Additional file 1: Figure S4), because 345 and 558 compounds are respec-tively annotated on the orthologue rat and human 5-HT2C receptors. The good performance obtained for this mouse receptor is probably due to the similarity of the 345 and 558 compounds to the ones annotated to the 5-HT2C mouse receptor. The importance of various targets for GP prediction was assessed for the adenosine receptors and GPCRs datasets. To obtain statistically validated models, a balance has to be found between two trends: (i) the inclu-sion of bioactivity information from orthologues improves the predictive ability of the models for both datasets, but (ii) an increase of the chemical diversity might hamper the acquisition of sound models as shown for the adenosine receptors dataset.
Model interpretation of ligand descriptors Compounds bioactivity depends on multiple weak contributions of chemical substructures
0.5 0.6 0.7 0.8 0.9
AA1R HUMAN : 1635 AA1R RA
T : 2216
AA2AR HUMAN : 1526 AA2AR RA
T : 2051
AA2BR HUMAN : 780 AA2BR RA
T : 803
AA3R HUMAN : 1661 AA3R RA
T : 327
R
020.00 0.25 0.50 0.75
AA1R HUMAN : 1635 AA1R RA
T : 2216
AA2AR HUMAN : 1526 AA2AR RA
T : 2051
AA2BR HUMAN : 780 AA2BR RA
T : 803
AA3R HUMAN : 1661 AA3R RA
T : 327
RMSE
Figure 5Model performance per target on the external set for the adenosine receptors dataset.The upper panel corresponds toR20ext, while the lower panel to RMSEPext. These values were averaged for ten models trained on each subset corresponding to a given target. The best modeled
target is the rat adenosineA2breceptor (AA2BR RAT), while the worst is the ratA3receptor (AA3R RAT). In all cases, the mean RMSEPextvalues are
below 0.75pKiunits, indicating that GP modeling can predict compounds bioactivities on subsets corresponding to a given target.
was analyzed as described in section Interpretation of ligand substructures. In the present study, the contri-bution of more than 90% of substructures to the pKi values is close to zero (black regions in Additional file 1: Figure S6). We observed similarly (data not shown) that chemical substructures contributing in a very variable way to the pKi values (average contribution equal to zero and standard deviations in the range of 0.50 - 1.00 pKi units), are present in sets of compounds displaying large variability in experimental bioactivity on a given target.
Hence, more than 90% of the substructures from the datasets analyzed here, display alternatively the follow-ing properties: (i) they are not implicated in compound bioactivity as their presence or absence does not influence compounds bioactivity, (ii) their contribution to the pKi values, is conditioned to the presence or absence of other substructures [70].
even those few substructures with a large contribution, highlighted in Additional file 1: Figure S6, do not explain a large proportion of the bioactivity.
ARD provides a biologically meaningful interpretation of PCM models
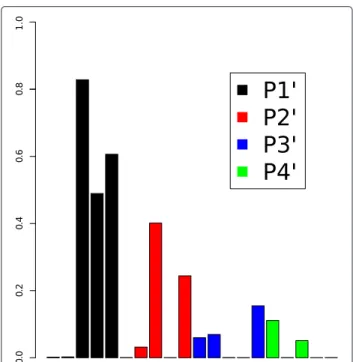
The substrates in the dengue virus NS3 proteases dataset are tetra-peptides. The relative importance of the four residues of these tetra-peptides was deconvoluted in the frame of ARD, described in Materials and Methods, by taking the inverse of the optimizedlvalue of the radial ker-nel (Figure 6). The largest inverse values are obtained for P1’ followed by P2’, P3’ and P4’ displaying similar values. Thus, the first amino acid (P1’) is the most relevant for the model followed by the second one (P2’), in contrast to the third and fourth ones (P3’ and P4’). In the study of Prusis et al., [41] the PLS coefficients with the highest values cor-respond to the first and second amino acids, as it is also the case here. A further detailed comparison of the PLS and the presented GP model is beyond the scope of this study. However, it should be noticed that the descriptors used in the present study and in Ref [41]. differ: 5 z-scales in our case versus 3 z-scales, C7.4, t1-Rig, and t2-Flex [71] in the PLS model. Although the PLS and GP models might
Figure 6Descriptor importance for the dengue virus NS3 proteases dataset.Descriptor importance is calculated in the frame of Bayesian Automatic Relevance Determination (ARD) as the inverse of the value of the length scale of each descriptor. The descriptors of the first and second residues of the tetra-peptides (positions P1’ and P2’) are the most relevant for the model. This is in agreement with the higher influence of these two substrate positions for the cleavage rates of the proteases.
assign different weights to the different descriptors, they both identify the first amino acid position as having the largest influence onKcat, in agreement with experimental results [41].
GP models were interpreted on the basis of ligand descriptors. For datasets where ligands are compound descriptors (GPCRs and adenosine receptors datasets), the interpretation was not conclusive. By contrast, the interpretation of GP models according to the amino acids of the tetra-peptide ligands in the dengue datasets gave biologically meaningful results, in agreement with the sci-entific literature [41]. In that way, ARD can be applied to biologically interpret systems: e.g. identify residues responsible for compound binding. Additionally, ARD with the radial kernel can model non-linear relationships, which is not possible with PLS without the introduction of (not easily interpretable) cross-terms [6,41].
Discussion
In the present study, we have demonstrated that Gaussian Processes (GP) allow to predict compound bioactivities on biomolecular targets. The statistically soundness of GP models is observed for a broad panel of kernels, among which the NP and radial kernels display the best results. GP and SVM display statistically similar performance for the modeling of multispecies proteochemometric datasets of different sizes. Moreover, Family QSAR and PCM mod-els were trained on the same number of datapoints and PCM produced much better results than Family QSAR, due to the introduction of target descriptors.
GP were applied on the following datasets: two large datasets involving GPCRs and adenosine receptors and one small dataset (199 datapoints) comprising four dengue NS3 proteases. The dengue dataset exhibits a high degree of linearity, as demonstrated by the high perfor-mance of both PLS and GP with a linear kernel on this dataset. Unsurprisingly, a better performance of GP is observed with different kernels for the dengue dataset than for the two other ones, due to the high matrix completeness in the dengue dataset and to its linearity. The satisfactory results obtained for the dengue dataset encourages the application of GP to model relatively small datasets issued from a single laboratory. The use of such in-house datasets would reduce the bias introduced by annotation errors and by the use of non-normalized experimental conditions.
would reduce the AD. Our understanding of the results obtained here is that the incorporation of bioactivity data from a wide range of species led to a significant increase of models performance given that binding patterns tend to be conserved among orthologues [73]. We have seen on the GPCR dataset, that the inclusion of singletons compounds bioactivities on human orthologues helps to increase models performance. This may be of tremen-dous relevance in the often encountered cases where lim-ited bioactivity information is known on a given human target, but a much larger number of bioactivities have been measured on orthologues of this target [16,73,74]. Our results suggest that the chemical diversity consid-ered and the number of datapoints have to be balanced to obtain sound models while exhibiting proper predictive abilities.
An additional outcome of GP with respect to SVM is the estimation of the uncertainty of predictions. Indeed, the Bayesian formulation of GP permits to obtain inter-vals of confidence for individual predictions defined from the GP predicted variance. These intervals were shown to be in agreement with the cumulative Gaussian distri-bution when using the radial and NP kernels, but not always for the Bessel or Laplacian kernels, highlighting that the kernel choice has to be made in the light of both models performance and reliability of the predicted variances. We have also shown here that GP using as covariance function the polynomial or the NP kernel can handle noisy datasets, as the GP performance is only slightly affected when noise is introduced in the data. Nonetheless, each kernel should be chosen in the light of underlying structure of the dataset, as the kernel con-trols the prior distribution over functions, and thus the models generalization properties [48,75]. It is noteworthy to mention that we have implemented a broad, though not exhaustive, panel of kernels, which is susceptible to be further completed with other base kernels or kernel combinations (composite kernels) [48,75,76].
GP can consider individual experimental errors as input for the probabilistic model which may constitute a preem-inent advantage when gathering information from diverse sources, each of which including distinct levels of experi-mental uncertainty [33]. In the present study, an approxi-mation of the experimental uncertainty of heterogeneous pKi values, recently reported by Kramer et al. [22] to exhibit a standard deviation of 0.54 pKi units, has been introduced in the model. Nonetheless, GP allow the inclu-sion of the uncertainty of each individual datapoint into the model, which might lead to a more accurate model-ing pipeline in cases where the experimental uncertainty of each datapoint is available.
Traditionally, the application of GP to model large datasets has been limited since the inversion of the covari-ance matrix scales with the cube of its dimension,i.e.GP
is an algorithm of complexityO(N3)[31,48]. In the present study, we have not reported training times since mod-els have been trained with GP implementations coded in different programming languages (subsection Machine learning analyses and implementation). In the experience of the authors, the application of ARD is limited by the size of the datasets, being not applicable in practice to datasets with more than several thousands of datapoints, or with more than several hundreds of descriptors. Neverthe-less, new GP implementations have proved to seemingly decrease calculation times, [77-79] which might increase the applicability of GP to large PCM datasets in the future. Overall, we have shown here that GP simultaneously provides bioactivity predictions and assessment of their reliability. The application of GP to PCM datasets, gives the insight that GP could also be very useful in the drug discovery for personalized medicine, when the target space includes several mutants of a given target [15,80]. In the same way, GP could even be used in the context of decision making in clinics [81].
Conclusion
Gaussian Processes (GP) have been proposed and tested for the prediction of bioactivity measurements, and found to perform at the same level of statistical significance as Support Vector Machines (SVM). In addition, GP is the only method, up to now, to give predictions as probability distributions, thus permitting the estimation of errors on the bioactivity predictions as well as an estimation of the applicability domain. Moreover, GP are tolerant to noisy bioactivities. GP models trained on PCM datasets can also be used to analyze the effect of ligand features (compound substructures or peptide residues).
Additional file
Additional file 1: Supplementary information.This file contains (i) the modeling pipeline used in this study, (ii) supplementary figures, and (iii) supplementary tables.
Competing interests
The authors declare that they have no competing interests.
Authors’ contributions
ICC, AB, and TM designed the study. ICC trained the models, analyzed the results and prepared the figures. GvW, EBL, and ICC provided datasets and descriptor calculations. DM provided analytical tools. ICC, GvW, AB, and TM wrote the paper. All authors read and approved the final manuscript.
Acknowledgments
Author details
1Institut Pasteur, Unité de Bioinformatique Structurale; CNRS UMR 3825;
Département de Biologie Structurale et Chimie, 25, rue du Dr Roux, 75015 Paris, France.2ChEMBL Group, European Molecular Biology Laboratory European Bioinformatics Institute, Wellcome Trust Genome Campus, CB10 1SD, Hinxton, Cambridge, UK.3Division of Medicinal Chemistry, Leiden Academic Center for Drug Research, Leiden, The Netherlands.4Unilever
Centre for Molecular Science Informatics, Department of Chemistry, University of Cambridge, Cambridge, UK.
Received: 5 March 2014 Accepted: 18 June 2014 Published: 28 June 2014
References
1. Caron PR, Mullican MD, Mashal RD, Wilson KP, Su MS, Murcko MA: Chemogenomic approaches to drug discovery.Curr Opin Chem Biol 2001,5(4):464–470.
2. Bieler M, Koeppen H:The role of chemogenomics in the pharmaceutical industry.Drug Dev Res2012,73(7):357–364. 3. Koutsoukas A, Simms B, Kirchmair J, Bond PJ, Whitmore AV, Zimmer S,
Young MP, Jenkins JL, Glick M, Glen RC, Bender A:From in silico target prediction to multi-target drug design: current databases, methods and applications.J Proteomics2011,74(12):2554–2574.
4. Concepts and Applications of Molecular Similarity. 1st(Johnson MA, Maggiora GM, eds.) New York: Wiley-Interscience; 1990.
5. Keiser MJ, Setola V, Irwin JJ, Laggner C, Abbas AI, Hufeisen SJ, Jensen NH, Kuijer MB, Matos RC, Tran TB, Whaley R, Glennon RA, Hert J, Thomas KLH, Edwards DD, Shoichet BK, Roth BL:Predicting new molecular targets for known drugs.Nature2009,462(7270):175–181.
6. van Westen GJP, Wegner JK, IJzerman AP, van Vlijmen HWT, Bender A: Proteochemometric modeling as a tool to design selective compounds and for extrapolating to novel targets.Med Chem Commun2011,2:16–30.
7. Koutsoukas A, Lowe R, KalantarMotamedi Y, Mussa HY, Klaffke W, Mitchell JBO, Glen RC, Bender A:In silico target predictions: defining a benchmarking data set and comparison of performance of the multiclass naïve bayes and parzen-rosenblatt window.J Chem Inf Model2013,53(8):1957–1966.
8. Lounkine E, Keiser MJ, Whitebread S, Mikhailov D, Hamon J, Jenkins JL, Lavan P, Weber E, Doak AK, Cote S, Shoichet BK, Urban L:Large-scale prediction and testing of drug activity on side-effect targets.Nature 2012,486(7403):361–367.
9. Dakshanamurthy S, Issa NT, Assefnia S, Seshasayee A, Peters OJ, Madhavan S, Uren A, Brown ML, Byers SW:Predicting new indications for approved drugs using a proteochemometric method.J Med Chem 2012,55(15):6832–6848.
10. van Westen GJP, Overington JP:A ligand’s-eye view of protein similarity.Nat Methods2013,10(2):116–117.
11. Doddareddy MR, van Westen GJP, van der Horst, E, Peironcely JE, Corthals F, Ijzerman AP, Emmerich M, Jenkins JL, Bender A:Chemogenomics: Looking at biology through the lens of chemistry.Stat Anal Data Min 2009,2(3):149–160.
12. van der Horst, E, Peironcely JE, van Westen GJ, van den Hoven, OO, Galloway WR, Spring DR, Wegner JK, van Vlijmen HW, Ijzerman AP, Overington JP, Bender A:Chemogenomics approaches for receptor deorphanization and extensions of the chemogenomics concept to phenotypic space.Curr Top Med Chem2011,11(15):1964–1977. 13. Dudek AZ, Arodz T, Gálvez J:Computational methods in developing
quantitative structure-activity relationships (QSAR): a review.Comb Chem High Throughput Screen2006,9(3):213–228.
14. van Westen GJP, Wegner JK, Geluykens P, Kwanten L, Vereycken I, Peeters A, IJzerman AP, van Vlijmen HWT, Bender A:Which compound to select in lead optimization? prospectively validated proteochemometric models guide preclinical development.PLoS ONE2011,6(11):27518. 15. van Westen GJ, Hendriks A, Wegner JK, Ijzerman AP, van Vlijmen HW,
Bender A:Significantly improved HIV inhibitor efficacy prediction employing proteochemometric models generated from antivirogram data.PLoS Comput Biol2013,9(2):1002899.
16. van Westen GJP, van den Hoven, OO, van der Pijl, R, Mulder-Krieger T, de Vries H, Wegner JK, Ijzerman AP, van Vlijmen HWT, Bender A:Identifying
novel adenosine receptor ligands by simultaneous
proteochemometric modeling of rat and human bioactivity data.
J Med Chem2012,55(16):7010–7020.
17. Netzeva TI, Worth A, Aldenberg T, Benigni R, Cronin MTD, Gramatica P, Jaworska JS, Kahn S, Klopman G, Marchant CA, Myatt G,
Nikolova-Jeliazkova N, Patlewicz GY, Perkins R, Roberts D, Schultz T, Stanton DW, van de Sandt, JJM, Tong W, Veith G, Yang C:Current status of methods for defining the applicability domain of (quantitative) structure-activity relationships. the report and recommendations of ECVAM workshop 52.ATLA, Altern Lab Anim2005,33(2):155–173. 18. Tetko IV, Bruneau P, Mewes H-W, Rohrer DC, Poda GI:Can we estimate
the accuracy of ADME-Tox predictions?Drug Discov Today2006, 11:700–707.
19. Bosnic Z, Kononenko I:An overview of advances in reliability estimation of individual predictions in machine learning.IDA2009, 13(2):385–401.
20. Sahigara F, Mansouri K, Ballabio D, Mauri A, Consonni V, Todeschini R: Comparison of different approaches to define the applicability domain of QSAR models.Molecules (Basel, Switzerland)2012, 17(5):4791–4810.
21. Rogers D, Hahn M:Extended-connectivity fingerprints.J Chem Inf Model2010,50(5):742–754.
22. Kramer C, Kalliokoski T, Gedeck P, Vulpetti A:The experimental uncertainty of heterogeneous public Ki data.J Med Chem2012, 55(11):5165–5173.
23. Kalliokoski T, Kramer C, Vulpetti A, Gedeck P:Comparability of mixed IC50 data - a statistical analysis.PloS ONE2013,8(4):61007. 24. Kramer C, Lewis R:Qsars, data and error in the modern age of drug
discovery.Curr Top Med Chem2012,12(17):1896–1902. 25. Tiikkainen P, Bellis L, Light Y, Franke L:Estimating error rates in
bioactivity databases.J Chem Inf Model2013,53(10):2499–2505. 26. Brown SP, Muchmore SW, Hajduk PJ:Healthy skepticism: assessing
realistic model performance.Drug Discov Today2009,14:420–427. 27. Golbraikh A, Tropsha A:Beware of q2!J Mol Graph Model2002,
20(4):269–276.
28. Tropsha A, Golbraikh A:Predictive quantitative structure-activity relationships modeling.Handbook Chemoinformatics Algorithms2010, 33:211.
29. Tropsha A, Gramatica P, Gombar VK:The importance of being earnest: validation is the absolute essential for successful application and interpretation of QSPR models.QSAR Comb Sci2003,22(1):69–77. 30. Burden FR:Quantitative structure-activity relationship studies using
gaussian processes.J Chem Inf Comput Sci2001,41(3):830–835. 31. Obrezanova O, Csányi G, Gola JMR, Segall MD:Gaussian processes: a
method for automatic QSAR modeling of ADME properties.J Chem Inf Model2007,47(5):1847–1857.
32. Obrezanova O, Segall MD:Gaussian processes for classification: QSAR modeling of ADMET and target activity.J Chem Inf Model2010, 50(6):1053–1061.
33. Schwaighofer A, Schroeter T, Mika S, Laub J, ter Laak A, Sülzle D, Ganzer U, Heinrich N, Müller K-R:Accurate solubility prediction with error bars for electrolytes: a machine learning approach.J Chem Inf Model2007, 47(2):407–424.
34. Zhou P, Chen X, Wu Y, Shang Z:Gaussian process: an alternative approach for qsam modeling of peptides.Amino Acids2010, 38(1):199–212.
35. Zhou P, Tian F, Chen X, Shang Z:Modeling and prediction of binding affinities between the human amphiphysin sh3 domain and its peptide ligands using genetic algorithm-gaussian processes.J Pept Sci2008,90(6):792–802.
36. Ren Y, Wu B, Pan Y, Lv F, Kong X, Luo X, Li Y, Yang Q:Characterization of the binding profile of peptide to transporter associated with antigen processing (tap) using gaussian process regression.Comput Biol Med2011,41(9):865–870.
37. Romero PA, Krause A, Arnold FH:Navigating the protein fitness landscape with gaussian processes.Proc Natl Acad Sci USA2013, 110(3):193–201.