R E S E A R C H
Open Access
Comparative study of the modulation of
fructose/sucrose-induced hepatic steatosis
by mixed lipid formulations varying in
unsaturated fatty acid content
Rafat A. Siddiqui
1*, Zhidong Xu
1, Kevin A. Harvey
1, Thomas M. Pavlina
2, Michael J. Becker
2and Gary P. Zaloga
2Abstract
Background:Non-alcoholic fatty liver disease (NAFLD) is the most common cause of chronic liver disease in developed countries. NAFLD encompasses a spectrum of diseases, ranging from hepatic steatosis to non-alcoholic steatohepatitis (NASH), cirrhosis, and liver failure. The etiology of NAFLD remains unclear but is thought to relate to increased fatty acid flux within the liver that results in toxic fatty acid metabolite production. One source of increased fatty acid flux is fructose/sucrose-induced hepatic lipogenesis. Current treatment for NAFLD encompasses dietary modifications. However, little scientific evidence exists on which to base many dietary recommendations, especially the intake of different types of carbohydrates and fats. We hypothesized that lipid mixtures of unsaturated fatty acids would inhibit lipogenesis and subsequent hepatic steatosis induced by high carbohydrate diets. The aim of this study was to examine the effects of different complex mixtures of fatty acids upon the development of fructose/sucrose-induced hepatic steatosis.
Methods:C57BL/6 mice were randomized to normocaloric chow-based diets that varied in the type of carbohydrate (starch, sucrose, fructose). Animals in each carbohydrate group were further randomized to diets that varied in lipid type (no additional lipid, soybean oil, fish oil, olive/soybean oil, macadamia nut oil). These oils were chosen based upon their content of omega-6 polyunsaturated fatty acids, omega-3 polyunsaturated fatty acids, omega-9 monounsaturated fatty acids, or omega-7 monounsaturated fatty acids. Fatty acid flux in the liver was determine by assessing hepatic lipid content (steatosis). We also assessed fatty acid levels in the plasma and liver of the animals, hepatic lipogenesis activity, hepatic stearoyl-CoA-1 desaturase activity, and hepatic elongase activity.
Results:Animals consumed similar amounts of the diets and maintained normal body weights throughout the study. Both sucrose and fructose induced hepatic lipogenesis and steatosis, with fructose being more potent. All mixed lipids similarly inhibited steatosis, limiting lipid content to levels found in the control (starch) animals. Lipogenesis and stearoyl-CoA-1 desaturase activity were increased in the sucrose and fructose groups. Levels of these enzymatic processes remained at baseline in all of the lipid groups.
Conclusion:This is the first study to compare various complex lipid mixtures, based upon dietary oils with different types of long-chain fatty acids, upon development of sucrose/fructose-induced steatosis. Both carbohydrate source and lipid content appear important for the modulation of steatosis. Moderate intake of complex lipids with high unsaturated to saturated fatty acid ratios inhibited both lipogenesis and steatosis.
Keywords:Hepatic steatosis, Non-alcoholic fatty liver disease (NAFLD), Nonalcoholic steatohepatitis (NASH), Parenteral-nutrition-associated liver disease (PNALD), Soybean oil, Olive oil, Macadamia nut oil, Fish oil, Lipid emulsion, Fatty acids, Liver, Sucrose, Fructose, Lipogenesis
* Correspondence:rasiddiq@iu.edu 1
Methodist Research Institute, Indiana University Health, 1800 N. Capitol Ave, Indianapolis, IN 46202, USA
Full list of author information is available at the end of the article
Background
Non-alcoholic fatty liver disease (NAFLD) is one of the most common forms of chronic liver disease in developed countries, affecting 20-60 % of the population [1–3]. NAFLD encompasses a spectrum of diseases that includes steatosis, nonalcoholic steatohepatitis (NASH), fibrosis, cirrhosis, liver failure, and hepatocellular carcin-oma [1, 3, 4]. Development of steatosis and progression of steatosis to NASH and cirrhosis has been postulated to involve two insults [5, 6]. The first insult results in steato-sis due to alterations in hepatic uptake, synthesteato-sis, metab-olism, and secretion of fatty acids. The accumulation of lipids within hepatocytes predisposes the liver to a second insult that results in inflammation and oxidative injury. The net result is hepatic damage that progresses to fibrosis and liver failure. However, it is now believed that a more complex process is involved [4, 7, 8], which encompasses multiple parallel pathways that result in tissue injury and progression to fibrosis. Lipotoxicity represents one of the major metabolic pathways underlying hepatocyte dysfunc-tion leading to disease progression [4, 7, 8]. It is postulated that excess free fatty acid (FFA) traffic (from diet, de novo lipogenesis, adipose lipolysis, impaired lipid oxidation) within hepatocytes that accompanies the development of steatosis leads to the generation of toxic lipid metabolites (i.e., acyl-CoA, lysophosphatidylcholine, ceramides, phos-phatidic acid), which increase oxidative stress and inflam-mation (i.e., induction of NFκB, IL-6, IL-1, TNF-alpha), resulting in hepatocyte injury that leads to cirrhosis and liver failure [7, 9]. Increased fatty acid flux and triglyceride formation results largely from an increased supply of fatty acids (i.e., from lipolysis and diet) and de novo lipogenesis [10–12]. Both processes are increased in patients with NAFLD [10–12] and play important roles in lipid accu-mulation. Inhibition of hepatic steatosis (i.e., free fatty acid flux) has been shown to prevent progression of steatosis to NASH/cirrhosis [13–15].
The pathophysiologic role of diet in the development and progression of NAFLD is unclear. High caloric in-take (overfeeding), high fat inin-take (especially saturated fatty acids), and high intake of simple sugars are all implicated in the pathogenesis of NAFLD. All of these dietary factors likely interact with genetic factors and result in hepatic lipid accumulation and cellular injury. Recent concern regarding NAFLD pathogenesis focuses upon high dietary intake of simple sugars [16–18], with fructose and sucrose being the most important sugars. Fructose/sucrose are used as sweeteners in many proc-essed foods and beverages (especially soft drinks) [17, 18]. Fructose is known to stimulate de novo lipogenesis and inflammation/oxidation within the liver [18]. Although evidence is inconclusive, there is a growing belief that high fructose consumption is an important contributor to NAFLD [10, 17, 19, 20].
In addition to fructose/sucrose consumption, high fat intake and high saturated fatty acid intake [21, 22] have been implicated in the pathogenesis of NAFLD. In con-trast to saturated fatty acids, high intake of polyunsatur-ated fatty acids reportedly inhibit NAFLD development [13, 23–25]. Polyunsaturated fatty acids also inhibit de novo lipogenesis [25–28]. In addition, fatty acids modu-late inflammation, oxidation (including lipid peroxida-tion), immune reactions, endoplasmic reticulum stress, collagen formation, apoptosis and necrosis, endothelial integrity, and insulin resistance [4, 7]. Thus, the types of fatty acids that accumulate in hepatocytes during devel-opment of steatosis (from both endogenous and exogen-ous sources) are likely to modulate the development of NAFLD and its progression to NASH/cirrhosis.
We hypothesized that fructose interacts with lipid in the pathogenesis of NAFLD and that unsaturated fatty acids (i.e. oleic acid, palmitoleic acid, linoleic acid, docosahexae-noic acid, eicosapentaedocosahexae-noic acid) inhibit the development of steatosis. The goal of this study was to examine the effects of complex mixtures of fatty acids based upon dif-ferent dietary oils (that reflects the types of lipids ingested by patients) upon the development of fructose/sucrose-induced hepatic steatosis. We compared the effects of mixtures of dietary lipids that varied in the quantities of omega-6 polyunsaturated fatty acids (soybean oil), omega-3 polyunsaturated fatty acids (fish oil), omega-9 monounsaturated fatty acids (olive oil, macadamia nut oil), and omega-7 monounsaturated fatty acids (macada-mia nut oil) upon hepatic lipid content. This is the first study to compare the effects of these different mixed lipids, varying in unsaturated fatty acid type (i.e. oleic acid, palmitoleic acid, linoleic acid, docosahexaenoic acid, eicosapentaenoic acid), upon development of fructose/ sucrose-induced hepatic steatosis.
Methods
Animals, study diets and lipid emulsions
(3 g/kg), vitamins, and minerals. In preliminary studies (not published), we established that the sucrose and fruc-tose diets induced hepatic steatosis in the animals. The study lipids were provided in the form of a lipid emulsion and fed to animals for days 3-8 of the study. In previous studies, we found that supplying the oils as an emulsion improved absorption and none of the animals developed loose stools or diarrhea.
In this study, animals were randomly divided into three groups that received starch (normal diet), sucrose, or fruc-tose as the carbohydrate source; each carbohydrate group was further randomized into five groups that received no additional lipid, or one of the four lipid emulsions for a total of 15 groups of 5 animals per group. Lipid emulsions were administered to animals daily (day 3-8) by gavage and supplied 90 mg/day of lipid to the animals. Lipid emulsion triglyceride concentrations are reported as per-cent (%) which reflects weight/volume (g/dL) of lipid. Lipid consisted of a soybean oil emulsion that was high in omega-6 polyunsaturated fatty acids (SO; 450μl/day of a 20 % or 20 g/dL emulsion; Intralipid, Fresenius Kabi, Bad Homburg, Germany), an 80 % olive oil and 20 % soybean oil emulsion that was high in omega-9 monounsaturated fatty acids (OOSO; 450μl/day of a 20 % or 20 g/dL emul-sion; ClinOleic, Baxter Healthcare, Deerfield, Illinois), a macadamia nut oil emulsion that was high in omega-7 and omega-9 monounsaturated fatty acids (MNO; 450μl/ day of a 20 % or 20 g/dL emulsion; Baxter Healthcare, Deerfield, Illinois), and a fish oil emulsion high in omega-3 polyunsaturated fatty acids (FO; 900 μl/day of a 10 % or 10 g/dL emulsion; Omegaven, Fresenius Kabi, Bad Homburg, Germany). The FO emulsion was only available as a 10 % lipid emulsion while the other three emulsions were available as 20 % emulsions. All lipid emulsions contained 1.2 g/dL of egg yolk phospholipids.
Body weight was recorded daily. Blood (for plasma) and liver tissues were collected at the end of the study and stored at −80 °C until analyzed. The protocol for these studies was approved (protocol # 2010-17) by the Method-ist Research Institute’s Animal Research Committee (Ani-mal Welfare Assurance Number-A3772-010) and strictly followed the Guide for the Care and Use of Laboratory Animals(NIH publication No.85-23, revised 1996).
Fatty acid analysis
Lipid emulsions (20 μL each) did not require fatty acid extraction prior to analysis; therefore, these samples were directly transmethylated in conjunction with an internal standard (tricosanoic acid). Methanol-benzene 4:1 and acetyl chloride were added to the samples while on dry ice. The samples were placed in tubes, purged with nitrogen gas, and subjected to methanolysis at room temperature for 24 h. The reaction was stopped and neutralized with K2CO3. Layers were separated by
centrifugation and an aliquot of the benzene layer was re-moved for gas chromatography analysis [29]. For liver analysis of fatty acids, a small sample (approximately 200 mg) was removed from an−80 °C freezer, thawed on ice, and homogenized in cold PBS. An internal standard of tricosanoic acid was added to the homogenates and methanol:benzene (4:1; v:v) added. Acetyl chloride was added while on dry ice, the samples sealed, transferred to room temperature, and maintained until the reaction mix-ture was melted. Transmethylation was performed as de-scribed above. Fatty acid extraction of the mouse plasma (100μL) prior to analysis was not required; therefore, dir-ect transmethylation of these samples were performed as described above.
For gas chromatography analysis of fatty acids, the benzene layer was recovered following centrifugation and fatty acids were separated on a gas chromatography system (Shimadzu GC2010) equipped with a Zebron ZB-WAX plus column (100 m, 0.25 mm ID, 0.25 μm film thickness) as described previously [29]. The oven temperature was programmed from 30 °C (2 min hold) to 180 °C @ 20 °C/min (2 min hold), then to 207 °C @ 4 °C/min (3 min hold), then to 220 °C @ 2 °C/min (2 min hold), and finally to 240 °C @ 2 °C/min (2 min hold). Detection was performed with a FID @ 250 °C to resolve fatty acid peaks, which were identified using authentic standards (Restek Corp., Bellefonte, PA). Data were analyzed with Shimadzu's GC solutions software. Data are presented either as mg orμg/volume or weight of tissues.
Oil Red O staining for lipid droplets
The liver tissues, which were frozen in OCT compounds, were cut into 5 μm sections using a cryostat (Leica CM1900; Leica Microsystems, Bannockburn, IL, USA). The sections were mounted on slides and allowed to dry for 1-2 h. The sections were fixed with 10 % formalin for 10 min, and then the slides were rinsed with PBS (PH 7.4). After air dry, the slides were placed in 85 % propylene glycol for 2 min, and stained in 0.5 % Oil Red O solution in propylene glycol for 30 min. The slides were transferred to an 85 % propylene glycol solution for 1 min, rinsed in distilled water for 2 changes, and processed for hematoxylin counter staining.
Triglyceride levels in hepatic tissues
Calculation of fatty acid synthesis enzyme activity
The ratio of 16:0 to 18:2n-6 was used to calculate a de novo lipogenesis (DNL) index [30, 31]. The ratio of 18:1n-9/18:0 was used to calculate hepatic stearoyl- CoA-1 (delta-9) desaturase activity [23, 32]. The ratio of 18:0/16:0 was used to calculate elongase activity [33].
Statistical analysis
The data are reported as mean ± SD unless stated other-wise. All comparisons are made by one-way ANOVA with Tukey’s post hoc test using SPSS Statistics 20 soft-ware except for individual fatty acid analyses. Fatty acids analyses were done on the normalized data (not adjusted for interdependence) using “R (version 1.15.1)” software [34]. Means differences were compared using studentized range with Tukey’s hsd (honestly significant difference). All significant values are reported atP<0.05. Values with different letters or symbols are significantly different from each other.
Results
Fatty acid composition of lipid emulsions
We selected four different lipid emulsions for study based on their content of n-3, n-6, n-7, and n-9 long-chain fatty acids (Table 1). The SO emulsion contained linoleic acid (n-6 polyunsaturated fatty acid) as the major fatty acid, accounting for nearly 56 % of total fatty acid content. The OOSO emulsion contained oleic acid (n-9 monounsaturated fatty acid) as the major fatty acid (approximately 59 % of the total fatty acid content). The MNO emulsion contained approximately 74 % monoun-saturated fatty acids, of which 21 % of total fatty acids was the n-7 monounsaturated fatty acid palmitoleic acid (C16:1n-7) and 52 % was the n-9 monounsaturated fatty acid oleic acid (C18:1n-9). This oil is one of the highest dietary sources of n-7 monounsaturated fatty acids. The MNO lipid had the lowest amount of polyunsaturated fatty acids, accounting for only 4 % of total fatty acids. The FO emulsion contained approximately 50 % of fatty acids as long-chain n-3 polyunsaturated fatty acids with approximately a 1:1 eicosapentaenoic acid (EPA) to docosahexaenoic acid (DHA) ratio. All lipid emulsions contained similar amounts of saturated fatty acids, thus accounting for approximately 15-17 % (mean values) of total fatty acids. The lipid emulsions differed in the ratio of polyunsaturated to saturated fatty acids and monoun-saturated to monoun-saturated fatty acids. However, they had similar unsaturated to saturated fatty acid ratios.
Body weights and food intake
The daily body weights of animals (mean ± SD) on the study diets (i.e., starch, sucrose, and fructose) were not significantly different from each other before (starch, 21.80 ± 0.77 g; sucrose, 21.38 ± 0.44 g; fructose, 21.62 ±
0.82 g) or after (starch, 22.26 ± 01.16 g; sucrose, 21.73 ± 0.70 g; fructose, 22.45 ± 0.92 g) lipid emulsion adminis-tration (Fig. 1). None of the animals were considered obese. We also recorded average food intake by animals in each group, and there were no significant differences in food intake (2.5-3.0 g/day) among the different dietary groups and among oil emulsion treatments. Overall, the Table 1Fatty acid composition of lipid emulsions. Values (mean ± SD) represent % of total fatty acids
n= 5 SO OOSO MNO FO
n=5 % % % %
14:0 0.04 ± 0.002 0.63 ± 0.002 4.28 ± 0.02
c16:0 11.03 ± 0.1 12.66 ± 0.03 9.03 ± 0.03 10.05 ± 0.18
16:1n-7 0.08 ± 0.001 0.98 ± 0.004 21.04 ± 0.04 7.92 ± 0.03
16:2n-4 1.20 ± 0.03
16:3n-4 1.58 ± 0.013
18:0 3.88 ± 0.03 3.56 ± 0.009 2.88 ± 0.02 2.24 ± 0.21
18:1n-9 20.72 ± 0.14 59.13 ± 0.79 53.23 ± 0.17 9.15 ± 0.13
18:1n-7 1.52 ± 0.03 2.20 ± 0.02 3.19 ± 0.13 2.43 ± 0.04
18:2n-6 55.61 ± 0.39 18.18 ± 0.02 3.25 ± 0.005 2.69 ± 0.007
18:3n-6 0.24 ± 0.006
18:3n-3 5.69 ± 0.04 2.10 ± 0.003 0.13 ± 0.002 0.96 ± 0.01
18:4n-3 4.03 ± 0.01
20:0 0.29 ± 0.002 0.34 ± 0.001 2.11 ± 0.005
20:1n-9 0.19 ± 004 0.21 ± 0.003 2.78 ± 0.05 0.85 ± 0.02
20:4n-6 0.18 ± 0.002 0.18 ± 0.001 0.19 ± 00.002 1.47 ± 0.03
20:4n-3 1.03 ± 0.004
20:5n-3 21.73 ± 0.03
22:0 0.35 ± 0.002 0.12 ± 0.001 0.70 ± 0.003
22:1n-9 0.33 ± 0.006
22:5n-6 0.467 ± 0.010
22:5n-3 2.12 ± 0.01
22:6n-3 0.14 ± 0.002 0.08 ± 0.004 0.04 ± 0.001 20.63 ± 0.20
Total 100 ± 0.73 100 ± 0.91 100 ± 0.359 100 ± 0.846
Total SFA 15.59 ± 0.13 16.68 ± 0.04 15.35 ± 0.08 17.02 ± 0.41
Total MUFA 22.51 ± 0.02 62.53 ± 0.85 80.57 ± 0.28 20.35 ± 0.21
n-7 1.60 ± 0.03 3.18 ± 0.03 24.23 ± 0.05 10.35 ± 0.07
n-9 20.19 ± 0.15 59.35 ± 0.82 56.34 ± 0.23 10.00 ± 0.15
Total PUFA 61.63 ± 0.44 20.54 ± 0.03 3.91 ± 0.01 57.12 ± 0.39
n-3 5.83 ± 0.04 2.18 ± 0.01 0.17 ± 0.003 49.47 ± 0.30
n-6 55.80 ± 0.40 18.36 ± 0.02 3.74 ± 0.01 4.87 ± 0.05
PUFA/SFA 4.0 1.2 0.25 3.4
MUFA/SFA 1.4 3.7 5.2 1.2
USAT/SFA 5.4 5.0 5.5 4.6
animals maintained their body weight during the study, and there were no significant differences among control (no additional lipid) and lipid emulsion groups for each
diet. However, there was a trend for lower body weight in the fish oil starch diet and macadamia fructose diet groups.
Effect of diets and lipid emulsions on plasma fatty acid composition in mice fed high carbohydrate diets
The sucrose diet increased saturated (16:0, 18:0) and monounsaturated fatty acids (18:1n-7, 18:1n-9) in the plasma (Table 2, Fig. 2) compared to the starch diet group (control). The fructose diet did not significantly alter plasma fatty acids compared to the starch diet group. The SO, OOSO, and MNO lipids (Table 2) had little effect upon plasma fatty acids. However, plasma n-3 polyunsat-urated fatty acids were increased by FO. Total plasma fatty acids were increased by all lipid emulsions in the starch diet group (Fig. 2), decreased in the sucrose diet group, and similar to the no added lipid control group in the fructose diet group. Plasma saturated fatty acids were decreased by all lipid emulsions in the sucrose group but not in the fructose group (Fig. 2). Monounsaturated fatty acids were decreased by all lipid emulsions in the sucrose group, but only by SO and FO in the fructose group.
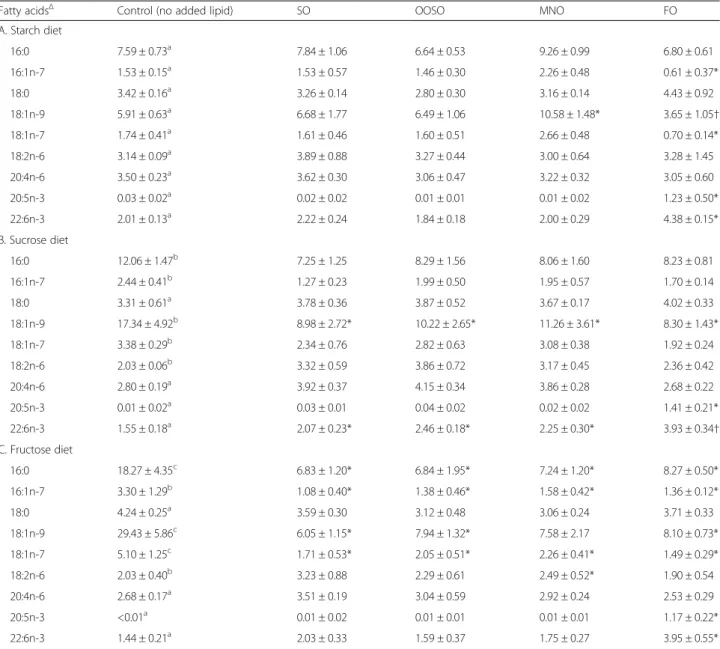
Effect of diets and lipid emulsions on hepatic fatty acid composition in mice fed high carbohydrate diets
The sucrose diet increased total hepatic fatty acids by 57 % over levels in starch control animals. The higher fat con-tent resulted from increases in saturated (16:0) and mono-unsaturated fatty acids (16:1n-7, 18:1n-7, 18:1n-9) (Table 3, Fig. 3). Fructose increased total hepatic fatty acids by 133 % by increasing both saturated (16:0) and monoun-saturated fatty acid levels (16:1n-7, 18:1n-7, 18:1n-9).
The effects of the lipid emulsions upon hepatic fatty acid content in the starch group reflected the compos-ition of the lipid emulsions (Table 3, Fig. 3). FO elevated n-3 polyunsaturated fatty acids (20:5n-3, 22:6n-3) and decreased monounsaturated fatty acids (16:1n-7, 18:1n-7, 18:1n-9). MNO increased monounsaturated fatty acids (18:1n-9).
All four lipid emulsions decreased total, saturated, and monounsaturated fatty acid concentrations in the sucrose and fructose groups by comparable amounts. Fatty acid levels were reduced to values found in the starch group (Fig. 3). In addition, FO significantly increased n-3 polyun-saturated fatty acids and SO maintained higher n-6 poly-unsaturated fatty acid levels.
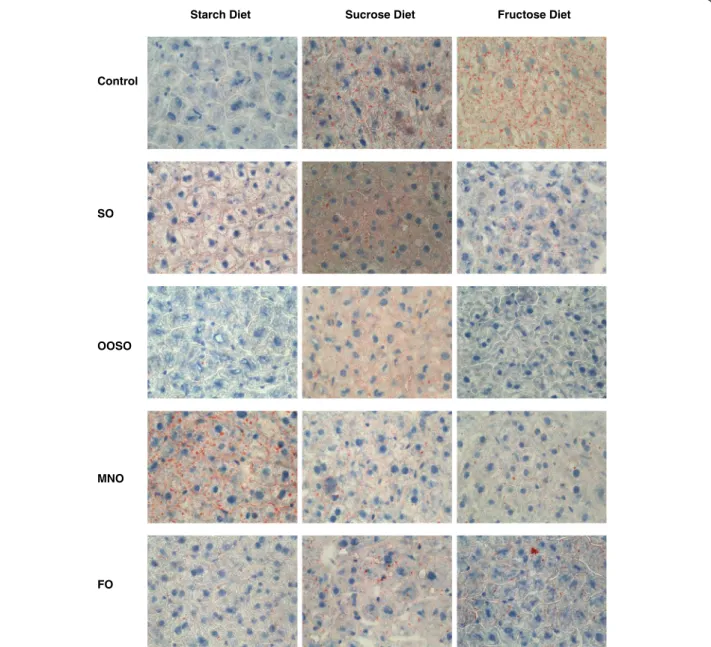
Effect of lipid emulsions on hepatic fat content in mice fed high carbohydrate diets
We further explored fat accumulation in hepatic tissues by assaying tissue samples for lipid droplet accumulation (Oil Red O staining) and total triglyceride levels. Com-pared to animals on the starch diet, there was increased accumulation of lipid droplets in animals on the sucrose
Days
0 2 4 6 8
Bo
dy
w
e
ig
h
t (%
Chan
ge)
60 80 100 120
Control SO OOSO MNO FO Starch diet
Days
0 2 4 6 8
Body
w
e
ig
ht
(%
Cha
n
ge)
60 80 100 120
Control SO OOSO MNO FO
Hi Sucrose diet
Days
0 2 4 6 8
Bo
dy
w
e
ig
h
t (%
Chan
ge)
60 80 100 120
Control SO OOSO MNO FO Hi Fructose diet
and fructose diets as evidenced by increased staining (Fig. 4). Fructose induced a greater number of droplets than sucrose. Treatment of animals receiving the starch diet with SO or MNO resulted in lipid droplet accumu-lation; the OOSO and FO diets induced minimal lipid droplet accumulation. Administration of all four lipid emulsions to mice receiving the sucrose and fructose diets reduced lipid droplet formation. We further vali-dated this data by measuring total triglyceride levels in liver samples. Consistent with lipid droplet accumula-tion, data shown in Fig. 5 indicate that the sucrose and fructose diets resulted in increased triglyceride levels in the liver compared to the starch diet group. Treatment
with lipid emulsions reduced sucrose- and fructose-induced triglyceride accumulation to levels seen in the starch diet group. The effect was independent of type of lipid emulsion used.
Effect of diet and emulsion on lipid metabolism
Hepatic de novo lipogenesis, as assessed using the 16:0/ 18:2 index, was increased significantly in both sucrose (2.5-fold) and fructose (3.5-fold) diet control groups (Fig. 6). Treatment with lipid emulsions significantly reduced the sucrose and fructose induced lipogenesis indices to values similar to those in the starch diet group. The effect was independent of the lipid emulsion composition. Feeding Table 2Plasma fatty acids (mg/ml; mean ± SD) of animals fed high carbohydrate diets
Fatty acidsΔ Control (no added lipid) SO OOSO MNO FO
A. Starch diet
16:0 0.57 ± 0.07a 0.66 ± 0.07 0.67 ± 0.14 0.77 ± 0.09 0.62 ± 0.06
16:1n-7 0.15 ± 0.02a*† 0.17 ± 0.04* 0.21 ± 0.08* 0.22 ± 0.05* 0.11 ± 0.02†
18:0 0.17 ± 0.01a 0.19 ± 0.03 0.18 ± 0.02 0.23 ± 0.04 0.25 ± 0.08
18:1n-9 0.51 ± 0.02a*† 0.62 ± 0.10*† 0.71 ± 0.18*† 0.83 ± 0.15* 0.47 ± 0.02†
18:1n-7 0.12 ± 0.02a 0.13 ± 0.03 0.15 ± 0.05 0.17 ± 0.05 0.07 ± 0.01
18:2n-6 0.35 ± 0.05a*† 0.50 ± 0.05* 0.45 ± 0.06* 0.46 ± 0.08* 0.37 ± 0.02†
20:4n-6 0.19 ± 0.05a 0.28 ± 0.02 0.24 ± 0.02 0.30 ± 0.06 0.22 ± 0.05
20:5n-3 <0.01 <0.01 <0.01 <0.01 0.24 ± 0.03*
22:6n-3 0.09 ± 0.02a 0.13 ± 0.02 0.13 ± 0.02 0.12 ± 0.07 0.33 ± 0.09*
B. Sucrose diet
16:0 0.86 ± 0.05b 0.60 ± 0.09 0.62 ± 0.06 0.63 ± 0.11 0.53 ± 0.02
16:1n-7 0.21 ± 0.04a 0.16 ± 0.01 0.21 ± 0.02 0.21 ± 0.07 0.17 ± 0.03
18:0 0.24 ± 0.02b 0.22 ± 0.03 0.19 ± 0.02 0.21 ± 0.03 0.18 ± 0.01
18:1n-9 1.21 ± 0.23b 0.73 ± 0.13*,† 0.84 ± 0.12*,† 0.90 ± 0.13* 0.61 ± 0.10†
18:1n-7 0.24 ± 0.04b 0.18 ± 0.03 0.21 ± 0.04 0.22 ± 0.01 0.13 ± 0.03
18:2n-6 0.31 ± 0.04a† 0.41 ± 0.07* 0.41 ± 0.04* 0.36 ± 0.07*† 0.22 ± 0.03§
20:4n-6 0.22 ± 0.05a 0.28 ± 0.05 0.27 ± 0.04 0.29 ± 0.06 0.16 ± 0.02*
20:5n-3 <0.01 <0.01 <0.01 <0.01 0.16 ± 0.03*
22:6n-3 0.11 ± 0.02a 0.14 ± 0.02 0.13 ± 0.02 0.14 ± 0.02 0.24 ± 0.03*
C. Fructose diet
16:0 0.54 ± 0.32a 0.71 ± 0.09 0.79 ± 0.08 0.69 ± 0.40 0.74 ± 0.15
16:1n-7 0.12 ± 0.07a 0.17 ± 0.05 0.24 ± 0.05 0.22 ± 0.13 0.17 ± 0.03
18:0 0.19 ± 0.11a,b 0.27 ± 0.02 0.23 ± 0.01 0.20 ± 0.11 0.22 ± 0.04
18:1n-9 0.80 ± 0.47a,b 0.70 ± 0.11 0.97 ± 0.13 0.80 ± 0.45 0.78 ± 0.07
18:1n-7 0.15 ± 0.09a,b 0.16 ± 0.04 0.24 ± 0.03* 0.20 ± 0.12 0.02 ± 0.02†
18:2n-6 0.20 ± 0.12a 0.50 ± 0.12 0.42 ± 0.04 0.35 ± 0.21 0.27 ± 0.06
20:4n-6 0.18 ± 0.10a 0.33 ± 0.05 0.29 ± 0.04 0.21 ± 0.12 0.22 ± 0.06
20:5n-3 <0.01 <0.01 <0.01 <0.01 0.19 ± 0.05*
22:6n-3 0.08 ± 0.05a 0.16 ± 0.03 0.14 ± 0.01 0.12 ± 0.07 0.33 ± 0.09*
ΔFatty acids with levels greater than 1 % of total fatty acids. Different alphabets (a, b) represent a statistical difference atP<0.05 between carbohydrate diets
sucrose and fructose also increased delta-9 desaturase activity (approximately 3- to 4-fold) compared to animals on the starch diet (Fig. 6). Treatment with MNO caused a small but significant increase, whereas treatment with FO caused a significant decrease in delta-9 desaturase activity in livers from the starch fed diet group. Treatment of the sucrose/fructose groups with all lipid emulsions decreased delta-9 desaturase activity to levels found in the starch diet group. Interestingly, sucrose and fructose caused a signifi-cant reduction in elongase activity compared to that of starch fed animals (Fig. 6). Treatment with FO caused a
significant increase in elongase activity in livers of starch fed animals. Treatment of the sucrose and fructose diet groups with lipid emulsion increased elongase activity to values found in the starch diet animals.
Discussion
NAFLD represents a group of diseases that result from increased fatty acid flux within the liver. The most com-mon manifestation of NAFLD is hepatic steatosis. How-ever, NAFLD may progress to NASH, cirrhosis, and liver failure. NAFLD is associated with increased morbidity, mortality, and medical costs [2, 4, 11, 12]. Treatment of NAFLD is based upon weight reduction and exercise in overweight patients and dietary modifications designed to reduce hepatic fatty acid fluxes. However, scientific evidence on which to base dietary recommendations to reduce hepatic lipid are lacking. The aim of this study was to evaluate the effects of different dietary fatty acid mixtures upon the development of hepatic steatosis.
Effect of sucrose/fructose upon development of hepatic steatosis
In this study, we evaluated the effects of different carbohy-drate sources (i.e., starch, sucrose, and fructose) upon the development of hepatic steatosis. Our findings that both sugar diets (fructose and sucrose) significantly increased hepatic lipid content (steatosis) above levels found in the starch diet (control) group, with the fructose diet being more potent than the sucrose diet, are consistent with other studies [8, 19, 20, 23].
Effect of lipid mixtures upon development of hepatic steatosis
We evaluated the effects of complex lipid mixtures (based upon different dietary oils) that varied in their content of n-3 and n-6 polyunsaturated fatty acids, n-7 and n-9 monounsaturated fatty acids, and the polyunsaturated/ saturated fatty acid ratio upon the development of su-crose/fructose induced hepatic steatosis. The main find-ing of the study is that different mixtures of unsaturated fatty acids (i.e. oleic acid, palmitoleic acid, linoleic acid, eicosapentaenoic acid, docosahexaenoic acid) similarly inhibited the development of sucrose/fructose induced hepatic steatosis. Neither the specific quantity of polyun-saturated (i.e. linoleic acid, eicosapentaenoic acid, docosa-hexaenoic acid) or monounsaturated fatty acids (i.e. oleic acid, palmitoleic acid) nor the ratio of polyunsaturated to saturated fatty acids (varying from 0.25 to 4.0) affected the inhibitory results. Steatosis was also independent of the n-6 polyunsaturated/n-3 polyunsaturated fatty acid ratio of the lipid mixtures, and emulsions containing predominantly n-3 polyunsaturated fatty acids (i.e. ei-cosapentaenoic acid, docosahexaenoic acid), n-6 poly-unsaturated fatty acids (i.e. linoleic acid), or n-7/n-9
T-SFA T-MUFA T-PUFA T-FA
plasma FA
(mg/mL)
0 1 2 3
4 Control SO OOSO
MNO
FO
T-SFA T-MUFA T-PUFA T-FA
0 1 2 3 4
T-SFA T-MUFA T-PUFA T-FA 0
1 2 3 4
a a a aa ab a bb
c
aa b b
c
a bb
b
b
Starch Diet
a bbb
c a a
a aa a
bbb c
a
bbb
c
a a a aa
ab b b b a
b a
b a
aa a
a a
Sucrose Diet
Fructose Diet
monounsaturated fatty acids (i.e. oleic acid, palmitoleic acid) were equally effective at inhibiting steatosis. However, the lipid mixtures all had similar unsaturated/ saturated fatty acid ratios (varying from 4.6 to 5.5). All of the study lipid mixtures inhibited the development of fructose/sucrose-induced hepatic steatosis, reducing levels to those found in the starch control diet group. The lipid emulsions had no effect on hepatic lipid content in the starch control group. Thus, the inhibitory effect depended upon induction of lipogenesis. It is important to note that the lipid mixtures used in this study had high unsatur-ated/saturated fatty acid ratios (an attribute of the oils used to make the lipid emulsions). In addition, saturated fatty acid content (predominantly palmitic acid and stearic
acid) was approximately 16 % across all the lipid emulsion mixtures. It is unclear if lipid mixtures with lower unsatur-ated to saturunsatur-ated fatty acid ratios or higher saturunsatur-ated fatty acid contents would have similar effects.
Mechanisms for lipid induced inhibition of hepatic steatosis
The increase in hepatic lipid content in the sucrose/fruc-tose diet groups was in the form of triglycerides and primarily reflected increases in saturated and monoun-saturated fatty acids, consistent with increased hepatic de novo lipogenesis. In addition, we found that the fruc-tose/sucrose diets increased de novo lipogenesis activity and delta-9 desaturase activity. Excess carbohydrate intakes, Table 3Hepatic fatty acids (μg/mg protein; mean ± SD) of animals fed high carbohydrate diets
Fatty acidsΔ Control (no added lipid) SO OOSO MNO FO
A. Starch diet
16:0 7.59 ± 0.73a 7.84 ± 1.06 6.64 ± 0.53 9.26 ± 0.99 6.80 ± 0.61
16:1n-7 1.53 ± 0.15a 1.53 ± 0.57 1.46 ± 0.30 2.26 ± 0.48 0.61 ± 0.37*
18:0 3.42 ± 0.16a 3.26 ± 0.14 2.80 ± 0.30 3.16 ± 0.14 4.43 ± 0.92
18:1n-9 5.91 ± 0.63a 6.68 ± 1.77 6.49 ± 1.06 10.58 ± 1.48* 3.65 ± 1.05†
18:1n-7 1.74 ± 0.41a 1.61 ± 0.46 1.60 ± 0.51 2.66 ± 0.48 0.70 ± 0.14*
18:2n-6 3.14 ± 0.09a 3.89 ± 0.88 3.27 ± 0.44 3.00 ± 0.64 3.28 ± 1.45
20:4n-6 3.50 ± 0.23a 3.62 ± 0.30 3.06 ± 0.47 3.22 ± 0.32 3.05 ± 0.60
20:5n-3 0.03 ± 0.02a 0.02 ± 0.02 0.01 ± 0.01 0.01 ± 0.02 1.23 ± 0.50*
22:6n-3 2.01 ± 0.13a 2.22 ± 0.24 1.84 ± 0.18 2.00 ± 0.29 4.38 ± 0.15*
B. Sucrose diet
16:0 12.06 ± 1.47b 7.25 ± 1.25 8.29 ± 1.56 8.06 ± 1.60 8.23 ± 0.81
16:1n-7 2.44 ± 0.41b 1.27 ± 0.23 1.99 ± 0.50 1.95 ± 0.57 1.70 ± 0.14
18:0 3.31 ± 0.61a 3.78 ± 0.36 3.87 ± 0.52 3.67 ± 0.17 4.02 ± 0.33
18:1n-9 17.34 ± 4.92b 8.98 ± 2.72* 10.22 ± 2.65* 11.26 ± 3.61* 8.30 ± 1.43*
18:1n-7 3.38 ± 0.29b 2.34 ± 0.76 2.82 ± 0.63 3.08 ± 0.38 1.92 ± 0.24
18:2n-6 2.03 ± 0.06b 3.32 ± 0.59 3.86 ± 0.72 3.17 ± 0.45 2.36 ± 0.42
20:4n-6 2.80 ± 0.19a 3.92 ± 0.37 4.15 ± 0.34 3.86 ± 0.28 2.68 ± 0.22
20:5n-3 0.01 ± 0.02a 0.03 ± 0.01 0.04 ± 0.02 0.02 ± 0.02 1.41 ± 0.21*
22:6n-3 1.55 ± 0.18a 2.07 ± 0.23* 2.46 ± 0.18* 2.25 ± 0.30* 3.93 ± 0.34†
C. Fructose diet
16:0 18.27 ± 4.35c 6.83 ± 1.20* 6.84 ± 1.95* 7.24 ± 1.20* 8.27 ± 0.50*
16:1n-7 3.30 ± 1.29b 1.08 ± 0.40* 1.38 ± 0.46* 1.58 ± 0.42* 1.36 ± 0.12*
18:0 4.24 ± 0.25a 3.59 ± 0.30 3.12 ± 0.48 3.06 ± 0.24 3.71 ± 0.33
18:1n-9 29.43 ± 5.86c 6.05 ± 1.15* 7.94 ± 1.32* 7.58 ± 2.17 8.10 ± 0.73*
18:1n-7 5.10 ± 1.25c 1.71 ± 0.53* 2.05 ± 0.51* 2.26 ± 0.41* 1.49 ± 0.29*
18:2n-6 2.03 ± 0.40b 3.23 ± 0.88 2.29 ± 0.61 2.49 ± 0.52* 1.90 ± 0.54
20:4n-6 2.68 ± 0.17a 3.51 ± 0.19 3.04 ± 0.59 2.92 ± 0.24 2.53 ± 0.29
20:5n-3 <0.01a 0.01 ± 0.02 0.01 ± 0.01 0.01 ± 0.01 1.17 ± 0.22*
22:6n-3 1.44 ± 0.21a 2.03 ± 0.33 1.59 ± 0.37 1.75 ± 0.27 3.95 ± 0.55*
ΔFatty acids with levels greater than 1 % of total fatty acids. Different alphabets represent a statistical difference atP<0.05 between diets (no added lipids)
particularly in the form of sucrose or fructose, are known to stimulate de novo lipogenesis [8, 10, 17]. The increase in lipogenesis found in this study is comparable to the in-creased lipogenesis found in patients with NAFLD [10–12]. Thus, our study results suggest that the primary mechan-ism for the lipid inhibitory effects upon steatosis relates to inhibition of lipogenesis induced by the sugars. Total poly-unsaturated fatty acid content of the liver was not altered by the sucrose/fructose diets. Polyunsaturated fatty acids reflect dietary intake (essential fatty acids) and adipose tis-sue lipolysis (from stored dietary polyunsaturated fatty acids), rather than de novo lipogenesis. The lack of effect of
the lipid emulsions upon liver lipid content in the starch control group likely reflects the low level of hepatic lipid and low lipogenesis activity in this group.
The stimulation of lipogenesis by high carbohydrate intakes results from activation of transcription factors (i.e. steroid responsive element binding protein 1c; SREBP1c) and increased expression of lipogenic enzymes (i.e. fatty acid synthase [FAS], stearoyl-CoA desaturase, acetyl-CoA carboxylase [ACC], malic enzyme) [8, 10, 17]. In contrast to carbohydrate, many fatty acids (i.e. n-3 and n-6 polyun-saturated fatty acids) suppress lipogenesis by inhibiting SREBP1c and transcription of genes involved in lipogen-esis [23, 25–28]. Additionally, some fatty acids (i.e. n-3 polyunsaturated fatty acids) have been found to upregulate expression of peroxisomal proliferator-activated receptor alpha (PPARα) which increases fatty acid degradation [13, 25]. Thus, fatty acids can increase fatty acid degrad-ation and decrease fatty acid synthesis. The net result would be decreased storage of lipids in tissues (i.e. less hepatic steatosis).
Many studies have shown that both n-6 and n-3 polyun-saturated fatty acids suppress lipogenesis and development of hepatic steatosis [13, 23, 25–28, 35–37]. However, most studies using dietary oils failed to directly compare n-6 with n-3 polyunsaturated fatty acids. Thus, it is difficult to compare the potency of oils containing different quantities of these polyunsaturated fatty acid mixtures. In contrast, saturated fatty acids have been reported to have little in-hibitory effects upon lipogenesis [13, 26–28, 36] and high fat diets enriched with saturated fatty acids [23, 25, 38, 39] have been reported to increase lipogenesis and hepatic steatosis.
A limited number of studies have evaluated the effects of monounsaturated fatty acids or oils containing high monounsaturated fatty acids upon hepatic lipid metabol-ism such as lipogenesis and hepatic steatosis. The effects of olive oil upon hepatic steatosis have been variable with reports of increased, decreased, or no effect upon steatosis [40, 41]. The variability appears to depend upon the model used, amount and type of olive oil, quality and compos-ition of the olive oil, control group used for comparison, and the fat/calorie content of the diets. Potential mecha-nisms for decreased steatosis with olive oil include de-creased hepatic expression of lipogenic genes through inhibition of SREBP1c, increased hepatic fatty acid oxida-tion through stimulaoxida-tion of PPARα, increased secretion of very low density lipoproteins, anti-inflammatory effects, and anti-oxidant actions [40, 41]. Our results using olive oil are comparable to previous studies using different animal models [40–43]. For example, Wani et al. [42] induced hepatic steatosis in mice using a high fat diet (42 % of energy as fat; over 16 weeks). Administration of olive oil with the high fat diet decreased weight gain, serum triglycerides, normalized liver enzyme levels, and
T-SFA T-MUFA T-PUFA T-FA
hepatic FA
(
μ
g/mg protein)
0 20 40 60 80
Control SO OOSO
MNO
FO
T-SFA T-MUFA T-PUFA T-FA
0 20 40 60 80
T-SFA T-MUFA T-PUFA T-FA 0
20 40 60 80
a aa aa aa a b
c a aa aa
a a a a a
Starch Diet
b b bb
a bbbb
a
b b bb a
b b
b b a
b b bb a
b b bb a
b b bb a
Sucrose Diet
Fructose Diet
a aa aa a a
decreased hepatic steatosis. Deng et al. [43] utilized JCR:LA-cp rats (lack leptin receptors) to study hepatic steatosis. Over 2 weeks, animals receiving 10 % of energy as fat developed hepatic steatosis with induction of lipo-genic enzymes. Rats fed diets enriched with olive oil (40 % of energy) or menhaden oil (40 % of energy) demonstrated reduced expression of SREBP-1c, reduced hepatic trigly-ceride content, decreased lipogenesis (i.e. FAS, ACC), and increased expression of enzymes mediating fatty acid oxi-dation. In addition to the above studies with olive oil, oleic acid and oleic acid rich diets have been shown to decrease hepatic lipogenesis, expression of hepatic lipogenic genes (SREBP1c, SREBP2, FAS, ACC), and expression of hepatic
pro-inflammatory genes (tumor necrosis factor alpha, cyclooxygenase-2) [26, 44]. The olive oil-based lipid emul-sion used in this study contains refined olive oil and does not contain many of the phenolic compounds (i.e. phen-olic alcohols, phenphen-olic acids, flavonoids, lignans, secoir-idoids) found in natural olive oil such as oleuropein, tyrosol, or hydroxytyrosol. These phenolic compounds have been shown to reduce hepatic steatosis [40, 45].
Saturated but not unsaturated fatty acids may induce lipotoxicity [46–48], which could contribute to hepatic damage during NAFLD. The effects of saturated fatty acids may depend upon the presence of unsaturated fatty acids. Monounsaturated fatty acids, added to saturated
Starch Diet Sucrose Diet Fructose Diet
Control
SO
OOSO
MNO
FO
fatty acids, have been reported to attenuate cellular apop-tosis and insulin resistance induced by saturated fatty acids [21, 46, 48]. Toll-like receptors recognize saturated fatty acids and may mediate many of their detrimental effects upon tissues [4, 8]. These effects are inhibited by unsaturated fatty acids. Thus, mixtures of different classes of fatty acids may produce effects that differ from those of the individual fatty acids and unsaturated fatty acids may attenuate or block effects of saturated fatty acids.
Based upon the known effects of carbohydrates and fatty acids upon lipogenesis/hepatic steatosis and the results of this study, we hypothesize that lipid mixtures with high unsaturated to saturated fatty acid ratios inhibited de novo lipogenesis induced by sucrose/fructose. By suppressing lipogenesis, the lipid mixtures inhibited development of hepatic steatosis.
Other considerations
Different fatty acids, despite being structurally similar and belonging to the same chemical class, may elicit different biological effects [49]. Thus, generalizing fatty acid effects by the degree of unsaturation, configuration of the double bonds (i.e. cis or trans), length of the carbon chain, or position of the double bonds (3, 6, omega-7, omega-9) may not predict physiological responses. Poudyal et al. [49] has proposed classifying fatty acids based upon biological activity (i.e. neutral, reduce risk factors, increase risk factors, controversial evidence for classification, inadequate research to allow classification). Although such a system may be beneficial, biological ef-fects vary with the model used, organ investigated, param-eter measured, underlying illness or inflammatory state,
diet utilized, concomitant fatty acids, and many other vari-ables. In addition, lipids used in studies may be complex and contain variable amounts of different fatty acids. It is difficult to classify fatty acids and complex fatty acid mix-tures with a large number a different physiologic effects using a single classification system. Despite lack of a biological classification system, it is important not to generalize the effects from one fatty acid to a class of fatty acids. In this study, the predominant saturated fatty acids of the lipid emulsions were palmitic acid and stearic acid. The predominant unsaturated fatty acids varied with the emulsion (Table 1). Soybean oil contained predomin-antly linoleic acid (with lesser amounts of oleic acid), the olive/soybean oil contained predominantly oleic acid (with lesser amounts of linoleic acid), the macadamia nut oil contained predominantly oleic acid (with lesser amounts of palmitoleic acid), and the fish oil contained predomin-antly eicosapentaenoic and docosahexaenoic acids. Oils which vary significantly from the study lipids may not produce similar effects.
Most studies of lipogenesis/steatosis utilized a single carbohydrate diet based upon glucose or glucose/sucrose. Few studies have utilized fructose, a common sweetener implicated in the pathogenesis of NAFLD. We utilized three carbohydrate diets (i.e. starch, sucrose, and fructose) so that we could evaluate the interaction between carbo-hydrate and lipid. It is important to use a starch based diet as a control diet in order to determine the effects of lipids upon normal carbohydrate intake. Most studies have eval-uated a limited number of lipid formulations containing high omega-3 or omega-6 polyunsaturated fatty acids or evaluated single fatty acids or triglycerides containing one
mg/g tissue
0.0 0.2 0.4 0.6 0.8 1.0 1.2
Control SO OOSO MNO FO
a
a a
a
a
b
a
a b
aa a
a a
a
Starch Diet Sucrose Diet Fructose Diet
fatty acid. It is important to use dietary oils since these represent the normal intake of lipids in the diet. There is limited information related to monounsaturated fatty acids and a lack of studies evaluating the effects of oils containing high monounsaturated fatty acids. Many stud-ies utilized very high saturated fatty acid diets, high fat diets, or high calorie diets that are not representative of normal intakes or utilized genetic or nutrient deficient animal models of steatosis. Due to these concerns, we
used a normal mouse model, 3 different carbohydrate diets (starch, sucrose, fructose), 4 different lipid formula-tions derived from dietary oils, a eucaloric normal rodent diet, and normal total and saturated fat intake. The duration of this study is shorter than many published studies of NAFLD. Importantly, the short duration of the study was adequate for inducing hepatic steatosis and was effective at demonstrating the steatosis inhibiting effects of the various lipid mixtures. Thus, we believe that the animal model utilized in this study represents a valid model for studying NAFLD. Further studies are needed to assess the efficacy of specified diets for prevention and treatment of NAFLD. These studies should evaluate interactions between dietary components such as carbohy-drates and fats. Future studies should evaluate lipid mixtures with different unsaturated/saturated fatty acid ratios, different levels of lipid and calorie intakes, and potential molecular mechanisms for the effects (i.e. ex-pression of fatty acid synthesis and degradative enzymes and transcription factors, proinflammatory mediators, antioxidant systems).
Conclusion
In conclusion, this study indicates that both carbohydrate source and lipid intake are important dietary components modulating the development of hepatic steatosis. Simple sugars (fructose > sucrose) are more potent for induction of steatosis than complex carbohydrates. Moderate intake of complex lipids with high unsaturated to saturated fatty acid ratios can inhibit the development of high sucrose/ fructose-induced hepatic steatosis. We found no differ-ence in the inhibitory effects of complex lipid formula-tions based upon polyunsaturated fatty acid (n-3 or n-6) or monounsaturated fatty acid (n-7 or n-9) content. Our results suggest that the total unsaturated fatty acid content is more important than the polyunsaturated fatty acid content of formulations for inhibition of steatosis.
Competing interests
Dr. Zaloga and Mr. Pavlina are/were employees of Baxter Healthcare. None of the other authors declare any conflict of interest.
Authors’contributions
RAS, TMP and GPZ designed the study. KAH and ZX performed animal feeding, tissues sampling, and analysis of samples. MJB manufactured macadamia nut oil emulsion (MNO). RAS analyzed the data. RAS, TMP, and GZ interpreted the results and prepared the manuscript. All authors have read and approved the final version of this manuscript
Acknowledgments
The authors wish to thank Elaine Bammerlin for providing the editorial assistance and Dr. Cary Mariash for the statistical analysis of data. This study was supported by a grant from Baxter Healthcare Corporation, Deerfield, IL 60015, USA.
Author details
1Methodist Research Institute, Indiana University Health, 1800 N. Capitol Ave, Indianapolis, IN 46202, USA.2Baxter Healthcare Corporation, Deerfield, IL 60015, USA.
Starch Sucrose Fructose 0 2 4 6 8 10 12 Control SO OOSO MNO FO De nov o lipo gen esis (16:0/18:2 Ratio)
Starch Sucrose Fructose 0.0 0.2 0.4 0.6 0.8 Elong a se Activ ity (18:0/16:0 Ratio )
Starch Sucrose Fructose 0 2 4 6 8 10 Δ 9d e s ta u ra s ea c ti v it y (18:1/18:0 Ratio) a aa a a b a a a a b a a a a a a a c d d aa a a a a a a a a a c b aa a a d aa a a b b d
Received: 1 July 2015 Accepted: 8 November 2015
References
1. Chalasani N, Younossi Z, Lavine JE, Diehl AM, Brunt EM, Cusi K, et al. The diagnosis and management of non-alcoholic fatty liver disease: practice guideline by the American Gastroenterological Association, American Association for the Study of Liver Diseases, and American College of Gastroenterology. Gastroenterology. 2012;142:1592–609.
2. Younossi ZM. Review article: current management of non-alcoholic fatty liver disease and non-alcoholic steatohepatitis. Aliment Pharmacol Ther. 2008;28:2–12.
3. Angulo P. GI epidemiology: nonalcoholic fatty liver disease. Aliment Pharmacol Ther. 2007;25:883–9.
4. Peverill W, Powell LW, Skoien R. Evolving concepts in the pathogenesis of NASH: beyond steatosis and inflammation. Int J Mol Sci. 2014;15:8591–638. 5. Day CP. Pathogenesis of steatohepatitis. Best Pract Res Clin Gastroenterol.
2002;16:663–78.
6. Day CP, James OF. Steatohepatitis: a tale of two "hits"? Gastroenterology. 1998;114:842–5.
7. Berlanga A, Guiu-Jurado E, Porras JA, Auguet T. Molecular pathways in non-alcoholic fatty liver disease. Clin Exp Gastroenterol. 2014;7:221–39. 8. Neuschwander-Tetri BA. Hepatic lipotoxicity and the pathogenesis of
nonalcoholic steatohepatitis: the central role of nontriglyceride fatty acid metabolites. Hepatology. 2010;52:774–88.
9. Han MS, Park SY, Shinzawa K, Kim S, Chung KW, Lee JH, et al. Lysophosphatidylcholine as a death effector in the lipoapoptosis of hepatocytes. J Lipid Res. 2008;49:84–97.
10. Neuschwander-Tetri BA. Carbohydrate intake and nonalcoholic fatty liver disease. Curr Opin Clin Nutr Metab Care. 2013;16:446–52.
11. Diraison F, Moulin P, Beylot M. Contribution of hepatic de novo lipogenesis and reesterification of plasma non esterified fatty acids to plasma triglyceride synthesis during non-alcoholic fatty liver disease. Diabetes Metab. 2003;29:478–85.
12. Donnelly KL, Smith CI, Schwarzenberg SJ, Jessurun J, Boldt MD, Parks EJ. Sources of fatty acids stored in liver and secreted via lipoproteins in patients with nonalcoholic fatty liver disease. J Clin Invest. 2005;115:1343–51. 13. Konuma K, Itoh M, Suganami T, Kanai S, Nakagawa N, Sakai T, et al.
Eicosapentaenoic acid ameliorates non-alcoholic steatohepatitis in a novel mouse model using melanocortin 4 receptor-deficient mice. PLoS One. 2015;10, e0121528.
14. Dentin R, Benhamed F, Hainault I, Fauveau V, Foufelle F, Dyck JR, et al. Liver-specific inhibition of ChREBP improves hepatic steatosis and insulin resistance in ob/ob mice. Diabetes. 2006;55:2159–70.
15. Beraza N, Malato Y, Vander Borght S, Liedtke C, Wasmuth HE, Dreano M, et al. Pharmacological IKK2 inhibition blocks liver steatosis and initiation of non-alcoholic steatohepatitis. Gut. 2008;57:655–63.
16. Basaranoglu M, Basaranoglu G, Sabuncu T, Senturk H. Fructose as a key player in the development of fatty liver disease. World J Gastroenterol. 2013;19:1166–72.
17. Vos MB, Lavine JE. Dietary fructose in nonalcoholic fatty liver disease. Hepatology. 2013;57:2525–31.
18. Tappy L, Le KA. Does fructose consumption contribute to non-alcoholic fatty liver disease? Clin Res Hepatol Gastroenterol. 2012;36:554–60. 19. Roncal-Jimenez CA, Lanaspa MA, Rivard CJ, Nakagawa T, Sanchez-Lozada
LG, Jalal D, et al. Sucrose induces fatty liver and pancreatic inflammation in male breeder rats independent of excess energy intake. Metabolism. 2011;60:1259–70.
20. Pickens MK, Ogata H, Soon RK, Grenert JP, Maher JJ. Dietary fructose exacerbates hepatocellular injury when incorporated into a methionine-choline-deficient diet. Liver Int. 2010;30:1229–39.
21. Wang D, Wei Y, Pagliassotti MJ. Saturated fatty acids promote endoplasmic reticulum stress and liver injury in rats with hepatic steatosis. Endocrinology. 2006;147:943–51.
22. Leamy AK, Egnatchik RA, Young JD. Molecular mechanisms and the role of saturated fatty acids in the progression of non-alcoholic fatty liver disease. Prog Lipid Res. 2013;52:165–74.
23. Kajikawa S, Harada T, Kawashima A, Imada K, Mizuguchi K. Highly purified eicosapentaenoic acid prevents the progression of hepatic steatosis by repressing monounsaturated fatty acid synthesis in high-fat/high-sucrose diet-fed mice. Prostaglandins Leukot Essent Fatty Acids. 2009;80:229–38.
24. Gonzalez-Periz A, Horrillo R, Ferre N, Gronert K, Dong B, Moran-Salvador E, et al. Obesity-induced insulin resistance and hepatic steatosis are alleviated by omega-3 fatty acids: a role for resolvins and protectins. FASEB J. 2009;23: 1946–57.
25. Levy JR, Clore JN, Stevens W. Dietary n-3 polyunsaturated fatty acids decrease hepatic triglycerides in Fischer 344 rats. Hepatology. 2004;39:608–16.
26. Clarke SD, Romsos DR, Leveille GA. Differential effects of dietary methyl esters of long-chain saturated and polyunsaturated fatty acids on rat liver and adipose tissue lipogenesis. J Nutr. 1977;107:1170–81.
27. Toussant MJ, Wilson MD, Clarke SD. Coordinate suppression of liver acetyl-CoA carboxylase and fatty acid synthetase by polyunsaturated fat. J Nutr. 1981;111:146–53.
28. Clarke SD, Armstrong MK, Jump DB. Dietary polyunsaturated fats uniquely suppress rat liver fatty acid synthase and S14 mRNA content. J Nutr. 1990;120:225–31.
29. Xu Z, Harvey K, Pavlina T, Dutot G, Zaloga G, Siddiqui R. An improved method for determining medium- and long-chain FAMEs using gas chromatography. Lipids. 2010;45:199–208.
30. Hudgins LC, Hellerstein M, Seidman C, Neese R, Diakun J, Hirsch J. Human fatty acid synthesis is stimulated by a eucaloric low fat, high carbohydrate diet. J Clin Invest. 1996;97:2081–91.
31. Chong MF, Hodson L, Bickerton AS, Roberts R, Neville M, Karpe F, et al. Parallel activation of de novo lipogenesis and stearoyl-CoA desaturase activity after 3 d of high-carbohydrate feeding. Am J Clin Nutr. 2008;87:817–23. 32. Riserus U, Tan GD, Fielding BA, Neville MJ, Currie J, Savage DB, et al.
Rosiglitazone increases indexes of stearoyl-CoA desaturase activity in humans: link to insulin sensitization and the role of dominant-negative mutation in peroxisome proliferator-activated receptor-gamma. Diabetes. 2005;54:1379–84.
33. Mai K, Andres J, Bobbert T, Assmann A, Biedasek K, Diederich S, et al. Rosiglitazone increases fatty acid Delta9-desaturation and decreases elongase activity index in human skeletal muscle in vivo. Metabolism. 2012;61:108–16.
34. Team RDC. R: A language and environment for statistical computing. Vienna, Austria; 2008.
35. Foufelle F, Perdereau D, Gouhot B, Ferre P, Girard J. Effect of diets rich in medium-chain and long-chain triglycerides on lipogenic-enzyme gene expression in liver and adipose tissue of the weaned rat. Eur J Biochem. 1992;208:381–7.
36. Wilson MD, Blake WL, Salati LM, Clarke SD. Potency of polyunsaturated and saturated fats as short-term inhibitors of hepatic lipogenesis in rats. J Nutr. 1990;120:544–52.
37. Alwayn IP, Gura K, Nose V, Zausche B, Javid P, Garza J, et al. Omega-3 fatty acid supplementation prevents hepatic steatosis in a murine model of nonalcoholic fatty liver disease. Pediatr Res. 2005;57:445–52. 38. Ito M, Suzuki J, Tsujioka S, Sasaki M, Gomori A, Shirakura T, et al.
Longitudinal analysis of murine steatohepatitis model induced by chronic exposure to high-fat diet. Hepatol Res. 2007;37:50–7.
39. de Meijer VE, Le HD, Meisel JA, Akhavan Sharif MR, Pan A, Nose V, et al. Dietary fat intake promotes the development of hepatic steatosis independently from excess caloric consumption in a murine model. Metabolism. 2010;59:1092–105.
40. Priore P, Cavallo A, Gnoni A, Damiano F, Gnoni GV, Siculella L. Modulation of hepatic lipid metabolism by olive oil and its phenols in nonalcoholic fatty liver disease. IUBMB Life. 2015;67:9–17.
41. Assy N, Nassar F, Nasser G, Grosovski M. Olive oil consumption and non-alcoholic fatty liver disease. World J Gastroenterol. 2009;15:1809–15. 42. Wani FA, Albahrawy AZ, Rahiman S. Hypolipidemic activity of olive oil
(olea europaea) against high fat diet-induced nonalcoholic fatty liver disease (NAFLD) in mice. Open J Path. 2015;5:73–83.
43. Deng X, Elam MB, Wilcox HG, Cagen LM, Park EA, Raghow R, et al. Dietary olive oil and menhaden oil mitigate induction of lipogenesis in hyperinsulinemic corpulent JCR:LA-cp rats: microarray analysis of lipid-related gene expression. Endocrinology. 2004;145:5847–61. 44. Sato K, Arai H, Mizuno A, Fukaya M, Sato T, Koganei M, et al. Dietary
palatinose and oleic acid ameliorate disorders of glucose and lipid metabolism in Zucker fatty rats. J Nutr. 2007;137:1908–15.
46. Ricchi M, Odoardi MR, Carulli L, Anzivino C, Ballestri S, Pinetti A, et al. Differential effect of oleic and palmitic acid on lipid accumulation and apoptosis in cultured hepatocytes. J Gastroenterol Hepatol. 2009;24:830–40. 47. Nolan CJ, Larter CZ. Lipotoxicity: why do saturated fatty acids cause and
monounsaturates protect against it? J Gastroenterol Hepatol. 2009;24:703–6. 48. Harvey KA, Walker CL, Xu Z, Whitley P, Pavlina TM, Hise M, et al. Oleic acid
inhibits stearic acid-induced inhibition of cell growth and pro-inflammatory responses in human aortic endothelial cells. J Lipid Res. 2010;51:3470–80. 49. Poudyal H, Brown L. Should the pharmacological actions of dietary fatty
acids in cardiometabolic disorders be classified based on biological or chemical function? Prog Lip Res. 2015;59:172–200.
Submit your next manuscript to BioMed Central and take full advantage of:
• Convenient online submission
• Thorough peer review
• No space constraints or color figure charges
• Immediate publication on acceptance
• Inclusion in PubMed, CAS, Scopus and Google Scholar
• Research which is freely available for redistribution