R E S E A R C H
Open Access
Predicting resting energy expenditure in
underweight, normal weight, overweight,
and obese adult hospital patients
Hinke M. Kruizenga
1*, Geesje H. Hofsteenge
1and Peter J.M. Weijs
1,2Abstract
Background:When indirect calorimetry is not available, predictive equations are used to estimate resing energy expenditure (REE). There is no consensus about which equation to use in hospitalized patients. The objective of this study is to examine the validity of REE predictive equations for underweight, normal weight, overweight, and obese inpatients and outpatients by comparison with indirect calorimetry.
Methods:Equations were included when based on weight, height, age, and/or gender. REE was measured
with indirect calorimetry. A prediction between 90 and 110% of the measured REE was considered accurate. The bias and root-mean-square error (RMSE) were used to evaluate how well the equations fitted the REE measurement. Subgroup analysis was performed for BMI. A new equation was developed based on regression analysis and tested.
Results: 513 general hospital patients were included, (253 F, 260 M), 237 inpatients and 276 outpatients.
Fifteen predictive equations were used. The most used fixed factors (25 kcal/kg/day, 30 kcal/kg/day and 2000 kcal for female and 2500 kcal for male) were added. The percentage of accurate predicted REE was low in all equations, ranging from 8 to 49%. Overall the new equation performed equal to the best performing Korth equation and slightly better than the well-known WHO equation based on weight and height (49% vs 45% accurate). Categorized by BMI subgroups, the new equation, Korth and the WHO equation based on weight and height performed best in all categories except from the obese subgroup. The original Harris and Benedict (HB) equation was best for obese patients.
Conclusions: REE predictive equations are only accurate in about half the patients. The WHO equation is
advised up to BMI 30, and HB equation is advised for obese (over BMI 30). Measuring REE with indirect calorimetry is preferred, and should be used when available and feasible in order to optimize nutritional support in hospital inpatients and outpatients with different degrees of malnutrition.
Keywords: Resting energy expenditure, Equation, BMI, Prediction, Validity, Underweight, Normal weight,
Overweight, Obese, Indirect calorimetry
* Correspondence:h.kruizenga@vumc.nl
1Department of Nutrition and Dietetics, Internal Medicine, VU University
Medical Center, P.O. Box 7057, Amsterdam 1007 MB, The Netherlands Full list of author information is available at the end of the article
Background
In clinical practice, an adequate measurement of rest-ing energy expenditure (REE) for adult patients is im-portant for optimal nutritional therapy in order to prevent under- and over nutrition [1]. REE in adult patients can be measured by indirect calorimetry, based on oxygen consumption and carbon dioxide production [2]. Indirect calorimetry is considered as the most accurate method [3] for determining the REE in adult patients [4, 5]; however, this measure-ment is time-consuming and not available in most clinical settings. As an alternative, REE is usually cal-culated with various REE predictive equations, based on healthy subjects [1, 6].
Only few studies have validated REE predictive
equations in hospitalized patients [7–9]. The
num-ber of validated predictive equations is small [7, 8] and studies have small sample sizes [7, 9]. There-fore, there is no consensus about which equation to use in hospitalized patients. According to Boullata et al. [8], the Harris & Benedict (1918) (HB1918) [10] equation is the best equation to predict REE, when using an illness factor of 1.1. It appeared 62% of the patients were predicted accurately using this equation. Anderegg et al. [7] suggests HB1918 with adjusted bodyweight and a stress factor, which led to 50% accurately predicted patients. Weijs et al. [9] suggest the WHO and adjusted Harris & Benedict (HB1984) [11] equations, predicting about 50% of the patients accurately. More recently, Jesus et al. [12] showed that the original Harris & Benedict equation (HB1918) performed reasonably, but no equation was adequate for extreme BMI groups (<16 and >40).
Therefore, it is unclear which REE predictive equation performs most uniform across BMI sub-groups for hospital patients. The aim of this study is to examine the validity of REE predictive equa-tions for underweight, normal weight, overweight, and obese patients by comparison with indirect calorimetry.
Methods Patients
Between March 2005 and December 2015, data were collected at the VU University Medical Center Amsterdam. Patients who had an indication for nu-tritional assessment by the dietitian were included in this study. All measurements were performed according to a standardized operating procedure (SOP), and personal was trained in a standardized manner. Patients were measured as part of patient
care. As malnutrition is the main reason for
measurement, withholding food for longer than
absolutely necessary is questionable and maybe un-ethical. All patients were restricted from food for at least 2 h before the measurement. None of the patients were restricted from food for 8 h, as the guideline [13] indicates.
Only adult patients with complete data (height, weight, age, and gender) were included. When re-peated REE measurements were available, only the first measurement was included. Exclusion criteria were patients at ICU, pregnant women, and REE measurements shorter than 15 min. All procedures were in accordance with ethical standards of the institution.
Indirect calorimetry and anthropometric measurements Indirect calorimetry measurements were performed by using a metabolic monitor (Deltatrac 2 MBM-200, Datex-Ohmeda, Helsinki, Finland; Vmax Encore n29, Viasys Healthcare, Houten, The Netherlands). Both devices were calibrated every day before use and Vmax also every 5 min during measurement. The Deltatrac was calibrated with one reference gas mix-ture (95% O2, 5% CO2), whereas Vmax was calibrated
with two standard gases (26% O2, 0% CO2, and 16%
O2, 4% CO2). Patients were measured in supine
pos-ition. Calibration and measurements were performed by a trained dietitian. Oxygen analyser sensitivity was checked yearly by supplier.
Body weight was measured using a calibrated elec-tronic stand-up scale (Seca Alpha, Hamburg, Germany). In case of severe oedema or when weighing was not pos-sible, even weighing in bed, self-reported weight was used. Height of the patient was measured or self-reported. BMI was calculated as weight (kg) divided by the square of height (m2).
REE predictive equations
Predictive equations were obtained by a systematic
search using PubMed. Mesh-derived keys ‘energy
me-tabolism’, ‘basal metabolism’ and ‘indirect calorimetry’ and additional terms (‘predict*’, ‘estimat*’, ‘equation*’ and ‘formula*’) were applied in every possible com-bination. Applied limitations were ‘English language’,
‘humans’ and the age of 18 years and older.
Add-itional publications were checked based on reference lists. Equations were included when based on body weight, height, age, and/or gender.
The Weijs equation for overweight patients [14] was tested in patients with BMI > 25. For the BMI < 25 subgroup, a new REE predictive equation was
developed in this subpopulation with BMI < 25
using regression analysis with measured REE (kcal/ day) as dependent and body weight (kg), height
(m), age (y), and sex (F = 0, M = 1) as independent variables.
Statistical analysis
An independent samples T-test was used for
differ-ences in weight, BMI, age, and REE between inpa-tients and outpainpa-tients, as well as between males and females. BMI subgroups were analysed: underweight (BMI < 18.5 kg/m2), normal weight (BMI ≥18.5- < 25 kg/m2), overweight (BMI ≥25- < 30 kg/m2), and
obese patients (BMI≥30 kg/m2). The difference
be-tween the REE predictive equation and REE measured was calculated as percentage. A prediction between 90 and 110% of the REE measured was considered as accurate prediction. A prediction below 90% was con-sidered as under prediction and a prediction over 110% was considered as over prediction. The bias in-dicates the mean percentage error between REE pre-dictive equation and REE measured. The root-mean-square-error (RMSE), expressed in kcal/day, was used to measure how well the equations fitted the REE measurement.
To check whether in underweight and obese patients adjustment of weight in the REE predictive equation re-sulted in a better performance of the equation, body weight adjustment was applied (BMI < 18.5: weight adjusted to BMI = 18.5); BMI > 30: weight adjusted to BMI = 30). The criterion for improvement of performance was percentage
accurate predictions. Statistical significance was
reached when p< 0.05. Data was analysed with IBM
SPSS Statistics 20.
Results Patients
Table 1 shows characteristics of study populations. REE measurements of 593 patients were available. Eighty had incomplete data. In total, 513 general hospital patients were included, (253 F, 260 M), 237 inpatients and 276 outpatients. These patients were often complex patients with multimobidity and were categorised as oncology (29%), gastro-enterology (19%, Diabetes/overweight (14%), Neph-rology (10%), Lung diseases (7%), NeuNeph-rology (5%), diagnostics in unintentional weight loss (5%) and a rest group (8%) of cardiology, anorexia nervosa, auto immune disease, spinal cord injury and RA patients.
REE predictive equations
In total, 15 predictive equations were used. The most used fixed factors (25 kcal/kg/day, 30 kcal/kg/day and 2000 kcal for female and 2500 kcal for male) were added. These fixed factors calculate total energy expend-iture and in order to provide REE, they were divided by
a physical activity and/or stress factor of 1.3. Appendix 1 shows the descriptives of the included REE predictive equations.
Accuracy of predictive equations
Based on REE data of patients with BMI < 25 a new equation was developed in the current population: BMI < 25: REE (kcal/day) = 11.355 × weight (kg) + 7.224 × height (cm) - 4.649 × age (y) + 135.265 × sex (F = 0; M = 1) - 137.475; for BMI≥25 an equation had been developed on healthy overweight and/or obese
subjects by Weijs and Vansant [14]: BMI≥25: REE
(kcal/day) = 14.038 × weight (kg) + 4.498 × height (cm) 0.977 × age (y) + 137.566 × sex (F = 0; M = 1) -221.631.
Table 2 shows statistics of the REE predictive equations for all patients. The percentage of accur-ate predicted REE was low in all equations, ranging from 8 to 49%. Overall the new equation per-formed equal to the best performing Korth equa-tion and slightly better than the well-known WHO equation based on weight and height (49% vs 45% accurate).
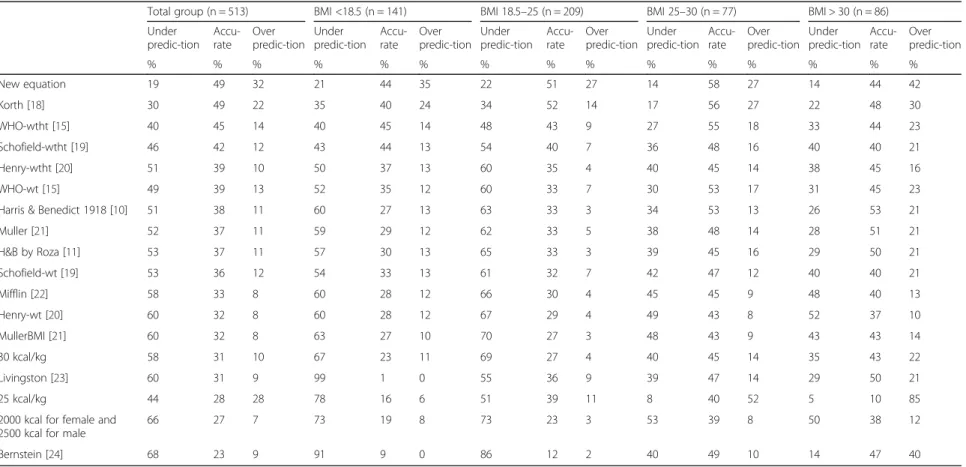
Table 3 shows statistics for the best predictive tions categorized by BMI subgroups. The new equa-tion, Korth and the WHO equation based on weight and height performed best in all categories except from the obese subgroup. HB1918 was best for obese patients.
Figure 1 shows the percentage of accurately predicted underweight and obese patients with actual as well as adjusted weight using the WHO equation with weight and height [15] and HB1918 [10]. Adjusting the weight in the equation in underweight and obese patient did not improve the percentage of patients with an accurate predicted REE.
Discussion
Studies by Anderegg et al. [7] and Boullata et al. [8] ana-lysed (in part) mechanically ventilated patients and are therefore more difficult to compare to current inpatient and outpatient analysis. However, in general they also showed rather inaccurate estimates using different REE es-timating equations. Based on a similar analysis with a much smaller sample size, Weijs et al. [9] concluded that
the WHO equation (1985) [15] based on weight and height and Harris & Benedict (1984) [11] were the best predictive equations. The current analysis confirms that the overall accuracy of REE predictive equations is only about 50%, however this study extends this analysis to BMI subgroups for which predictive accuracy may in fact be much worse.
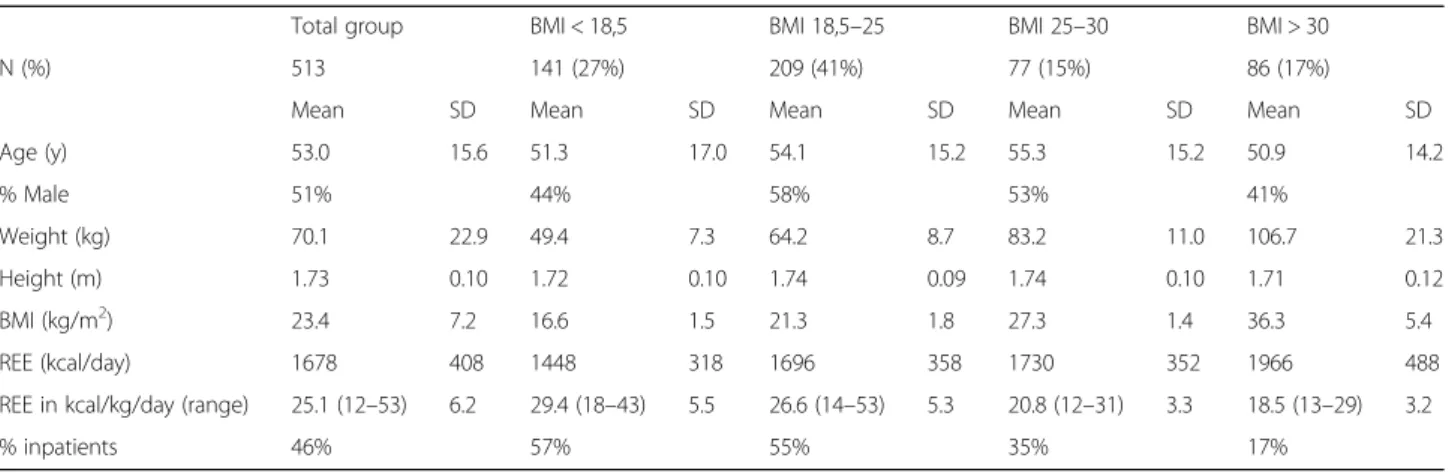
Table 1Patient characteristics for the total group and per BMI group
Total group BMI < 18,5 BMI 18,5–25 BMI 25–30 BMI > 30
N (%) 513 141 (27%) 209 (41%) 77 (15%) 86 (17%)
Mean SD Mean SD Mean SD Mean SD Mean SD
Age (y) 53.0 15.6 51.3 17.0 54.1 15.2 55.3 15.2 50.9 14.2
% Male 51% 44% 58% 53% 41%
Weight (kg) 70.1 22.9 49.4 7.3 64.2 8.7 83.2 11.0 106.7 21.3
Height (m) 1.73 0.10 1.72 0.10 1.74 0.09 1.74 0.10 1.71 0.12
BMI (kg/m2) 23.4 7.2 16.6 1.5 21.3 1.8 27.3 1.4 36.3 5.4
REE (kcal/day) 1678 408 1448 318 1696 358 1730 352 1966 488
REE in kcal/kg/day (range) 25.1 (12–53) 6.2 29.4 (18–43) 5.5 26.6 (14–53) 5.3 20.8 (12–31) 3.3 18.5 (13–29) 3.2
% inpatients 46% 57% 55% 35% 17%
Table 2Statistics of REE prediction equation performance, N = 513
REE (kcal/day) SD Under prediction (%)a Accurate prediction (%)b Over prediction (%)c BIASd RMSEe
REE by calorimetrie 1678 408
New equation 1698 313 19 49 32 4 286
Korth [18] 1621 344 30 49 22 −1 295
WHO-wtht [15] 1540 288 40 45 14 −6 321
Schofield-wtht [19] 1513 282 46 42 12 −7 333
Henry-wtht [20] 1489 291 51 39 10 −9 344
WHO-wt [15] 1504 304 49 39 13 −8 345
Harris& Benedict 1918 [10] 1490 324 51 38 11 −9 350
Muller [21] 1493 308 52 37 11 −9 347
H&B by Roza [11] 1494 321 53 37 11 −9 344
Schofield-wt [19] 1483 293 53 36 12 −9 355
Mifflin [22] 1444 304 60 32 8 −12 369
Henry2005-wt [20] 1458 320 58 31 10 −11 370
MullerBMI [21] 1396 435 60 31 9 −16 450
30 kcal/kg 1618 527 44 28 28 −2 435
Livingston [23] 1405 284 66 27 7 −14 399
25 kcal/kg 1348 440 68 23 9 −19 502
2000 kcal for female and 2500 kcal for male
2253 250 3 11 87 41 689
Bernstein [24] 1208 271 90 8 2 −26 557
a
The percentage of subjects predicted by this predictive equation < 10% of the measured value
b
The percentage of subjects predicted by this predictive equation within 10% of the measured value
c
The percentage of subjects predicted by this predictive equation > 10% of the measured value
d
Mean percentage error between predictive equation and measured value
e
Root mean squared prediction error
Table 3REE predictive accuracy of prediction equations in BMI subgroups
Total group (n = 513) BMI <18.5 (n = 141) BMI 18.5–25 (n = 209) BMI 25–30 (n = 77) BMI > 30 (n = 86)
Under predic-tion
Accu-rate
Over predic-tion
Under predic-tion
Accu-rate
Over predic-tion
Under predic-tion
Accu-rate
Over predic-tion
Under predic-tion
Accu-rate
Over predic-tion
Under predic-tion
Accu-rate
Over predic-tion
% % % % % % % % % % % % % % %
New equation 19 49 32 21 44 35 22 51 27 14 58 27 14 44 42
Korth [18] 30 49 22 35 40 24 34 52 14 17 56 27 22 48 30
WHO-wtht [15] 40 45 14 40 45 14 48 43 9 27 55 18 33 44 23
Schofield-wtht [19] 46 42 12 43 44 13 54 40 7 36 48 16 40 40 21
Henry-wtht [20] 51 39 10 50 37 13 60 35 4 40 45 14 38 45 16
WHO-wt [15] 49 39 13 52 35 12 60 33 7 30 53 17 31 45 23
Harris & Benedict 1918 [10] 51 38 11 60 27 13 63 33 3 34 53 13 26 53 21
Muller [21] 52 37 11 59 29 12 62 33 5 38 48 14 28 51 21
H&B by Roza [11] 53 37 11 57 30 13 65 33 3 39 45 16 29 50 21
Schofield-wt [19] 53 36 12 54 33 13 61 32 7 42 47 12 40 40 21
Mifflin [22] 58 33 8 60 28 12 66 30 4 45 45 9 48 40 13
Henry-wt [20] 60 32 8 60 28 12 67 29 4 49 43 8 52 37 10
MullerBMI [21] 60 32 8 63 27 10 70 27 3 48 43 9 43 43 14
30 kcal/kg 58 31 10 67 23 11 69 27 4 40 45 14 35 43 22
Livingston [23] 60 31 9 99 1 0 55 36 9 39 47 14 29 50 21
25 kcal/kg 44 28 28 78 16 6 51 39 11 8 40 52 5 10 85
2000 kcal for female and 2500 kcal for male
66 27 7 73 19 8 73 23 3 53 39 8 50 38 12
Bernstein [24] 68 23 9 91 9 0 86 12 2 40 49 10 14 47 40
Accurate prediction: the percentage of subjects predicted by this predictive equation within 10% of the measured value Underprediction: the percentage of subjects predicted by this predictive equation <10% of the measured value Overprediction: the percentage of subjects predicted by this predictive equation > 10% of the measured value
al.
Nutrition
&
Metabolism
(2016) 13:85
Page
5
of
Jesus et al. [12] showed that the overall accuracy of the Harris & Benedict equation was reasonable for the out-patient sample. The authors stress that predictive accuracy is much worse in extreme BMI subgroups with BMI under 16 and BMI over 40. The current study generally supports these conclusions, however extend these observations in two ways. First, the general accuracy is not that much higher in the normal weight patient group, in fact accur-acy increases to highest level in overweight subgroup. Sec-ondly, we agree that the subgroup of patients with BMI less than 16 has a low prediction accuracy, however we have also shown low prediction accuracy for a large cohort of malnourished hospitalized elderly with mean BMI 21 (SD 4) [16]. Therefore, the suggestion that predictive equations perform well between BMI 16 and BMI 40 is largely false for hospital patients.
According to Frankenfield et al. [17], adjusting body weight in obese patients leads to underestimation of the energy expenditure. When this is done with a fixed BMI level, the adjustment appears too large and does not re-sult in a higher accuracy of REE prediction. How-ever, accuracy remains low in all predictions.
This study has several strengths and limitations. The sample size of 513 patients was large enough for subgroup analysis, namely BMI subgroups. Furthermore, these data were derived from daily clinical practice and therefore the study population is representative for the inpatient and outpatient population. Another advantage is the exclusion of ICU patients that may not be entirely comparable to the general hospital population. Therefore, this study has a large generalizability to other hospitals and patients.
However, this study has some limitations as well. The measurements were performed in clinical practice and
therefore patients were not measured in overnight fasted state. However, since patients were measured because of nutritional problems, the thermic effect of larger meals, if any, were not a problem in this patient sample. This could have been a problem in obese outpatients, how-ever according to the results the estimations are most accurate in this subgroup. Only when the dietitian indi-cated the patient for nutritional assessment, a measure-ment was performed. This may have led to selection bias as only patients who were difficult to assess and/or treat were included in this study. This may largely explain the low level of accuracy in the current analysis.
This study population was too small to develop a new equation for the hospital in and outpatients. The vari-ation of REE between patients and probably between disease groups is too large. A possible way forward, is to develop new equations in more homogenous subgroups. For this purpose a very large database would be needed on REE in hospital patients. We propose to develop an REE repository for clinical data, comparable to the Oxford database on REE in healthy subjects. This could be jointly organised within ESPEN and ASPEN.
Conclusions
In conclusion, REE predictive equations are only accur-ate in about half the patients. The WHO equation is ad-vised up to BMI 30, and HB1918 equation is adad-vised for obese (over BMI 30). Measuring REE with indirect calor-imetry is preferred, and should be used when available and feasible in order to optimize nutritional support in hospital inpatients and outpatients with different degrees of malnutrition.
Fig. 1The percentage of accurately predicted underweight and obese patients with actual as well as adjusted weight (BMI < 18.5: weight adjusted to BMI = 18.5); BMI > 30: weight adjusted to BMI = 30)
Appendix 1
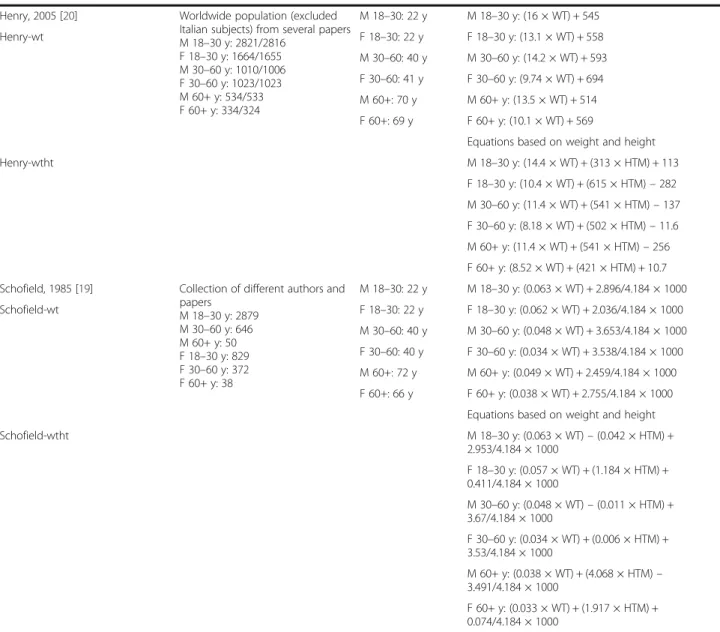
Table 4Descriptives of included predictive equations
Author, year of publication and referred to as
Study population and n Age (mean ± SD or range)
REE Equations (kcal/day)
Bernstein, 1983 [24] Obese individuals; patients who enrolled the Weight Control Unit of the Obesity Research Center IC instrument: Beckman
n: 48 M/154 F
M: 39 ± 12 y M: 11.02 × WT + 10.23 × HTCM - 5.8 × AGE–1032
F: 40 ± 13 y F: 7.48 × WT - 0.42 × HTCM - 3.0 × AGE + 844
FAO/WHO/UNU, 1985 [15] WHO-wt
WHO-wtht
n: 575 M/734 F All: 30–82y M 18–30: (15.3 × WT) + 679
F 18–30: (14.7 × WT) + 496
M 30–60: (11.6 × WT) + 879
F 30–60: (8.7 × WT) + 829
M 60+: (13.5 × WT) + 487
F 60+: (10.5 × WT) + 596
Equations based on weight and height
M 18–30: (15.4 × WT)–(27 × HTM) + 717
F 18–30: (13.3 × WT) + (334 × HTM) + 35
M 30–60: (11.3 × WT) + (16 × HTM) + 901
F 30–60: (8.7 × WT) - (25 × HTM) + 865
M 60+: (8.8 × WT) + (1128 × HTM)–1071
F 60+: (9.2 × WT) + (637 × HTM)–302
Harris & Benedict, 1918 [10] n: 136 M/103 F M: 27 ± 9 (16–63) y M: 66.4730 + (13.7516 × WT) + (5.0033 × HTCM)– (6.7550 × AGE)
F: 31 ± 14 (15–74) y F: 655.0955 + (9.5634 × WT) + (1.8496 × HTCM)– (4.6756 × AGE)
Harris & Benedict, 1984 Roza & Shizgal [11]
H&B by Roza
Data of Harris & Benedict (1918) and data of two further studies by Benedict with data on additional subjects (n: 168 M/169 F)
M: 30 ± 14 y M: 88.362 + (13.397 × WT) + (4.799 × HTCM)– (5.677 × AGE)
F: 44 ± 22 y F: 447.593 + (9.247 × WT) + (3.098 × HTCM)– (4.330 × AGE)
Korth, 2007 [18] Healthy euthyroid weight stable
subjects who were recruited by local announcements n: 50 M/54 F
M: 39 ± 14 (21–68) y All: (41.5 × WT)–(19.1 × AGE) + (35.0 × HTCM) + (1107.4 × SEX)–1731.2/4.184
F: 35 ± 15 (20–66) y
Livingston, 2005 [23] Institute of Medicine population n: 299 M/356 F
M: 36 ± 15 (18–95) y M: 293 × WT0.4330–(5.92 × AGE)
F: 39 ± 13 (18–77) y F: 248 × WT0.4356
–(5.09 × AGE) Mifflin, 1990 [22] IC instrument: metabolic
measurement cart with a canopy hood (Metabolic Measurement Cart Horizons System) n: 251 M (122 obese)/247 F (112 obese)
M: 44 ± 14 (19–78) y M: (9.99 × WT) + (6.25 × HTCM)–(4.92 × AGE) + 5
F: 45 ± 14 (20–76) y F: (9.99 × WT) + (6.25 × HTCM)–(4.92 × AGE)–161
Muller, 2004 [21] Data from seven different research centers in Germany
IC instruments: Deltatrac, Beckman, Mouthpiece (metabolic chamber) nBMI < 18.5: 58
nBMI 18.5–25: 444 nBMI 25–30: 266 nBMI > 30: 278
BMI≤18.5: 32 ± 12 y
All: (0.047 × WT) + (1.009 × SEX)–(0.01452 × AGE) + 3.21/4.184 ×1000
BMI > 18.5–25: 38 ± 17 y
BMI≤18.5: (0.07122 × WT)–(0.02149 × AGE) + (0.82 × SEX) + 0.731/4.184 ×1000
Muller BMI > 25–30: 53 ±
16 y
BMI > 18.5–25: (0.02219 × WT) + (0.02118 × HTCM) + (0.884 × SEX)–(0.01191 × AGE) + 1.233/4.184 ×1000
MullerBMI BMI≥30: 47 ± 13 y BMI > 25–30: (0.04507 × WT) + (1.006 × SEX)–
(0.01553 × AGE) + 3.407/4.184 ×1000
Abbreviations
BMI:Body Mass Index; H&B: Harris & Benedict; ICU: Intensive Care Unit; REE: Resting energy expenditure; WHO: World Health Organisation
Acknowledgments
This study was supported by the VU University Medical Center, Amsterdam, the Netherlands. We thank the dietetic team of the VU University Medical Center Amsterdam for indirect calorimetry measurements and students for their support in the project.
Funding Not applicable.
Availability of data and materials Please contact author for data requests.
Authors’contributions
HK, GH and PW designed the study, performed literature search, data analysis, and writing of the manuscript, and confirmed final draft of the manuscript.
Competing interests
The authors declare that they have no competing interests.
Consent for publication Not applicable.
Ethics approval and consent to participate
All measurements took place in daily clinical practice. Data were
anonymised. All procedures were in accordance with ethical standards of the institution.
Table 4Descriptives of included predictive equations(Continued)
Henry, 2005 [20] Worldwide population (excluded
Italian subjects) from several papers M 18–30 y: 2821/2816
F 18–30 y: 1664/1655 M 30–60 y: 1010/1006 F 30–60 y: 1023/1023 M 60+ y: 534/533 F 60+ y: 334/324
M 18–30: 22 y M 18–30 y: (16 × WT) + 545
Henry-wt F 18–30: 22 y F 18–30 y: (13.1 × WT) + 558
M 30–60: 40 y M 30–60 y: (14.2 × WT) + 593
F 30–60: 41 y F 30–60 y: (9.74 × WT) + 694
M 60+: 70 y M 60+ y: (13.5 × WT) + 514
F 60+: 69 y F 60+ y: (10.1 × WT) + 569
Equations based on weight and height
Henry-wtht M 18–30 y: (14.4 × WT) + (313 × HTM) + 113
F 18–30 y: (10.4 × WT) + (615 × HTM)–282
M 30–60 y: (11.4 × WT) + (541 × HTM)–137
F 30–60 y: (8.18 × WT) + (502 × HTM)–11.6
M 60+ y: (11.4 × WT) + (541 × HTM)–256
F 60+ y: (8.52 × WT) + (421 × HTM) + 10.7
Schofield, 1985 [19] Collection of different authors and papers
M 18–30 y: 2879 M 30–60 y: 646 M 60+ y: 50 F 18–30 y: 829 F 30–60 y: 372 F 60+ y: 38
M 18–30: 22 y M 18–30 y: (0.063 × WT) + 2.896/4.184 × 1000
Schofield-wt F 18–30: 22 y F 18–30 y: (0.062 × WT) + 2.036/4.184 × 1000
M 30–60: 40 y M 30–60 y: (0.048 × WT) + 3.653/4.184 × 1000
F 30–60: 40 y F 30–60 y: (0.034 × WT) + 3.538/4.184 × 1000
M 60+: 72 y M 60+ y: (0.049 × WT) + 2.459/4.184 × 1000
F 60+: 66 y F 60+ y: (0.038 × WT) + 2.755/4.184 × 1000
Equations based on weight and height
Schofield-wtht M 18–30 y: (0.063 × WT)–(0.042 × HTM) +
2.953/4.184 × 1000
F 18–30 y: (0.057 × WT) + (1.184 × HTM) + 0.411/4.184 × 1000
M 30–60 y: (0.048 × WT)–(0.011 × HTM) + 3.67/4.184 × 1000
F 30–60 y: (0.034 × WT) + (0.006 × HTM) + 3.53/4.184 × 1000
M 60+ y: (0.038 × WT) + (4.068 × HTM)– 3.491/4.184 × 1000
F 60+ y: (0.033 × WT) + (1.917 × HTM) + 0.074/4.184 × 1000
Mmale,Ffemale,yyears,WTweight in kilogram,HTMheight in meters,HTCMheight in centimetres;SEX(male = 1, female = 0) sex,REEresting energy expenditure;kcal/dkilocalories a day,ICindirect calorimetry
Author details
1Department of Nutrition and Dietetics, Internal Medicine, VU University
Medical Center, P.O. Box 7057, Amsterdam 1007 MB, The Netherlands. 2
Department of Nutrition and Dietetics, School of Sports and Nutrition, Amsterdam University of Applied Sciences, Amsterdam, The Netherlands.
Received: 21 September 2016 Accepted: 15 November 2016
References
1. Fraipont V, Preiser J-C. Energy estimation and measurement in critically ill patients. JPEN J Parenter Enteral Nutr. 2013;37(6):705–13.
2. Acheson KJ. Indirect calorimetry: a case for improved standard operating procedures. Eur J Clin Nutr. 2014;68(1):1.
3. Phang PT, Rich T, Ronco J. A validation and comparison study of two metabolic monitors. JPEN J Parenter Enteral Nutr. 1990;14(3):259–61. 4. Haugen HA, Chan L-N, Li F. Indirect calorimetry: a practical guide for
clinicians. Nutr Clin Pract. 2007;22(4):377–88.
5. Flancbaum L, Choban PS, Sambucco S, Verducci J, Burge JC. Comparison of indirect calorimetry, the Fick method, and prediction equations in estimating the energy requirements of critically ill patients. Am J Clin Nutr. 1999;69(3):461–6.
6. Sundström M, Tjäder I, Rooyackers O, Wernerman J. Indirect calorimetry in mechanically ventilated patients. A systematic comparison of three instruments. Clin Nutr. 2013;32(1):118–21.
7. Anderegg BA, Worrall C, Barbour E, Simpson KN, Delegge M. Comparison of resting energy expenditure prediction methods with measured resting energy expenditure in obese, hospitalized adults. JPEN J Parenter Enteral Nutr. 2009;33(2):168–75.
8. Boullata J, Williams J, Cottrell F, Hudson L, Compher C. Accurate determination of energy needs in hospitalized patients. J Am Diet Assoc. 2007;107(3):393–401.
9. Weijs PJM, Kruizenga HM, van Dijk AE, van der Meij BS, Langius JAE, Knol DL, et al. Validation of predictive equations for resting energy expenditure in adult outpatients and inpatients. Clin Nutr. 2008;27(1):150–7.
10. Harris JA, Benedict FG. A Biometric Study of Human Basal Metabolism. Proc Natl Acad Sci U S A. 1918;4(12):370–3.
11. Roza AM, Shizgal HM. The Harris Benedict equation reevaluated: resting energy requirements and the body cell mass. Am J Clin Nutr. 1984; 40(1):168–82.
12. Jésus P, Achamrah N, Grigioni S, Charles J, Rimbert A, Folope V, et al. Validity of predictive equations for resting energy expenditure according to the body mass index in a population of 1726 patients followed in a Nutrition Unit. Clin Nutr. 2015;34(3):529–35.
13. Compher C, Frankenfield D, Keim N, Roth-Yousey L. Best practice methods to apply to measurement of resting metabolic rate in adults: a systematic review. J Am Diet Assoc. 2006;106(6):881–903.
14. Weijs PJM, Vansant GAAM. Validity of predictive equations for resting energy expenditure in Belgian normal weight to morbid obese women. Clin Nutr. 2010;29(3):347–51.
15. Food and Agricutural Organization. Human energy requirements: Report of a Joint FAO/WHO/UNU Expert Consultation. FAO Food Nutr Tech Rep Ser [Internet]. 2001;0:96. Available from: ftp://ftp.fao.org/docrep/fao/007/y5686e/ y5686e00.pdf.
16. Neelemaat F, van Bokhorst-de van der Schueren MAE, Thijs A, Seidell JC, Weijs PJM. Resting energy expenditure in malnourished older patients at hospital admission and three months after discharge: predictive equations versus measurements. Clin Nutr. 2012;31(6):958–66.
17. Frankenfield DC, Rowe WA, Smith JS, Cooney RN. Validation of several established equations for resting metabolic rate in obese and nonobese people. J Am Diet Assoc. 2003;103(9):1152–9.
18. Korth O, Bosy-Westphal A, Zschoche P, Glüer CC, Heller M, Müller MJ. Influence of methods used in body composition analysis on the prediction of resting energy expenditure. Eur J Clin Nutr. 2007;61(5):582–9.
19. Schofield WN. Predicting basal metabolic rate, new standards and review of previous work. Hum Nutr Clin Nutr. 1985;39 Suppl 1:5–41.
20. Henry CJK. Basal metabolic rate studies in humans: measurement and development of new equations. Public Health Nutr. 2005;8(7A):1133–52. 21. Müller MJ, Bosy-Westphal A, Klaus S, Kreymann G, Lührmann PM,
Neuhäuser-Berthold M, et al. World Health Organization equations have shortcomings for predicting resting energy expenditure in persons from a
modern, affluent population: generation of a new reference standard from a retrospective analysis of a German database of resting energy expe. Am J Clin Nutr. 2004;80(5):1379–90.
22. Mifflin MD, St Jeor ST, Hill LA, Scott BJ, Daugherty SA, Koh YO. A new predictive equation for resting energy expenditure in healthy individuals. Am J Clin Nutr. 1990;51(2):241–7.
23. Livingston EH, Kohlstadt I. Simplified resting metabolic rate-predicting formulas for normal-sized and obese individuals. Obes Res. 2005;13(7): 1255–62.
24. Bernstein RS, Thornton JC, Yang MU, Wang J, Redmond AM, Pierson RN, et al. Prediction of the resting metabolic rate in obese patients. Am J Clin Nutr. 1983;37(4):595–602.
• We accept pre-submission inquiries
• Our selector tool helps you to find the most relevant journal
• We provide round the clock customer support
• Convenient online submission
• Thorough peer review
• Inclusion in PubMed and all major indexing services
• Maximum visibility for your research
Submit your manuscript at www.biomedcentral.com/submit