Calculation Method of Green Open Space
Based on Carbon Emission from Transportation
Sector in Surabaya
Nurani Ikhlas
1, Taufik Abdullah
1, and Rachmat Boedisantoso
1Abstract Surabaya is one of the metropolitan cities with dense transportation activities. Transportation is an activity contributes in increasing excessive release of carbon emmisions into the air. The increasing of carbon emmision can causes inventory green open space should be adjusted to reduce air pollution. The purpose of this study is to determine the green open space necessary based on the carbon emissions that is produced in the city of Surabaya. This study was conducted by the method of approach in Surabaya in each area of the transportation sector. The results show that the total green open space is needed in Surabaya is 66.526 km2 with total emission is produced 329,443.66 CO2/month or about 3,953,323.92 CO2/year.
Keywordscarbon emmision, green open space, transportation.
AbstrakSurabaya adalah salah satu kota metropolitan dengan aktivitas transportasi yang padat. Transportasi merupakan kegiatan yang berkontribusi dalam meningkatkan pelepasan emmisi karbon yang berlebihan ke udara. Peningkatan emmisi karbon dapat menyebabkan persediaan ruang terbuka hijau harus disesuaikan untuk mengurangi polusi udara. Tujuan dari penelitian ini adalah untuk mengetahui ruang terbuka hijau yang diperlukan berdasarkan emisi karbon yang dihasilkan di kota Surabaya. Penelitian ini dilakukan dengan metode pendekatan di Surabaya di setiap wilayah sektor transportasi. Hasil penelitian menunjukkan bahwa total ruang terbuka hijau yang dibutuhkan di Surabaya adalah 66,526 km2 dengan total emisi diproduksi 329.443,66 CO2 / bulan atau sekitar 3.953.323,92 CO2 / tahun..
Kata Kunciemisi karbon, ruang terbuka hijau, transportasi.
I.INTRODUCTION1
urabaya is located in the Northen Coast of East Java Province. Geographically, it is located in 9’-7 ° 7 ° South Latitude and 112 ° 112 ° 36’-57’ East Longitude. Surabaya city borders with Madura strait in the north and east, Sidoarjo Regency in the south, and Gresik Regency in the west. Surabaya areas are mainly lowlands, with the height between 3 to 6 ms above sea level except in the south, there are 2 gently sloping hills altitude between 25 – 50 ms above sea level. In Surabaya, there is river estuary of Kalimas, one of the two fractions of Brantas River. Administratively, Surabaya is divided into 163 districts and 31 sub districts with the total population reaches 2.9 Million people at night and it doubles up to 5.6 Million people at day due to many people coming from the neighboring cities working in Surabaya. [1]. Surabaya is the second largest metropolitan city in Indonesia by having various activities very dense population [2]. The increase of population and activity in urban areas will increase green house gas in Surabaya. Various human activities likes transportation sector, industry sector, commercial and domestic sector can contribute emission in urban areas [3].
One of them is in the transportation sector which has a crowded activities considering that the activities of Surabaya as the center of government, commerce, industry, business, education, and tourism [4]. Intra-city transport is dominated by motor vehicles, motorcycles, and taxis. Public bus,metered taxis,shuttle vans (or bemo), and rickshaws (or becak) are also available with multiple routes throughout the city. Surabaya also has commuter rail inter-city transportation system from Surabaya to
1Nurani Ikhlas, Taufik Abdullah, and Rachmat Boedisantoso are with Departement of Environmental Engineering, Institut Teknologi Sepuluh Nopember, Surabaya, 60111, Indonesia. E-mail:
other cities in eastern part of Surabaya, such as Malang, Sidoarjo, Kertosono, and Mojokerto [5].
In Indonesia, approximately 70% of urban air pollution have been caused by vehicles emissions and to produce any harmful substances with negative impacts, for human and environmental health. The increase in CO2 concentration is caused by the increasing consumption of fuel oil, coal, and other organic fuels in many human activities [6]. Therefore, the CO2 in the air should be sought not growing up; one of the ways is to reduce CO2 emissions in urban areas by developing any urban forests The exhaust gases from the combustion of fuel oil (BBM) contains pollutants such as CO2 (Carbon dioxide), NOx (nitrogen oxide), CO (Carbon Monoxide), VHC (Volatile Hydro Carbon) and particulate matter [7]. The content of vehicle exhaust a large impact on the environmental pollution is carbon dioxide (CO2) because carbon dioxide (CO2) is a greenhouse gas with the highest content and have a major impact on the greenhouse effect [8].
Emissions that give a great impact is the CO2 emissions of the pollutants that have a large contribution toward global warming and climate change [9]. One way to reduce the CO2 emissions by creating green open space in each area in Surabaya according to the distribution of the emissions produced in each area. Green open space is function to suppress the negative effects of the built environment in urban areas, such as increased air temperatures, a decrease in the level of water infiltration and humidity, pollution and others [10]. International organizations like the United Nations (UN) and the World Health Organization (WHO) are focusing on healthy living conditions in urban areas (WHO 2008). Green Open Spaces include major features which contribute to
nurani.ikhlas@gmail.com; taufik.abdullah88@gmail.com; Boedirb@yahoo.com
the improvement of aesthetic conditions and numerous bioclimatic functions: reducing CO2 emissions and urban heat islands, serving as water regeneration and noise attenuator, acting as wind breakers, and also doubling as a habitat for animals. These possible functions have resulted in the mandate of min. 9 m²/capita or optimal 10 to 15 m²/capita green open space [11].
According to the law No. 26 /2007 on the compliance space, green open space (GOS) should have an area of at least 30% from the total area with a share of 20% as public green space and 10% as private green open space [12]. Private green open space is belong to a particular institution or individual who for a limited utilization among others, the garden or yard or building of the public and private cultivated plants. Public green open space is owned and managed by local goverment city used for the benefit of society in general [13].
This study will assess the comprehensive determination of green open space that is required for each area in Surabaya as a public green open space of CO2 emissions that is generated by each respective area / region of the transportation sector. The study used to method collecting of the data emission CO2 from transportation sector based on types of the road in Surabaya. Apart of the data emission CO2 in each area, the large area of data in Surabaya to get the large of green open space in Surabaya from the 20% total large of Surabaya. The goal of this study is to calculating the large of green open space in Surabaya from data of the large each area and data emission of CO2 in each area in Surabaya from transportation sector.
II.METHOD
The method in this study is used to collect the CO2 emissions data of each area / region in Surabaya. Areas in Surabaya consists of area comprising North, Central, East, South and West of Surabaya. Each area in Surabaya belongs large area for based to calculate total emission of CO2 in each area in Surabaya. Emissions in each area / region in Surabaya from the transportation sector based on the types of road. The road classification by function base on law No. 38 of 2004 is [14]:
Arterial roads
Arterial road is public road that serves the main transport function with the characteristics of long-distance travel, average speed is high and the number of driveways restricted efficiently
Collector roads
Collector roads are public roads that serve the transportation function collector or divider with characteristics of medium-range trips, average speed and the number of driveways being restricted
Local roads
Local roads are public roads that function to serve local transportation with the characteristics of traveling a short distance, average speed is low and the number of driveways is not restricted
Environment roads
The road environment is a public road which serves airport shuttles traveling environment characterized by close range and average speed low
Types of road use to in this study are five categories the consists of primary arterial, secondary arterial, collector primary, secondary collector, and local.
The distribution of emission that is obtained basic for determining the green open space in each area around Surabaya. Data emission in each area in Surabaya multiple by large areas to get the total emission of CO2 ton/years in each area of the result. Total area of green open space that needed is 20% of the total area in Surabaya. The next step, total emission of CO2 in each area multiple by persentasion of green open space is 20% to get the large green open space the result in Surabaya.
III.RESULTS AND DISCUSSION
The study calculating method of green open space based on carbon emission from transportation sector used to data large of each area and emission of CO2 in each area in Surabaya. Total of the large area in Surabaya is 332.63 km2 [15]. Areas in Surabaya consists of North of Surabaya, East, Central, South, and West of Surabaya. Total of the large area in Surabaya from each area can see the table 1.
TABLE 1.
THE LARGE OF EACH AREA IN SURABAYA No Area Large of Area (Km2)
1 North of Surabaya 38.39
2 East of Surabaya 91.18
3 Central of Surabaya 14.79
4 South of Surabaya 64.06
5 West of Surabaya 124.21
Total of the large area 332.63
Source : Central Bureau of Statistic Surabaya in Number, 2015
The large of Surabaya is divided into five areas, there are Surabaya Northern region with an area of 38.39 km2, Surabaya Eastern area of 91.18 km2, spacious central of Surabaya by 14.79 km2, South of Surabaya is 64.06 km2, and spacious West of Surabaya is 124.21 km2.
The area is also supported by increasing rapidly development of the city, especially in the provision on facilitie such as housing, education, industry and other businesses are increasing the demand of land. Development of city is accompanied by motor vehicel traffic density so that the city becomes unhealthy caused by pollution released from the transportation sector [16].
Transportation sector can increase the release of excess carbon dioxide emission into the air. CO2 is produced primarily by the decomposition of vegetable matter and animate respiration, forms part of the Earth’s carbon cycle. However, a small portion of CO2 is a by product of fossil fuel combustion from human activity. Most such combustion occurs in the production energy, and about a third of this involves transportation [17].
One way to reduce carbon dioxide emission is to create a green open space (GOS) of the city. Green open space is part of the open spaces an urban area that is filled with herbs, plants and vegetation for healthy, comfortable, and aesthetics [18].
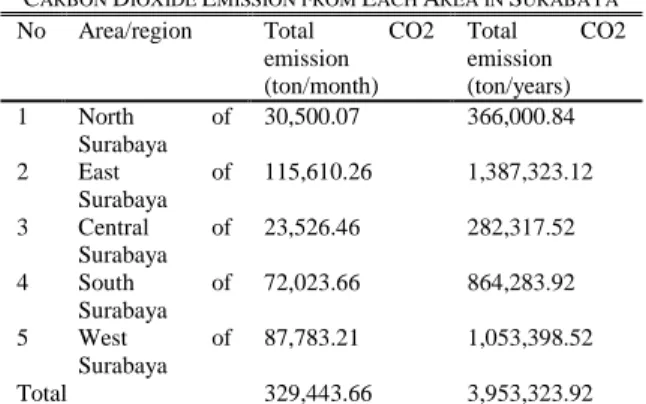
study is the city of Surabaya. Total carbon in each area in Surabayacan be seen in table 2.
TABLE 2.
CARBON DIOXIDE EMISSION FROM EACH AREA IN SURABAYA No Area/region Total CO2
emission (ton/month)
Total CO2 emission (ton/years) 1 North of
Surabaya
30,500.07 366,000.84
2 East of Surabaya
115,610.26 1,387,323.12
3 Central of Surabaya
23,526.46 282,317.52
4 South of Surabaya
72,023.66 864,283.92
5 West of Surabaya
87,783.21 1,053,398.52
Total 329,443.66 3,953,323.92 Source : Pradiptiyas, 2011 [19]; Kusuma, 2010; Widyanadiari, 2011
Table 2 shows the data of CO2 emission in each area in Surabaya. North of Surabaya with the total of CO2 emission is 30,500.07 ton/month or 366,000.84 ton/year, East of Surabaya with CO2 emission is 115,610.26 ton/month or 1,387,323.12 ton/year. CO2 emission in central of Surabaya is 23,526.46 ton/month or 282,317.52 ton/year, South of Surabaya with CO2 emission is 72,023.66 ton/month or 864,283.92 ton/year, and CO2 emission in West of Surabaya is 87,783.21 ton/month or 1,053,398.52 ton/year. Total of CO2 emission in Surabaya is 329,443.66 ton/month or 3,953,323.92 ton/year from the value of CO2 emission in each area/region.
The result was obtained from collect of data emission CO2 in each area based on the type of road in each area. Types of roads are five categories the consists of primary arterial, secondary arterial, collector primary, secondary collectors, and local. The data area and emission data for each respective area in Surabaya can know the percentage of emissions in each area can be seen in Table 3.
TABLE 3.
PERCENTAGE (%) OF CO2 EMISSION IN EACH AREA/REGION IN SURABAYA
No Area CO2 Emission (ton/month)
% of CO2 Emission 1 North of
Surabaya
30,500.07 9.26
2 East of Surabaya
115,610.26 35.09
3 Central of Surabaya
23,526.46 7.14
4 South of Surabaya
72,023.66 21.86
5 West of Surabaya
87,783.21 26.65
Total 329,443.66 100
Table 3 shows the value percentage (%) of CO2 emission in each area in Surabaya based on the large of area and CO2 emission in each area. Formula of the percentage (%) CO2 emission is the mount of CO2 emission divided to the total of CO2 emission in Surabaya from the mount emission in each area multiple by one hundred (%).
% CO2 emission = (CO2 emission (ton/month) / Total of CO2 emission (ton/month)) x 100
Support of the table 3 can be seen in figure 1 about to clear explanation of percentage (%) CO2 emission in Surabaya from each area.
Figure 1. % of CO2 Emission in Each Area/Region in Surabaya
Figure 1 to describe the persentage (%) of CO2 emission in each area in Surabaya. The persentage (%) of CO2 emission in North of Surabaya is 9.26 %, persentage (%) of CO2 emission in East of Surabaya is 35.09 %, Central of Surabaya is 7.14 % of CO2 emission. South of Surabaya is 21.86 % of CO2 emission and the persentage (%) of CO2 in West of Surabaya is 26.65 %.
The table 2 dan table 3 explain about CO2 emission in each area in Surabaya. East of Surabaya has the greatest level of CO2 emissions, it is because there are people with the most dense transport activities. Surabaya eastern consists of seven districts are Tambaksari district, Gubeng, Rungkut, Tanggilis Meroyo, Gunung Anyar, Sukolilo district, and Mulyorejo district. District Rungkut has the higest contributed of CO2 emission because in Rungkut district there are industry area that causes increasing people use to transportation for support activity.
Data of CO2 emission will be used as an approach to determine the extent of the green open space in each area/region in Surabaya by assuming green open space (GOS) desired percentage of 20% from the total land areas multipled by percentage of CO2 emission in each area in Surabaya. That qualitative approach to comprehend the extent green open space. The large of green open space (GOS) in each area in Surabaya can be seen Table 4.
TABLE 4.
PERCENTAGE THE LARGE OF GREEN OPEN SPACE (GOS) No Area % of CO2
Emission
20% of large in Surabaya
% of GOS 1 North of
Surabaya
9.26 66.526 1.851
2 East of Surabaya
35.09 66.526 7.018
3 Central of Surabaya
7.14 66.526 1.428
4 South of Surabaya
21.86 66.526 4.372
5 West of Surabaya
26.65 66.526 5.329
Total 100 - 20
Surabaya is 1.42%, South of Surabaya need to large of green open space is 4.36%, and for Surabaya Western is 5.39% for green open space. Total of percentage of the large for green open space in each area in Surabaya is 20%. This is suitable to with the desired percentage of 20% of the total area green open space in the city of Surabaya.
Support to clear explanation for percentage (%) large of green space area in each area in Surabaya can be seen figure 2.
Figure 2. % of the Large of Green Open Space in Each Area/Region
Based on the percentage of each area of green open space, it can be calculated the area of green open space for each respective area in city of Surabaya with the formula is 20% of the total area of Surabaya multiplied by the percentage of emission divided by one hundred (percentage). The result of extensive calculations of green open space can be seen in Table 5.
TABLE 5.
LARGE OF GREEN OPEN SPACE (GOS) IN EACH AREA No Area 20% of
large in Surabaya
% of GOS
Large of GOS (km2)
1 North of Surabaya
66.526 1.851 6.16
2 East of Surabaya
66.526 7.018 23.24
3 Central of Surabaya
66.526 1.428 4.75
4 South of Surabaya
66.526 4.372 14.54
5 West of Surabaya
66.526 5.329 17.73
Total - 20 66.526
Table 5 shows that the total area of green open space in Surabaya based on the CO2 emission distribution in each area/regian with assumption 20% of the total area of green open space in Surabaya amounted to 66.526 km2 Area North of Surabaya need to green open space is 6.16 km2, East of Surabaya need to green open space is 23.35 km2, green open space to Central of Surabaya is 4.75 km2. The large of area green open space to South of Surabaya is 14.54 km2 and to West of Surabaya need the large of green open space is 17.73 km2. The amount of large of green open space from each area north, east, central, south, and west in Surabaya is 66.526 km2.
Areas with the largest deployment of carbon emissions and the broad green space located in the largest area in East Surabaya. East Surabaya is heading to education, housing, and trade area. But the main income is on the industrial and trading sector [20]. Viewed from existing activities in East of Surabaya, such as education are numerous universities in areas Sukolilo likes Sepuluh Nopember Institute of Technology, PPNS, PENS, Hang Tuah University, ITATS, and others. Thiss causes an increase in the population in the district of Sukolilo which also resulted in increased use of the transport to support their activities. The higest of transportation sector in Sukolilo is causes increasing CO2 emission in East of Surabaya.
District Rungkut has contribution the largest distribution of CO2 emissions because the district Rungkut is a district that has a quite a lot density and transportation activities. This is an causes in area district Rungkut there is industrial area support to increasing use to transportation sector.
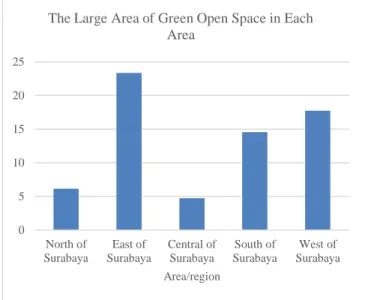
While the need for green space in each region can be seen in the following graphic in Figure 3.
Based on the figure 3 can be known the needs of green open space in each area based on the distribution of CO2 emissions. In North Surabaya required green space area approximately 6.16 km2. In East Surabaya required green space area approximately 23.24 km2. In Central Surabaya required green space area approximately 4.75 km2. In South Surabaya required green space area approximately 14.54 km2. While in West Surabaya required green space area approximately 17.73 km2.
Figure 3. The large of Green Open Space in Each Area
Based on these results is that the greatest need for green open space in east Surabaya. This caused by several factors such as this area was the largest contributor for CO2 emissions, high population density, and there is industry in the districts Rungkut that causing high CO2 emissions,. While the area of green open space in Surabaya Center has extensive lowest because there is no contribution CO2 emissions from industry located in the area. Whereas the transport sector was not so significant effect of CO2 emissions being propagated. This led to the need for open green space in the area was only 4.73 km2 from the total area of Surabaya.
0 5 10 15 20 25
North of Surabaya
East of Surabaya
Central of Surabaya
South of Surabaya
West of Surabaya
Area/region
IV.CONCLUSION
Surabaya has a carbon emissions distribution in each area / region by the transportation sector the total CO2 emissions amounted to 329,443.66 tons / month or about 3,953,323.92 CO2 tons / year. Green open space area in Surabaya with the percentage assumption 20% from the total area of 66.526 km2 Surabaya with a broad distribution of green open space each area / region amounted to 6.159 km2 North Surabaya, East Surabaya area of 23.34 km2, the area of Surabaya Center of 4.75 km2, South Surabaya area of 14.54 km2, and West Surabaya area of 17.72 km2.
AKNOWLEDGEMENT
This study was supported by Sepuluh Nopember Institute of Technology, and we are also grateful to Dr. Rachmat Boedisantoso, ST, MT for supporting this paper.
REFERENCES
[1] Central Bureau of Statistic Surabaya in Number, “Profil of Surabaya”, Jakarta, 2015.
[2] Pratiwi, S.R., “Adequacy Analysis of Privat Residences green Space in Absorbing CO2 Emission and Fullfilling the Human Needs of O2 in North Surabaya (Case Study : Kenjeran District)” in Scientific Conference of Environmental Technology IX-2012 pp.1-6, 2012.
[3] Gusnita, Dessy and Suaydhi, “Emission Estimation of Fuel Comsumption and CO2 Absorption by Green Open Space in Jakarta,” proceedings of the IConSSE FSM SWCU, pp. SC. 21-29., 2015
[4] Kusuma, W, P., “Contribution study of Transportation Activities Toward Carbon Emission in Western Surabaya” in Paper of Institute Technology of Sepuluh Nopember, pp.8-21, 2010. [5] Driving Singapore’s External Economy, “Surabaya City Brief,”
Desember, 2014
[6] Lee, Byeongho, et al., “Carbon Dioxide Reduction Through Urban Green Open Space in the case os Sejong City Master Plan,” International Conference on Sustainable Building Asia, 2005 [7] Data and Information Center of Energy and Mineral Resources
Ministry of Energy and Mineral Resources, “Assessment of Greenhouse Gas Emissions Transportation Sector”, Jakarta, 2012. [8] Adiastari, Ratri, et al., “Study on the Ability of Green Open Space in Absorbing Carbon Emission in the City Surabaya, Sepuluh Nopember Institute of Technology, 2011
[9] Widyanadiari, S,R, “Adequasy Analysis of Green Open Space as CO2 Emission Absorber in Urban by Using Stella Program (Case Study: Central and South of Surabaya)” in Paper of Institute Technology of Sepuluh Nopember, pp. 1-27, 2011.
[10] Santoso. Budi, Hidayah. Retna, Sumardjito, “Green Open Space use Patterns the Area Township Plemburan Tegal. Ngaglik Sleman,” Inersia, vol. VIII, No.1, pp. 1-14, 2012
[11] Werner. Cosima, “Green Open Spaces in Indonesian Cities : Schisms Between Law and Practice,” Department of Geography, Friedrich-Alexander-University, Germany, 2013
[12] The Law No. 26 Year 2007 on Spatial Planning. [Online]. Available:http://www.bkprn.org/peraturan/the_file/UU_No26_20 07.pdf
[13] Widyanadiari, S,R, “Adequasy Analysis of Green Open Space as CO2 Emission Absorber in Urban by Using Stella Program (Case Study: Central and South of Surabaya)” in Paper of Institute Technology of Sepuluh Nopember, pp. 1-27, 2011.
[14] The Law No. 38 Year 2004 on Spatial Planning. [Online]. http://www.sanitasi.net/undang-undang-no-38-tahun-2004-tentang-jalan.pdf
[15] Central Bureau of Statistic Surabaya in Number, “Profil of Surabaya”, Jakarta, 2015.
[16] Julius, R.R and Harahap, T.K, “Pekanbaru City Goverment Strategy to Increase Green Open Space in Pekanbaru” Riau University, 2013
[17] Hartgen, D.T, et al., “Impact of Transportation Policies on Greenhouse Gas Emissions in U.S Region,” Policy Study, 2011. [18] Mutia, S.A, et al., “Analysis of Availability and Housing Areas in
Need Green Open Space in Makasar,” Hasanuddin University, 2012
[19] Pradiptiyas, Driananta., “Adequacy Analysis of Open Space as CO2 Emission Absorber in Urban by Using Stella Program (Case Study : North and East of Surabaya)” in Paper of Institute Technology of Sepuluh Nopember, pp.1-28, 2011