Introduction
Medicines account for a substantial portion of health expenditure (up to 20-21% in some countries), and is rising faster than any other area of health care. This is a concern to most governments, which strive to maintain equitable access to health care for the population at an affordable cost.
Prescribing expenditure is made of two elements – first the extent of utilisation, and second the price.Utilisation as a measure is standardised by the use of the WHO defined daily dose (DDD) [1], usually expressed as per 1000 population. While the DDD is not a perfect measure [2], there is long experience of its use and no viable alternative.
There is no standardisation in the measurement of price. There are wide discrepancies in the prices paid among European countries for licensed medicines, despite the existence of a single European market. As a broad generalisation, the northern European countries have higher prices but lower volumes of usage compared to the Mediterranean countries.The UK is now considered to have the highest pharmaceutical prices in Europe based on a series of bilateral comparisons with a
defined basket of medicines [3]. Such bilateral comparisons often use Laspeyre’s or Paasche indices where two countries are specified, and are widely used by national reimbursement agencies. But these indices cannot be used to capture the market across all of Europe.
As part of the EuroMedStat project [4], we sought to explore the available data sources on price and utilisation, their strengths and weaknesses, and to make recommendations for indicators to allow international comparisons on expenditure and efficiency of the market in different countries.This paper focuses particularly on the issues of price, how it can be compared across countries in western Europe (“old” EU 15 and Norway).
Conceptual issues: Price and its meaning
“Price” has different meanings in different countries, as it is influenced by the structure of the market in each country: different health systems and financing, divergent regulatory and pricing policies, medicine subsidies, production costs and product mix variations, and dispensing fees. Indeed, the whole concept of “price” may be a
The EurMedStat proposals on indicators for price and utilisation
Tom Walley
1, Pietro Folino-Gallo
2, Michael Barry
3, Mario Bruzzone
4, Kees DeJoncheere
5, Ingrid
Rosian
6, Helmut Schröder
7, Lesley Tilson
3, Sabine Vogler
6, on behalf of the EuroMedStat Group
1Prescribing Research Group, University of Liverpool, Liverpool L69 3GF, UK; 2National Research Council,
Institute for Research on Population and Social Policies Rome – Italy; 3National Centre for Pharmacoeconomics, Dublin, Ireland; 4Ministry of Economics, Rome, Italy; 5WHO-Europe, Copenhagen, Denmark; 6OBIG Austrian Institute of Health, Vienna, Austria; 7German Social Insurances, Bonn, Germany
Correspondence to: Tom Walley, Prescribing Research Group, University of Liverpool, Liverpool L69 3GF, UK. E-mail: [email protected]
Abstract
Medicines account for an increasing proportion of healthcare budgets in all European countries. The EuroMedStat project aims to establish methods and systems for comparing the publicly funded pharmaceutical markets across Europe. A key issue is how to compare prices across countries. There are established methods for bilateral comparisons between two countries which are used in pricing negotiations but no means of a broader overview. Difficulties exist because of: a lack of directly comparable packages of individual medicines across Europe; currency conversion in some countries, despite the use of the euro; a range of different prices from different parts of the supply chain that could be studied; differences even within what are included in prices across countries (e.g. pharmacy fees etc); and most important, lack of availability of data on many of these points.
Our aim was to produce pragmatic suggestions and these are presented. We suggest that the price used in the pharmacy retail price; that the denominator for price is the defined daily dose; and that the package size selected is that which most closely equates to one month’s treatment at the most commonly used dosage. From this, we derive a number of markers of the efficiency of national markets. It is important that the limitations of these are understood and that they are sued only as broad indicators to begin exploring areas of possible concern, and not for instance in price setting. These indicators now need field testing and the project will extent to include the new accession countries.
myth,as it implies a free market – in some countries prices are regulated,in some they are benchmarked or referenced to a cheaper preparation, but in others regulation of the pharmaceutical market takes a different form. For instance in the UK, companies are free to price new products as they wish but the government regulates the company profits. This allows companies to establish a high initial price for their product if launched in the UK as the first European market, which will influence prices in other countries [5].
Methodological Issues
There are many methodological problems in performing cross-country comparisons of pharmaceutical prices [6-8]. First we must consider which price interests us, as there are several points within the distribution chain at which price could be measured. Does our interest lie in the amount paid by the patient (but this may be perhaps only a modest co-payment) at one extreme, or at the commonly quoted ex-factory prices at the other.The strengths and weaknesses of each are explored in Box 1. Which we use may depend also on the availability of data.
Other issues
There are other issues to be considered in comparing prices across countries:
Currency and Purchasing Power: currency
conversions and fluctuations are less of an issue
now with so many countries using the euro, but a significant number (including the new Accession countries) retain national currencies. It is important to specify when the comparison is made and the exchange rate at that time.
Simple currency conversions do not explain all the differences however, as the simple monetary value is worth different amounts in different countries. Purchasing Power Parities (PPPs) measure the price to purchase of the same basket of goods and services in different countries. But there can be separate PPPs defined for general goods and services and for health care and which should be used is open to debate [9]. Table 1 shows how general PPP varies compared to the USA (e.g. the cost of living in France is higher than the US, but pharmaceuticals are relatively less expensive). Some standard sources of such information such as IMS simply ignore PPP in comparing ex-factory prices, since their major interests are the movement of
Box 1. Possible prices to be compared
Ex-factory prices
These are the theoretical cost of a drug as it leaves the factory gates and on the open market. Where there is only one supplier of a drug, such figures may mean little. Ex-factory prices are not readily available for many drugs, and are often calculated from manufacturers’ list prices in a very arbitrary way (e.g. list price minus 20% or using more complex mathematical coefficients). Nor do they have much public health importance in that these are not what each state actually pays for medicines. But they may be useful for industry sources and national agencies, who often use ex-factory prices as the basis for reimbursement negotiations
Wholesale prices
Wholesale prices are more widely available than ex-factory prices. But because of variations in payments to wholesalers and fixed margins in some countries, could perhaps not be considered as being at the same point in the supply chain in all countries
Pharmacy retail prices
The official pharmacy retail price is the most common and widely available figure. But even this is problematic – in some countries this includes a mark up for the pharmacist, but not in others, or it may include value added tax at varying rates even within the one country (Figure 1). The total cost of medicines to a third party payer may be less than the sum of the retail pharmacy costs, since in some countries, e.g. the UK, the state pays only a discounted fee to the pharmacist. Nevertheless pharmacy retail price has the advantage, compared to ex-factory price, of representing all the components of the system, including differences in distribution costs and taxation
However the actual reimbursement price may also differ from the pharmacy retail price (for example in Austria the reimbursement price is lower than the pharmacy retail price or in countries with “reference price systems” like Germany the “reference price” for many products paid by the Social Insurance is lower than the Pharmacy Retail Price.
Hospital prices
This is the price paid by hospitals to wholesalers.
Table 1. Purchasing Power Parity for general services and pharmaceuticals (OECD 1996)
PPP PPP
general goods
& services pharmaceuticals
USA (Comparator) 100 100
Greece 89 54
Portugal 80 81
France 128 84
Germany 135 165
goods across a free European market. But for public health purposes, the emphasis might be different.
What Medicines and Preparations to compare: a major problem is what medicines or
basket of medicines we can examine across Europe. Ideally we should look at the costs of the same preparation in different countries but such common preparations are relatively rare. At the level of the drug, only 7% were available across all EU-15 countries [10]. At the level of individual preparations of medicines, this was even lower [11]. As an illustration of the importance of this, the differences in price per DDD from different brands and packages of simvastatin in Finland and the Netherlands are shown in Figure 1: the range in price per DDD ranges in both countries by a factor of 0,6 or more. Finland with greater competition has lower prices than the Netherlands.There are also differences in licensed indication and dose [12]. This risks ignoring the generic market which is very important in many European countries. Some suggest that this variation in availability is a deliberate attempt by manufacturers to limit parallel importing and exporting, and to avoid price comparisons.
Methods
Our first step therefore was to undertake an inventory of what data on prices was available, through the EuroMedStat network. We also established a working group to address a range of
topics including considerations of price and utilisation. Their remit was to produce practical recommendations based on what was theoretically as sound as possible but also on what was possible given the availability of data.
Results
The data readily available are shown in Table 2.Ex-factory prices were not readily available.Wholesale prices were available in 10 of the 15 countries.The pharmacy retail price was available in all, although its exact meaning varied from country to country:in four countries (Sweden, UK,Austria, Ireland) no VAT was payable but in all others it was part of the price at rates varying from 4-25%. In most countries, a dispensing fee was payable in addition to the retail price, but in Norway and Italy this was included in the price. In all cases, the state did not repay the full pharmacy retail price, either because of copayments or because of required discounts from the pharmacies.
Hospital prices were available in only one country. In most countries, each hospital or consortium of hospitals negotiates its own price and discounts from wholesalers or manufacturers in confidence; there is therefore no single or publicly available price.
Recommendations
It was quickly clear that there is no ideal way of measuring prices and no ideal price indicator.
Table 2. Number of data sources of pharmaceutical prices at different points in the distribution chain across European Union Member States and Norway in 2002
Hospital prices Out-of-hospital prices
Ex-factory prices Wholesale prices Pharmacy retail prices
Austria –– - - 2*
Belgium –– –– –– 4
Denmark –– –– 2 3
Finland –– –– 1 2
France –– 1 1 2
Germany –– –– –– 3
Greece 1 –– 1 2
Ireland –– –– 1 2***
Italy –– 1 –– 5
Netherlands –– 4 4 6**
Norway –– 1 2 2**
Portugal –– –– –– 1
Spain –– –– –– 3
Sweden –– –– 6 6
UK –– –– 2 1
TOTAL 1 7 20 45
Note: * Reimbursement prices – which are different from pharmacy retail prices - are published in the now so called “Erstattungskodex”, which became publicly available in 2005.
**In The Netherlands and Norway, the official pharmacy retail price may be discounted to the patient. In many countries, there are systems of either discounted prices for the state or of “clawback” by the state across the whole payment for the medicines supplied.
Therefore we considered a range of indicators. We stress that these are only indicators which point at potential differences and problems and areas worthy of further exploration across all of the 15 countries considered. They should be used prudently. For example it would be wrong to use these data as a basis for price setting at a national level: for this purpose, more robust bilateral comparisons would be more appropriate comparing the index country with other individual countries where specific similar products are available.
Although our comparisons are best at evaluating use of a single medicine (Anatomic Therapeutic Chemical (ATC) level 5), they could also be used with some caution to evaluate the market in a whole area if the medicines were clinically very similar (ATC level 4). Likewise, they are best at evaluating a single market but could (again with caution) be used to compare markets across different countries.
Price:we preferred the Pharmacy Retail Price as the key measure, because of its transparency and availability, because it is closest to the final price paid by the patient or third payer and because it takes in account industry and distribution margins (wholesale and pharmacy) and taxation. However the user must be aware of the differences in price composition (see Figure 2).
We concluded therefore that it is not possible to study hospital prices across Europe at present time. Denominator and packaging: price has to have a denominator of utilisation. The possibilities are
price per kilogram (or other weight), per package, per tablet, or per defined daily dose.To link to our planned measure of utilisation, we considered that it was most appropriate to look at price per DDD.
The price per DDD may vary from manufacturer to manufacturer and may depend on pack size and dose (larger pack sizes, and higher doses, are
typically less expensive per DDD), and
formulation.The formulation should be that most widely used internationally, usually tablet or capsule. The pack size and dose studied is therefore an arbitrary decision. We felt that the most appropriate was that it should be based on the package containing the usual maintenance dose for a 28-day period of those medicines used in chronic illness. For shorter term therapy, e.g. antibiotics, the duration of a course should be considered and an appropriate interval specified. The price should be expressed as E/DDD.
For example, for simvastatin (DDD 15mg) the pack size studied for price comparisons should be 20mg for 28 days, reflecting commonly used doses [13]. For atorvastatin (DDD 10mg), the pack size would be 10 mg for 28 days.
Another alternative is to use the pack/dose most commonly used in a given country.This will allow a better comparison of expenditure per DDD but would limit international comparison.
Indicators
Where there was more than one product available of a particular medicine, the price per
Figure 2. Composition of pharmacy retail prices of medicines in the EU-15 Member States and Norway in 1999
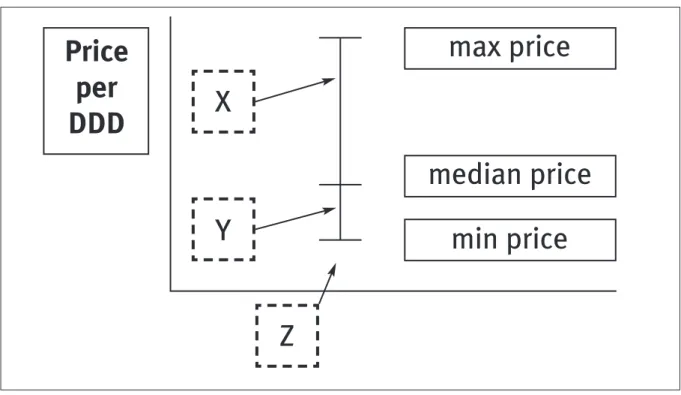
DDD should be expressed as a maximum or minimum for packs of that size within one country. Where utilisation data are available also, the price of the most commonly used preparation (the “median” price per DDD) can also be displayed (Figure 3). The closer the “median” is to the lower boundary the more efficient the prescribing.
We can also use average expenditureper DDD to evaluate the efficiency of each national market. A country where the total average expenditure per DDD on that drug (or possibly that class of drugs) is at the upper end of the distribution of price/DDD (market point X) could improve the efficiency of its prescribing. A country where expenditure per DDD is at market point Y has only a limited margin for further improvement of the efficiency.
If a country’s expenditure/DDD is outside the range, e.g. point Z, then there is a technical problem and the pack size studied needs reconsideration.
Our key indicators therefore are as follows, with a brief appraisal of their strengths and weaknesses.
1. Price per Daily Defined Dose (DDD): price
of the pack in E/Number of DDDs in the pack.
This would allow countries to compare the prices of different brands of one drug within that market or internationally, to compare their pharmaceutical prices with those of other countries Possible benchmarks would be the lowest national value; or the lowest price within those EU Member States where the active ingredient is licensed.
Weaknesses: like-to-like comparisons between
similar packs (same strength and size) are confined to a low number of presentations and of countries because of the wide differences between member states in licensed packs. A possible bias is that the price per DDD may depend on pack size and dose (larger pack sizes, and higher doses, are typically less expensive per DDD).
The indicator can be calculated only for the products with an official DDD.
Current use: this indicator is commonly used
in several governmental database.
2. Ratio of highest to lowest price: highest
price per DDD/Lowest price per DDD X 100 This aims to quantify the price differentials (within a country or between countries) to buy a same active ingredient.The value 100 means that all the licensed packages have the same price per DDD.
Weaknesses: the price per DDD may depend
on pack size and dose (larger pack sizes, and higher doses, are typically less expensive per DDD), and not just on the brand or generic. Other weaknesses as for price.
Current uses: this indicator has been originally
developed by the EURO-MED-STAT project.
3. Expenditure per DDD Average expenditure per DDD [Σ(price per DDD
product1 X number of DDDs product1) +…(price/DDD productn X number of DDDs productn)/ ΣDDDs
all products].
Different brands (including generics) of a same active ingredient or of a same combination of
Figure 3. Representation of prices of a given medicines available in more than one brand/generic in one country. X, Y, and Z are possible average expenditures per DDD. See text for explanation
Price
per
DDD
max price
median price
min price
X
Y
active ingredients can have different price per DDD. The Expenditure per DDD is a utilisation based indicator is the money paid by each country for one DDD of a specific active ingredient across all brands.
Weaknesses: as for price /DDD but also
requires availability of information on utilisation of all products of a particular medicine
Current use: this indicator has been originally
developed by the EURO-MED-STAT project
4. Market Efficiency Index
(Expenditure per DDD) — (Lowest price per DDD)/Lowest price per DDD
The denominator could be either lowest price in that country or across the EU.
The Market Efficiency Index is intended to measure the difference between the actual expenditure per DDD and its lowest price per DDD. The lower the value, the more efficient that market. High values mean that there are important possibilities of cost minimisation, by shifting utilisation from higher to lower price per DDD packages.
Weaknesses: as above.
Current use: this indicator has been originally
developed by the EURO-MED-STAT project.
5. Potential savings [(Expenditure per DDD)
–– (Lowest price per DDD)] x DDDs used over a defined period
This aims to quantify the potential savings that can be obtained shifting utilisation from higher to lower price per DDD packages.The ideal value is 0, i.e. Expenditure per DDD and Lowest Price per DDD are identical and all the possible savings have been realised.
Weaknesses: as above.
Current use: this indicator has been originally
developed by the EURO-MED-STAT project.
Discussion
There is an increasing trend towards pan-European drug registration and regulation. But the issues considered in this paper are matters of national competency rather than European regulation: control of markets, pricing and reimbursement decisions. However greater transparency will make such decisions more rational and defensible.
We believe that the efficiency of prescribing within each country is and will remain a national competency and can be addressed (i.e. given the range of products available within a country, do prescribers tend to use the most efficient products, e.g. generics or other low cost preparations rather than high cost preparations?). Making comparisons in a broader way can be a
valuable indicator of the efficiency of prescribing in each country, and this is the focus of our work rather than direct price comparisons.
Where European power may become important in these areas is that many of these issues are outside the control of even national governments. Prices are set by companies often arbitrarily, based on what they reckon the market will bear and on the possibilities of internal movement of products within the EU market – so prices in drugs in countries with low prices may start to rise so as to avoid parallel importing undermining the prices in the higher price north European markets. Attempts by companies to restrict such trade have generally been rebuffed by the courts.
It is important to consider the coherence of our approach with those of other international price comparisons, and any differences. WHO and others publish the prices of selected essential drugs and a list of their sources [14,15].These use ex-factory or free-on-board prices for large bulk purchases, and before import taxes, mark-ups along the retail chain etc. They are based on manufacturers indicative prices, translated into US $, and are aimed at the large institutional or national buyers, to help them make more efficient purchases. Hence this does not reflect the market in any country or region but only possible purchase prices. There is no link to utilisation or expenditure or to DDD. OECD [16] collects data on expenditure but not on prices.
An Australian report [17] used bilateral comparisons (e.g. Australia to USA, Australia to UK) but with a different product mix in each case. This report stressed that it was not a global comparison, and that it cannot be used to draw comparison for instance between USA and UK. It is closer in nature to the comparisons that a country might use for price setting, and in keeping with this, it used ex-factory prices.
The Canadian Patented Medicine Prices Review
Board (PMPRB, www.pmprb-cepmb.gc.ca)
monitors and regulates the maximum prices charged by manufacturers of patented medicines to ensure that they are not excessive. It compares Canadian prices with other countries in two way comparisons similar to those described for the Australian Productivity Commission.
not paying prices to support research (refuted by others [21]). Pharmaceutical companies try to defend their prices and limit the ability of consumers to purchase their medicines more cheaply on the internet or in Canada or Mexico.
The methods and quality of these studies vary enormously, and the political position of those who conduct them needs to be taken into account. These studies are intended for domestic consumption in a health market alien to those in
most of Europe, and while there are
methodological points of great importance8[8],
their results need to be interpreted with great caution.
Our methods therefore differ from those used by others but this reflects their aims and their context. This work was conducted in 2003-4 and would bear some updating - this is currently underway in a new EU funded project. The data also need extension to the new accession states. Recent studies suggest that at least until recent times, these countries had very good central data a legacy or previous administrations, but these may have weakened in more recent years [22].
Our suggestions need field testing which will certainly change and refine them but in particular will explore the strengths of the data we have available to construct such indicators. Once their robustness has been validated, we believe that such indicators will make a valuable contribution to improving prescribing, its effectiveness and its efficiency across Europe. This testing is part of a further EU funded project now underway.
Acknowledgments
The full list of project participants is available at http://www.euromedstat.cnr.it/project/project_p artecipants.asp.
Funding
This work has been funded by the European Commission. The funding source has had no role in the design, data collection data analysis interpretation or writing of this report.
References
1) WHO Collaborating Centre for Drug Statistics Methodology. ATC Index with DDDs 2000. Oslo:World Health Organisation, 2000.
2) Walley T, Folino-Gallo P, Schwabe U,Van Ganse E, Stephens P. Comparison of national administrative and commercial databases to monitor expenditure and costs of statins across Europe. Eur J Clin Pharmacol 2004;60:503-11.
3) Department of Health,ABPI. PPRS: the study into the extent of competition in the supply of branded medicines to the NHS. London: Department of Health, 2002.
4) The EURO-MED-STAT Group. EURO-MED-STAT: monitoring expenditure and utilisation of medicinal products in the European Union countries. A public health approach. Eur J Pub Health 2003;13(3):95-100.
5) Mossialos E, Mrazek M, Walley T editors. Regulating pharmaceuticals in Europe: Striving to improving efficiency, quality and equity while containing costs. London: Open University Press, 2004.
6) Danzon PM, Chao LW. Cross-national price differences for pharmaceuticals: how large, and why? J Health Econ 2000;19:159-95.
7) Danzon PM, Kim JD. International price comparisons for
pharmaceuticals. Measurement and policy issues.
Pharmacoeconomics 1998;14(Suppl 1):115-28.
8) Kanavos P, Mossialos E. International comparisons of health care expenditures: what we know and what we do not know. J Health Serv Res Policy 1999;4:122-6.
9) Stuart B, Brandt N, Briesacher R, et al. Issues in prescription drug coverage, pricing, utilization, and spending: what we know and need to know. Report prepared for US Department of Health and Human Services. February 18, 2000. Available at http://aspe.hhs.gov/health/reports/drugstudy/appa.htm. 10) Folino-Gallo P, Walley T, Frölich JC, Carvajal A, Edwards IR. Availability of medicines in the European Union: results from the EURO-Medicines project. Eur J Clin Pharmacol 2001;7:441-6. 11) Sainz M, Carvajal A, Folino Gallo P, Garcia del Pozo J, Grupo de Investigacion Euro-Med-Stat. Availability of drugs in the European Union. The case of antiplatelet agents. Med Clin (Barc) 2003;120(20):793-4.
12) Folino-Gallo P, Palzo F, Stiparo G, De Fillippis S, Martelletti P. Price differentials of oral triptans in eight European countries. J. Headache Pain 2003;4(suppl 1):S67-S69.
13) Walley T, Folino-Gallo P, Stephens P,Van Ganse E, on behalf of the EuroMedStat group.Trends in prescribing and utilisation of statins and other lipid lowering drugs across Europe 1997-2003. Br J Clin Pharmacol 2005;60:543-51.
14) World Health Organisation. Medicines Price Information. Available at: http://www.who.int/medicines/areas/access/ ecofin/en/index.html.
15) Health Action International Europe. Medicines Prices. Available at: http://www.haiweb.org/medicineprices/. 16) OECD. Health data 2005: a comparative analysis of 30 countries. Paris: OECD, 2005.
17) Productivity Commission. International pharmaceutical price differences research report. Canberra:AusInfo, 2001. 18) Prescription Drug Pricing in the 7th Congressional District of Maryland: An International Price Comparison. Prepared for Rep. Elijah E. Cummings, Minority Staff Report, Committee on
Government Reform and Oversight, U.S. House of
Representatives,August 10, 1999.
19) Arkansas Attorney General Mark Prior. Prescriptions drugs are more expensive in Arkansas than in Canada, Europe and Japan. Report prepared for the US Senate, July 2002.
20) Danzon PM, Furukawa MF. Prices and availability of pharmaceuticals: evidence from nine countries. Millwood: Health Affairs Suppl 2003;Web Exclusives:W3-521.Available at: http://content.healthaffairs.org/cgi/content/full/hlthaff.w3.52 1v1/DC1.
21) Light DW, Lexchin J. Foreign free riders and the high price of US medicines. BMJ 2005;331:958-60.