104
Getting better all the time? Selective attrition and
compositional changes in longitudinal and life course
studies
Susanne Kelfve
Aging Research Center, Karolinska Institutet/Stockholm University & Linköping [email protected] University, SwedenStefan Fors
Aging Research Center, Karolinska Institutet/Stockholm University, SwedenCarin Lennartsson
Aging Research Center, Karolinska Institutet/Stockholm University, Sweden(Received April 2015 Revised August 2016) http://dx.doi.org/10.14301/llcs.v8i1.350
Abstract
Longitudinal surveys are valuable tools for investigating health and social outcomes across the life course. In such studies, selective mortality leads to changes in the social composition of the sample, but little is known about how selective survey participation affects the sample composition, in addition to the selective mortality. In the present paper, we followed a Swedish cohort sample over six waves 1968–2011. For each wave we recalculated the distribution of baseline characteristics in the sample among i) the sample still alive and ii) the sample still alive and with complete follow-up. The results show that the majority of the compositional changes in the cohort were modest and driven mainly by mortality. However, for some characteristics, class in particular, the selection was considerable and in addition, was substantially compounded by survey non-participation. We suggest that sample selections should be taken into account when interpreting the results of longitudinal studies, in particular when researching social inequalities.
Keywords
105
Introduction
Longitudinal surveys are valuable tools for studying life course processes. Following individuals over many years provides among other things the opportunity to investigate life-course exposures that impact health and living conditions in later life – a prerequisite for understanding the complex process of aging (Kuh, Cooper, Hardy, Richards & Ben-Shlomo, 2014). However, the usefulness of a longitudinal survey is partly dependent on how well the participants represent the target population and on the completeness of follow-up among the participants. The results might be fallacious if individuals lost to follow-up differ from those who participate throughout the entire survey (Deeg, 2002; Lynn, 2011; Willson, Shuey, & Elder, 2007). While there are now methods developed to handle missing data efficiently, many researchers still resort to complete case analyses and listwise deletion is still the default way of handling missing data in statistical software packages (Bartlett, Carpenter, Tilling & Vansteelandt, 2014).
In this paper we investigate how a longitudinal sample, with 43 years follow-up time, changes over time because of selective mortality and selective survey non-participation.
Selective mortality
By default, life course studies include selection processes. As the people in the sample age, mortality reduces the number of individuals in the sample. However, mortality is selective: not all groups in society have the same chance to survive to high ages. For instance, women tend to live longer than men, a pattern well documented in most part of the world (Barford, Dorling, Smith & Shaw, 2006; Thorslund, Wastesson, Agahi, Lagergren & Parker, 2013). In Sweden, for example, women are expected to live approximately four years longer than men (Vaupel, Zhang, & van Raalte, 2011). Individuals from higher socioeconomic strata live longer than individuals from lower socioeconomic strata. Regardless of the socioeconomic indicator used, people in higher social strata have robust advantages: those with higher education, income, or status or from a higher social class, tend to live longer than those with lower education, income, or status or from a lower social class (Torssander & Erikson, 2010). Civil status has also been associated with mortality differences; married individuals tend to live longer than those who are unmarried (Fors, Lennartsson, & Lundberg, 2011; Lennartsson & Lundberg, 2007; Umberson,
1992). The literature devoted to explaining the mechanisms behind social stratification in mortality is extensive, and hypotheses include poorer living conditions, health behaviours, work conditions, and genes (Ferraro & Shippee, 2009; Mackenbach, 2012; Phelan, Link, & Tehranifar, 2010; Stringhini et al., 2011).
Diversity in mortality risk leads to higher mortality in more vulnerable groups. Thus, in any given population or sample, the distribution of factors such as sex, civil status, health status, and education gradually changes over time, eventually giving rise to a privileged group of individuals that have survived to high ages (Zajacova & Burgard, 2013). If the selective mortality is substantial, it may lead to
‘cohort inversion’, a phenomenon whereby a cohort becomes healthier over time as the most disadvantaged individuals (i.e. those with the poorest health) die. Cohort inversion has substantial implications for health inequality research, as it might lead to the impression that inequality decreases over time, whereas it has in fact increased at the individual level (Ferraro, Shippee, & Schafer, 2009). For example, if mortality is higher among individuals with low education, and we assume this mortality is associated with poor health, then over time, differences in poor health between the groups with high and low education will decrease. However, this does not necessarily mean that health differences diminish over time; the individuals with a lower level of education may still have the same degree of poorer health than those with a higher level of education. The only change is that those with the poorest health have died.
Selective survey participation
106
associations with response rate, partly depending on which age groups are included in the study. In contrast to non-response among people in younger age groups (Fejer et al., 2006; Korkeila et al., 2001), non-response among people 70 years and older is usually related to high age and female sex (Hardie, Bakke, & Mørkve, 2003; Kjøller & Thoning, 2005; Klein et al., 2011). The association between non-response and poor health and mortality is also specific to older age groups (de Souto Barreto, 2012; Kelfve, Thorslund, & Lennartsson, 2013). In longitudinal studies of older people, drop-outs tend to be older, more often cognitively impaired, and to have poorer health than those who remain in the studies (Chatfield, Brayne, & Matthews, 2005). The association between drop-outs and socioeconomic factors has been less clear (Banks, Muriel, & Smith, 2011).
Selection processes in longitudinal studies
To sum up, it has been shown that selective mortality changes the composition in a longitudinal sample over time and that survey non-response is unevenly distributed in the population. But less is known about how these two processes work together over time.
There is an association between non-response and mortality. Both baseline response and non-response in a later wave are associated with increased mortality risk (Ferrie et al., 2009). The question that arises is what implication this has for the composition of a longitudinal sample. Does survey non-participation independently affect sample composition, or are compositional changes in the sample driven mostly by mortality?
In a paper from 2013, Zajacova and Burgards showed how selective mortality changed the composition of baseline characteristics in longitudinal samples, gradually making the samples
‘healthier, wealthier and wiser’. Using only baseline data, they isolated the effect of the selective mortality that occurs in a cohort over time. In the current study, we added selective survey participation to this analysis to ascertain whether the compositional changes in baseline
characteristics that occur in a longitudinal sample because of selective mortality are affected by selective survey participation.
More specifically, we examined changes in the distribution of baseline characteristics over time in an ageing panel sample due to attrition caused by i) mortality and ii) mortality in combination with survey non-participation.
Method
Data
The analyses were based on a sample of 1,132 individual, born 1924 to 1934 and followed up from 1968 to 2011, first in the Swedish level-of-living survey (LNU) and later in The Swedish panel study of living conditions of the oldest old (SWEOLD). The LNU study is a nationally representative longitudinal survey of the Swedish adult population that was initiated in 1968 and is still running. The upper age limit for participation in the LNU study is 75 years. The SWEOLD study was initiated 1992 and includes all individuals previously included in LNU who have passed the age limit of 75 years.
The cohort sample used in the present study has been followed through six waves (LNU1968,
LNU1974, LNU1981, LNU1991, LNU2000/
SWEOLD2002, and SWEOLD2011), from the age of 34 to 44 in 1968 to the age of 77 to 87 in 2011 (table 1). More than 90% participated in the first LNU wave. The response rates in the follow-up waves ranged
between 73.1% (LNU2000) and 84.7%
107
Table 1. Sample characteristics at baseline
Birth year
1924-1934
Age 1968, mean (SD)
39.0 (3.2)
Age span 1968
34-44
Age span 2011
77-87
Women %
49.9
Education beyond
compulsory school (>7
years) %
40.0
Married/cohabitating %
84.8
Social class
Manual workers %
45.0
Non-manual workers %
40.2
Other classes %
14.8
Sample response rates
LNU 1968
90.5
LNU 1974
84.2
LNU 1981
78.8
LNU 1991
74.3
LNU 2000
a73.1
SWEOLD 2002
80.6
SWEOLD 2011
84.7
Total sample size
1132
LNU, The Swedish level-of-living Survey; SWEOLD, The Swedish panel study of living conditions of the oldest old a. Because of the age limit in LNU, part of the sample was not included in LNU 2000. Instead they were included in SWEOLD 2002. There is also an overlap of 67 individuals that were included in both year.
Both LNU and SWEOLD primarily use face-to-face interviews to gather data. The questionnaires used cover a broad range of topics, such as living conditions, family situation, health, health behaviours, and financial resources. One primary goal is to maintain a representative study population, and much effort has been made to achieve high response rates. In SWEOLD, indirect interviews are used when the older person is too frail or cognitively impaired to participate in an interview. Close relatives or health care personnel who know the respondent well are used as informants. For a more thorough description of the LNU and SWEOLD studies, see Fritzell and Lundberg (2007) and Lennartsson et al. (2014).
Baseline characteristics
Information on sex, age, education, and social class were collected from registers in 1967. Level of education was dichotomised into compulsory school
(correspond to ≤ 7 years for this cohort in Sweden)
or above. Social class was measured as the proportion of manual workers, non-manual workers, and other classes (farmers, self-employed people, housewives, and people whose occupations were unclassified) in accordance with the Swedish socioeconomic classification (SEI) (Andersson, Erikson, & Wärneryd, 1981). The SEI is similar to the commonly used Erikson–Goldthorpe–Portocarero (EGP) class scheme (Bihagen, Nermo, & Erikson, 2010; Erikson & Goldthorpe, 1992). Self-reported civil status, analysed as the proportion of the sample who were married or cohabitating, was available for those interviewed at baseline. Register information on civil status from 1968 was used to ascertain the civil status of the baseline non-response group.
Analyses
108
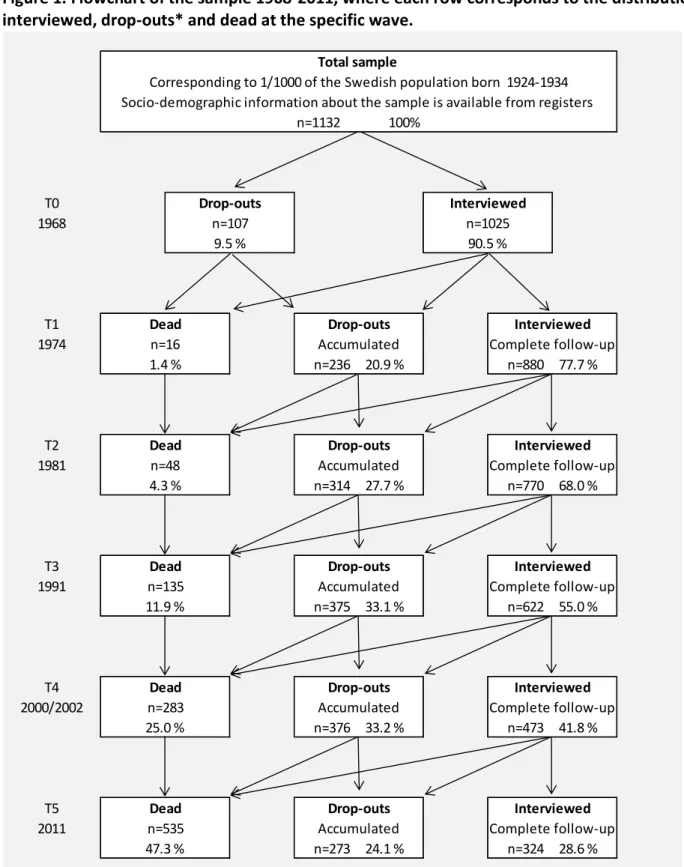
complete follow-up), at each follow-up, as described in the flowchart in Figure 1. For each survey wave, the interviewed groups consisted of all individuals in the sample who responded to each survey up to and including that wave. Accordingly, the drop-outs consisted of all sample members still alive but who, for whatever reason, did not participate in at least one wave, up to and including that wave, i.e. the accumulated non-participation. The final group
109
Figure 1. Flowchart of the sample 1968-2011, where each row corresponds to the distribution
interviewed, drop-outs* and dead at the specific wave.
T0, baseline; T1, first wave; T2, second wave; T3, third wave; T4, fourth wave; T5, fifth wave. *Those who dropped out at any wave were removed from the sample for all waves after drop-out.
The distribution of the baseline characteristics in
the sample was then calculated for each wave. Initially, we describe how the distributions of baseline characteristics in the sample changed only
n=1132 100%
Complete follow-up n=324 28.6 % Accumulated
n=273 24.1 % n=535
47.3 %
Interviewed
Dead
Dead Drop-outs
Drop-outs Drop-outs
Interviewed
n=16 1.4 %
Complete follow-up n=880 77.7 % Accumulated
n=236 20.9 %
Interviewed
n=622 55.0 % Accumulated
n=375 33.1 % Accumulated n=314 27.7 %
Complete follow-up n=770 68.0 %
Interviewed
Dead Drop-outs Interviewed
Dead Drop-outs Interviewed
n=135 11.9 %
Complete follow-up n=473 41.8 % Accumulated
n=376 33.2 % n=283
25.0 %
Complete follow-up T1
1974
T2
Dead Drop-outs
n=48 4.3 %
Socio-demographic information about the sample is available from registers
T5 2011
Total sample
Corresponding to 1/1000 of the Swedish population born 1924-1934
n=107 9.5 %
n=1025 90.5 %
1981
T3 1991
T4 2000/2002
110
as the result of mortality; that is, only those who died at each follow up were removed from the sample. In the next step we also removed the accumulated drop-outs from the sample, describing how the sample would look like if only those with complete follow-up were included in the analyses. None of the characteristics we measured were allowed to vary over time; all characteristics were measured at baseline only. All analyses were stratified by sex. Then we tested the mortality risk for the accumulated drop-out group compared to the interview group with complete follow-up using Cox proportional hazard regression. Mortality was followed from 1st of January each survey year until 31st of December 2014.
Finally, we compared baseline characteristics and mortality risk between responders with complete follow-up, responders with incomplete follow-up, and non-responders, among those still alive at T5.
Results
The solid lines in figures 2 and 3 show how the distribution of baseline characteristics in the sample changed over time as mortality successively reduced the number of individuals in the sample. If mortality had been random rather than selective, the lines would be horizontal. Any slope in the lines indicates that mortality was associated with the characteristic measured. All estimates presented in table 2 and 3 are available in a supplementary table with 95% confidence intervals.
The dotted lines in figures 2 and 3 show the sample after excluding the drop-outs in addition to excluding those that had died. Hence, the dotted line shows the distribution of the baseline characteristics in a sample restricted to individuals with complete data. Any gap between the solid and the dotted lines is an indication that selective survey participation has an additional impact (beyond mortality) on the composition of the longitudinal sample.
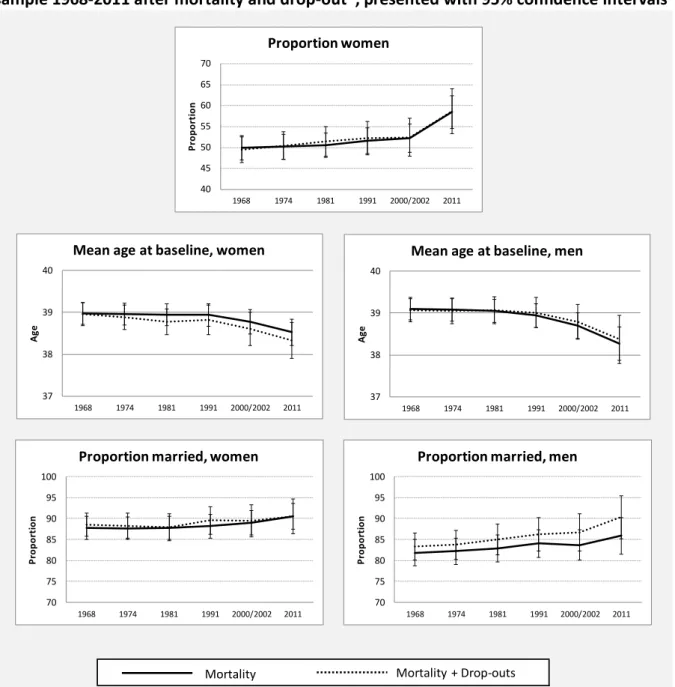
The distributions of demographic characteristics are shown in figure 2. Over time, the proportion of women in the sample increased from 50% to almost 60%. However, the solid line is almost horizontal up to the fourth wave (T4), indicating that the higher mortality among men does not affect the sample in any substantial way before the cohort reaches a higher age (age 57-67). Removing the drop-outs from the sample did not change the pattern; the dotted line is almost identical with the solid line. Hence, selective survey participation did not impact the effect of the selective mortality on the sex distribution in the sample.
Because of higher mortality among the oldest individuals in the sample, the mean baseline age in the sample increased. Higher mortality among the older individuals increased the mean baseline age by a bit less than half a year among women over the 43-year period. When drop-outs were also excluded, the difference increased to more than 0.6 years. Among men, mortality increased the mean baseline age with more than 0.8 years over the follow-up period. In contrast to women, the exclusion of drop-outs did not compound the effect of selective mortality among men.
111
Figure 2. Distribution of demographic characteristics in the 1924-1934 cohort in the LNU/SWEOLD
sample 1968-2011 after mortality and drop-out
*, presented with 95% confidence intervals
LNU, The Swedish level-of-living Survey; SWEOLD, The Swedish panel study of living conditions of the oldest old
*Those who dropped out at any wave were removed from the sample for all waves after drop-out. 40
45 50 55 60 65 70
1968 1974 1981 1991 2000/2002 2011
Pr
op
or
ti
on
Proportion women
70 75 80 85 90 95 100
1968 1974 1981 1991 2000/2002 2011
Pr
op
or
ti
on
Proportion married, women
70 75 80 85 90 95 100
1968 1974 1981 1991 2000/2002 2011
Pr
op
or
ti
on
Proportion married, men
Mortality Mortality + Drop-outs 37
38 39 40
1968 1974 1981 1991 2000/2002 2011
A
ge
Mean age at baseline, women
37 38 39 40
1968 1974 1981 1991 2000/2002 2011
A
ge
112
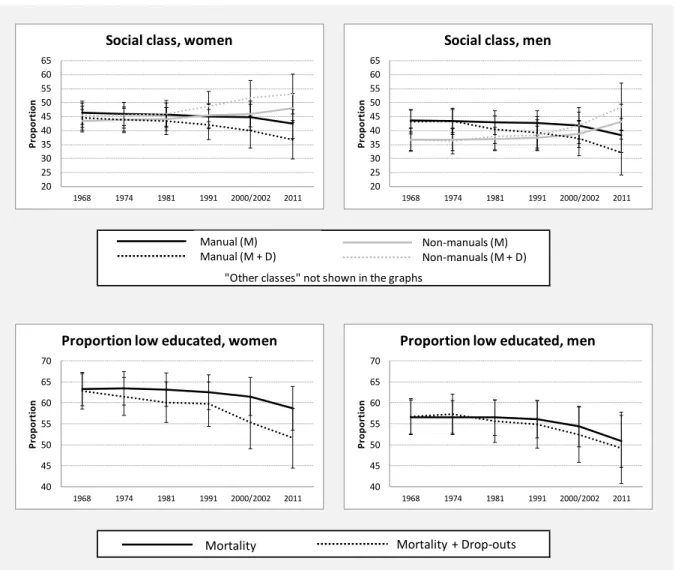
Figure 3. Distribution of socioeconomic characteristics among the 1924-1934 cohort in the
LNU/SWEOLD sample 1968-2011 after mortality and drop-out*,
presented with 95 % confidence
intervals
LNU, The Swedish level-of-living Survey; SWEOLD, The Swedish panel study of living conditions of the oldest old; M, mortality; D, drop-out
*Those who dropped out at any wave were removed from the sample for all waves after drop-out.
The distributions of socioeconomic characteristics are shown in figure 3. Changes in class structure were observed for both women and men. Over time, selective mortality decreased the proportion of manual workers from 46 to 42% among women and from 44 to 38% among men, and the proportion of non-manual workers in the sample increased. However, among both women and men, the changes in class structure were substantially compounded by selective survey non-participation. From the original sample in 1968 to the restricted sample in 2011, the proportion of manual workers decreased with more than 11% units for men and more than 9% units for women. This means that the 2011 sample consisted of a significantly larger proportion non-manual than
manual workers although the original sample had consisted of more manual than non-manual workers. The proportion of individuals from other classes (farmers, self-employed people, housewives, and people whose occupations were unclassified) showed only marginal fluctuation after mortality and survey non-participation were taken into account (not shown). For all survey waves, the proportion of other classes was approximately 20% for men and approximately 10% for women.
Selective mortality also changed the distribution of educational level among both women and men in the sample over time. Because of higher mortality among those with a compulsory school education than those with more than a compulsory school
"Other classes" not shown in the graphs
20 25 30 35 40 45 50 55 60 65
1968 1974 1981 1991 2000/2002 2011
Pr
op
or
ti
on
Social class, women
20 25 30 35 40 45 50 55 60 65
1968 1974 1981 1991 2000/2002 2011
Pr
op
or
ti
on
Social class, men
40 45 50 55 60 65 70
1968 1974 1981 1991 2000/2002 2011
Pr
op
or
ti
on
Proportion low educated, women
40 45 50 55 60 65 70
1968 1974 1981 1991 2000/2002 2011
Pr
op
or
ti
on
Proportion low educated, men Manual (M)
Manual (M + D) Non-manuals (M)Non-manuals (M + D)
113
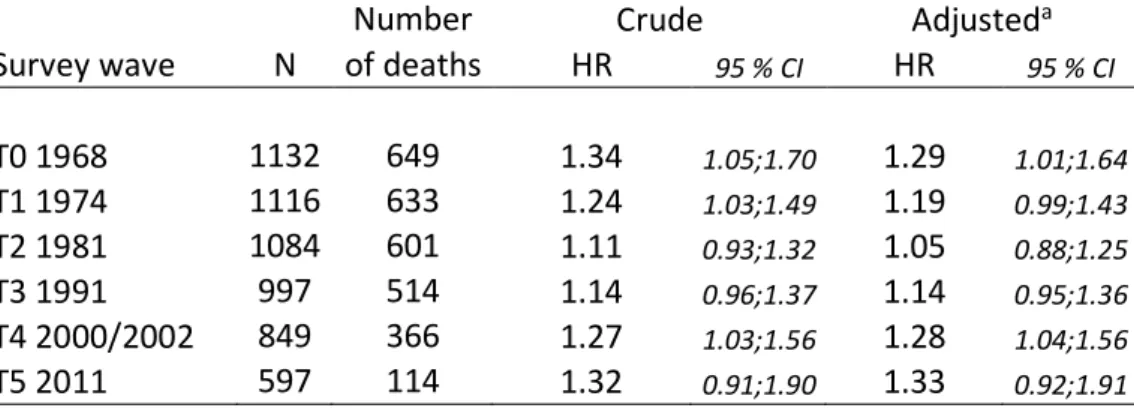
education, the level of education in the sample increased as the proportion of those with more than a compulsory school education increased over time. In women but not men, selective survey participation compounded the changes in education. When the drop-outs were removed from the sample, the proportion women with more than a compulsory education increased with additional 7% units. Table 2 show that the accumulated drop-out group consequently have a higher mortality risk than the interview group with complete follow-up, albeit not statistically significant at all times. Adjustment
for sex and age slightly lowered the estimates for T0, T1, and T2, whilst the estimates for T3 up to T5 did not change after the adjustment.
Finally, table 3 show that at T5, when the people in the sample were between 77 and 87 years old, responders with complete follow-up were in general more educated, more likely to have had a non-manual occupation, and a lower mortality risk than responders with incomplete follow-up and the non-response group. In addition, non-responders were less likely to be women and to be married at baseline compared to responders with complete follow-up.
Table 2. Mortality risk for the accumulated drop-out group compared with the
interview group with complete follow-up. For each survey wave, mortality is
followed until 2014
Number
Crude
Adjusted
aSurvey wave
N of deaths
HR
95 % CIHR
95 % CIT0 1968
1132
649
1.34
1.05;1.701.29
1.01;1.64T1 1974
1116
633
1.24
1.03;1.491.19
0.99;1.43T2 1981
1084
601
1.11
0.93;1.321.05
0.88;1.25T3 1991
997
514
1.14
0.96;1.371.14
0.95;1.36T4 2000/2002
849
366
1.27
1.03;1.561.28
1.04;1.56T5 2011
597
114
1.32
0.91;1.901.33
0.92;1.91aAdjusted for sex and birth year
Table 3. Baseline characteristics and mortality risk (follow-up until 2014) for the sample still
alive at 2011 (T5), by response pattern
Responders
with complete
follow-up
Responders with
incomplete
follow-up
Non-responders
Baseline characteristics
Age 1968, mean
38.3
38.6
38.4
Women %
58.6
61.9
52.4
Education beyond
compulsory school %
49.4
39.9
37.1
Married/cohabitating %
90.4
89.3
81.9
Manual workers %
34.9
45.8
50.5
Non-manual workers %
51.2
43.5
34.3
Mortality risk
aNumber of deaths
55
37
22
Crude HR
(95 % CI)1.00
1.35 (
0.89;2.05)1.26
(0.77;2.08)Adjusted
HR
a(95 % CI)1.00
1.36 (
0.90;2.07)1.27
(0.77;2.08)N
324
168
105
114
Discussion
Summary of results
Using longitudinal data (43 years of follow-up) on individuals born 1924-1934 (age 34-44 at baseline), we found that selective mortality changed the sample by successively increasing the proportion of women, people with non-manual occupations, younger birth cohorts, people with more than a compulsory education, and people who were married at baseline. When drop-outs were also excluded from the analyses, the sample selection found for the demographic variables did not change in any substantial way. After excluding both those who died during follow-up and drop-outs, the greatest change was found in two variables: civil status among men and mean birth year among women. That is, over time, a lower proportion of men who were unmarried at baseline participated than men who were married at baseline, and a lower proportion of women from older birth cohorts participated than women from younger birth cohorts.
The effects of selective mortality on the socioeconomic characteristics of the sample were substantially compounded by the effects of selective survey participation. When we removed both the drop-outs and those who died during follow-up, the sample included substantially more people with non-manual occupations and a higher proportion of people with more than a compulsory education than when we only removed those who had died. Education in men was the only socioeconomic factor for which we did not find a compounding effect of survey non-participation.
Finally, this study shows that individuals with incomplete follow-up have lower mortality risk than individuals with complete follow-up. This implies that analyses restricted to individuals with complete data not only skew the proportion individuals with low socioeconomic position. There is also an imminent risk of underestimate the occurrence of fundamental epidemiological events, such as mortality.
Strengths and limitations
The data from the LNU and SWEOLD surveys provided a unique opportunity to investigate selection processes over time because of the rich information that was available for the total sample group. In 1968, LNU researchers pioneered the linkage of data from different sources when they combined register information with survey data to
empirically study living conditions in Sweden for social policy purposes (Johansson, 1973). As a result, socio-demographic information is available on the total sample, both baseline responders and baseline non-responders. This contrasts with the situation in many other longitudinal studies, in which information on the baseline non-responders is usually limited (Cheshire, Ofstedal, Scholes & Schröder, 2011).The Swedish system, in which each resident is assigned a personal identification number that is used in nationwide registers, was also a prerequisite in this study, as it made it possible to follow mortality over time.
One drawback of the data material, however, is the limited sample size. The sample size is too small to analyse the potential bias introduced by the selections in associational studies. Moreover, a larger sample would also have made it possible to distinguish between temporary non-response (i.e. individuals that come back at a later wave after missing one or more waves) and those who drop-out and never re-appear in the study again. These groups may very well differ in terms of demographics and socioeconomic conditions.
The birth cohort included in the present study had high response rates in both the LNU and SWEOLD studies (between 73 and 91%). It is not clear whether the selective non-participation found in longitudinal studies with relatively high response rates can be assumed to be representative for longitudinal studies with lower response rates. It is possible that the selection processes would be stronger in a study with higher non-response, but it is also possible that the non-response is more selective in LNU and SWEOLD than in a study with lower response rate. Another limitation of this study is that we only investigated selection related to rather stable demographic and socioeconomic characteristics, not selection related to other individual resources, such as health, personality, and cognition. We made this choice because a major strength of our data was the availability of information about demographic and socioeconomic characteristics for the entire sample, not only those interviewed. Hence, we chose to include only factors about which information was available for the total sample.
115
to vary over time ignores any intra-individual changes that could have occurred over time. However, most of the variables in this study could be expected to remain relatively stable over time because they were measured when the sample members were in middle age; for instance, social mobility was low after middle age in these cohorts, especially mobility between manual workers and non-manual workers (Erikson & Åberg, 1987; Sjögren Lindquist, 2006). During follow-up, however, civil status changed for some people in the sample. Our intention, however, was not to measure differences in mortality risk or the likelihood of survey participation that are associated with changes in civil status. Rather, our intention was to investigate how individuals that were not married/cohabitating in middle age were represented in a longitudinal survey over time (married/cohabitating was the predominant civil status in this cohort).
The substantial advantage of the time-invariant design was the isolation of the crude selections and the reduction of influence from confounding factors. Yet, age is still a potentially confounding factor as it is associated with mortality, as well as with social class and education. Individuals born earlier have a greater risk of having a less education and a less privileged social class, in addition to a higher mortality risk. However, as the age range in the sample is limited to 11 years, the confounding effect of age is likely to be limited. In fact, the analyses of differences in mortality between those with complete follow-up and the accumulated drop-out group showed that age and sex had a minor impact on the mortality differences between these groups.
Comparison with other studies
Few studies have explored how selective mortality and survey participation change the social composition of longitudinal samples over time. Our results are in line with the results of Zajacova and Burgard (2013), who also found that selective mortality changes the distribution of basic socio-demographic characteristics over time, making the sample successively contain more women, younger birth cohorts, people with a higher level of education, and a higher proportion of individuals who were married at baseline. Social class was not part of their study.
Zajacova and Burgard (2013) did test whether or not selective survey participation affected their results. In contrast to our results, they did not find any differences in the selections when they added
attrition for other reason than mortality to attrition caused by mortality. Selective survey participation was, however, outside the focus of their study, and they described their findings on attrition for other reason than mortality as preliminary. In addition, as previously noted, they did not include social class in their study – the characteristic in our study that was most influenced by selection.
Another difference between the studies was the follow-up time. Our results are based on longitudinal data from 43 years of follow-up. In Zajacova and
Burgard’s study, the follow-up time was 16 years.
The degree of bias in estimates of health outcomes due to attrition has also been investigated in a UK study of individuals 50 years and older with six years of follow-up (Lacey, Jordan, & Croft, 2013). The result showed that only baseline non-response contributed to the bias; no further selection bias occurred because of non-response in subsequent waves. Although we did not investigate any biasing effect of the selection we found, it is noteworthy that our results suggest that selection becomes stronger over time. It would be of interest to further investigate differences between various longitudinal studies to see whether the compounded selection found in the present study are generalisable to other contexts and studies or are specific to the Swedish context and/or the long follow-up time.
116
selective mortality and selective survey participation.
Consequences of selection
Research suggests that selective attrition in longitudinal surveys may produce biased estimates of factors such as wealth, health, and labour force participation (Michaud, Kapteyn, Smith & Van Soest, 2011); cognition (Weir, Faul, & Langa, 2011); change in cognitive function (Rajan, Leurgans, Weuve, Beck & Evans, 2011); and the association between smoking and cognitive decline (Weuve et al., 2012). On the other hand, some researchers question whether there is a systematic relationship between health and attrition (Carter, Imlach‐Gunasekara,
McKenzie & Blakely, 2012), and several studies have also reported that selective attrition tends to cause only small biasing effects on estimates of longitudinal changes (Carter et al., 2012; Deeg, 2002; Salthouse, 2013).
Although the findings reported in the literature are inconsistent, there are good reasons for examining the potential effects of sample selection in longitudinal studies of old people, as attrition in this group tends to be related to disability and mortality (Deeg, 2002; Radler & Ryff, 2010). We should not assume that non-response among individuals 75 years and older is random, and the mortality rate is far from ignorable and random. When considering the consequences of attrition, it is important to separate attrition that occurs as a result of mortality and attrition for reasons other than mortality. Attrition for reasons other than death (except for emigration) appears only in study samples and does not reflect real changes in the target populations. It might therefore be a greater source of bias than attrition caused by mortality (Brilleman, Pachana, & Dobson, 2010), which produces the same selections that occur in the target populations and thus reflects real changes in those populations.
However, any analytical research, including comparisons of social groups, must include a consideration of whether or not the results have been affected by selective attrition. That is, it is important to examine whether selective mortality has contributed to an underestimation of the problems experienced by disadvantaged groups because those who are worse off are already dead when the outcomes are measured – a ‘healthy survivor’ effect (Murphy et al., 2011).
The results of the present study show that the majority of the compositional changes in the LNU and SWEOLD cohort we examined were rather modest and mostly driven by mortality. However, for some characteristics, class in particular, the selection was not ignorable, and in addition, was substantially compounded by survey non-participation. The substantial changes in social class composition found in our study indicate that selection in longitudinal samples should be of particular concern to researchers in the field of social inequality in health. For example, higher mortality among manual than non-manual workers may lead to greater intra-group changes in the proportion of manual than non-manual workers with poor health. If disadvantaged individuals with poor health are more likely than others to die, and if disadvantaged individuals are more likely to be found among manual workers, health selection will be stronger among the manual workers; i.e., the proportion with poor health will decrease more than among non-manual workers. As a consequence, there will appear to no class-related health inequality or the inequality will appear to decrease over time. Any analysis of health inequality or cumulative advantages should address the issue of selective mortality (Willson et al., 2007), and according to our results, selective survey participation should also be considered.
Implications
Some attrition always occurs in longitudinal surveys. When analysing longitudinal data, it is important to perform sensitivity analyses, to test all possible selections processes (Geneletti, Mason, & Best, 2011; Philipson, Ho, & Henderson, 2008) and, if possible, to use the unbalanced sample (i.e. the sample that also includes those with incomplete follow-up) (Michaud, Kapteyn, Smith & Van Soest, 2011). There are now well-established statistical methods that address missing data in analyses of longitudinal data (Muniz-Terrera & Hardy, 2014; Palmer & Royall, 2010). However, few methods can be assumed to be completely robust to misspecification after selective attrition.
Keeping the attrition low should therefore be of utmost importance to anyone running a longitudinal study. Although the forces behind selective mortality
are outside the researchers’ control, selective survey
117
methods used, to keep sampled individuals in a longitudinal survey, in combination with decisions taken during analyses, partly determine the width of this gap.
Achieving low attrition may be particularly challenging when the sample includes older individuals. In addition to the selective mortality that substantially affects surveys of older people, longitudinal surveys of older people are usually also characterised by attrition related to disability and cognitive impairment (Deeg, 2002; Radler & Ryff, 2010). Thus, conducting surveys among old people is extremely challenging and resource-demanding. It requires fieldwork strategies adjusted to older respondents, such as the use of indirect interviews, the ability to include institutionalised individuals, and the use of different interview modes, such as telephone interviews or postal questionnaires as alternatives to face-to-face interviews. The results of analyses of health-related prevalence rates might otherwise be severely biased (Kelfve et al., 2013; Lundberg & Thorslund, 1996).
Conclusion
Longitudinal surveys are invaluable tools for
studying the aging process. However, results must be interpreted in the light of different selection processes. Selective mortality changes the social composition of a sample over time. Selective survey participation might compound this selection by giving already disadvantaged groups even less representation. In the present study, we found that selection changed the demographic characteristics of our sample in rather modest ways, whilst it changed the socioeconomic characteristics of the sample considerably over time. In addition, the compounded selection that occurred because of survey non-participation substantially affected the distribution of social class and education among women in the sample over time. This might have widespread consequences for research into social inequalities in health.
Selective mortality is unavoidable in an ageing sample. However, other selections might be partly avoided or dealt with by keeping non-response low, allowing individuals to return to the sample, and when possible, using statistical methods that enable the use of incomplete data in analyses; i.e. that can handle respondents with partial non-response.
Acknowledgments
The authors are grateful to Professor Mats Thorslund and PhD Jonas Wastesson for valuable comments on the manuscript and to Kimberly Kane and Helen Long for language editing. This research was supported by the Swedish Research Council for Health, Working Life and Welfare (FORTE), grants 2011-1330 and 2012-0761.
References
Andersson, L-G., Erikson, R., & Wärneryd, B. (1981). Att beskriva den sociala strukturen: utvärdering av 1974 års förslag till socio-ekonomisk indelning [A memo on the 1974 socioeconomic classification].
Statistisk Tidskrift, 19, 113-136.
Banks, J., Muriel, A., & Smith, J. P. (2011). Attrition and health in ageing studies: evidence from ELSA and HRS. Longitudinal and life course studies, 2(2), 101-126. https://doi.org/10.14301/llcs.v2i2.115 Barford, A., Dorling, D., Smith, G. D., & Shaw, M. (2006). Life expectancy: women now on top everywhere.
BMJ, 332(7545), 808. https://doi.org/10.1136/bmj.332.7545.808
Bartlett, J. W., Carpenter, J. R., Tilling, K., & Vansteelandt, S. (2014). Improving upon the efficiency of complete case analysis when covariates are MNAR. Biostatistics, 15(4), 719–730.
https://doi.org/10.1093/biostatistics/kxu023
118
Brilleman, S. L., Pachana, N. A., & Dobson, A. J. (2010). The impact of attrition on the representativeness of cohort studies of older people. BMC medical research methodology, 10, 71.
https://doi.org/10.1186/1471-2288-10-71
Carter, K. N., Imlach‐Gunasekara, F., McKenzie, S. K., & Blakely, T. (2012). Differential loss of participants does not necessarily cause selection bias. Australian and New Zealand journal of public health, 36(3), 218-222. https://doi.org/10.1111/j.1753-6405.2012.00867.x
Chatfield, M. D., Brayne, C. E., & Matthews, F. E. (2005). A systematic literature review of attrition between waves in longitudinal studies in the elderly shows a consistent pattern of dropout between differing studies. Journal of Clinical Epidemiology, 58(1), 13-19. https://doi.org/10.1016/j.jclinepi.2004.05.006 Cheshire, H., Ofstedal, M. B., Scholes, S., & Schröder, M. (2011). A comparison of response rates in the
English Longitudinal Study of Ageing and the Health and Retirement Study. Longitudinal and life course studies, 2(2), 127-144. https://doi.org/10.14301/llcs.v2i2.118
de Souto Barreto, P. (2012). Participation bias in postal surveys among older adults: The role played by self-reported health, physical functional decline and frailty. Archives ofGerontology and Geriatrics, 55(3), 592-598. https://doi.org/10.1016/j.archger.2012.03.008
Deeg, D. J. H. (2002). Attrition in longitudinal population studies: Does it affect the generalizability of the findings? An introduction to the series. Journal of Clinical Epidemiology, 55(3), 213-215.
https://doi.org/10.1016/S0895-4356(01)00472-3
Erikson, R., & Åberg, R. (Eds.). (1987). Welfare in transition: a survey of living conditions in Sweden, 1968-1981. Oxford: Clarendon Press.
Erikson, R., & Goldthorpe, J. H. (Eds.). (1992). The constant flux: A study of class mobility in industrial societies. Oxford: Clarendon Press.
Fejer, R., Hartvigsen, J., Kyvik, O., Jordan, A., Christensen, H. W., & Høilund-Carlsen, P. F. (2006). The Funen Neck and Chest Pain study: analysing non-response bias by using national vital statistic data.
European journal of epidemiology, 21(3), 171-180. https://doi.org/10.1007/s10654-006-0006-x Ferraro, K. F., & Shippee, T. P. (2009). Aging and cumulative inequality: how does inequality get under the
skin? The Gerontologist, 49(3), 333-343. https://doi.org/10.1093/geront/gnp034
Ferraro, K. F., Shippee, T. P., & Schafer, M. H. (2009). Cumulative inequality theory for research on aging and the life course. In V. L. Bengtson, D. Gans, N. M. Putney & M. Silverstein (Eds.), Handbook of theories of aging - 2nd ed. (pp. 413-433). New York: Springer Publishing Company, LLC.
Ferrie, J. E., Kivimäki, M., Singh-Manoux, A., Shortt, A., Martikainen, P., Head, J., Marmot, M., Gimeno, D., De Vogli, R., Elovainio, M., & Shipley, M. J. (2009). Non-response to baseline, non-response to follow-up and mortality in the Whitehall II cohort. International journal of epidemiology, 38, 831-837.
https://doi.org/10.1093/ije/dyp153
Fors, S., Lennartsson, C., & Lundberg, O. (2011). Live long and prosper? Childhood living conditions, marital status, social class in adulthood and mortality during mid-life: a cohort study. Scandinavian journal of public health, 39(2), 179-186. https://doi.org/10.1177/1403494810395823
Fritzell, J., & Lundberg, O. (Eds.). (2007). Health inequalities and welfare resources: continuity and change in Sweden: Bristol: Policy Press.
Galea, S., & Tracy, M. (2007). Participation rates in epidemiologic studies. Annals of epidemiology, 17(9), 643-653. https://doi.org/10.1016/j.annepidem.2007.03.013
Geneletti, S., Mason, A., & Best, N. (2011). Adjusting for selection effects in epidemiologic studies: why
sensitivity analysis is the only “solution”. Epidemiology, 22(1), 36-39.
https://doi.org/10.1097/EDE.0b013e3182003276
Hardie, J. A., Bakke, P. S., & Mørkve, O. (2003). Non-response bias in a postal questionnaire survey on respiratory health in the old and very old. Scandinavian journal of public health, 31(6), 411-417. https://doi.org/10.1177/140349480303100603
119
Kelfve, S., Thorslund,M ., & Lennartsson, C. (2013). Sampling and non-response bias on health-outcomes in surveys of the oldest old. European journal of ageing, 10(3), 237-245.
https://doi.org/10.1007/s10433-013-0275-7
Kjøller, M., & Thoning, H. (2005). Characteristics of non-response in the Danish Health Interview Surveys, 1987–1994. European journal of public health, 15(5), 528-535.
https://doi.org/10.1093/eurpub/cki023
Klein, D. J., Elliott, M. N., Haviland, A. M., Saliba, D., Burkhart, Q., Edwards, C., & Zaslavsky, A. M. (2011). Understanding nonresponse to the 2007 Medicare CAHPS survey. The Gerontologist, 51(6), 843-855. https://doi.org/10.1093/geront/gnr046
Korkeila, K., Suominen, S., Ahvenainen, J., Ojanlatva, A., Rautava, P., Helenius, H., & Koskenvuo, M. (2001). Non-response and related factors in a nation-wide health survey. European journal of epidemiol, 17(11), 991-999. https://doi.org/10.1023/A:1020016922473
Kuh, D., Cooper, R., Hardy, R., Richards, M., & Ben-Shlomo, Y. (Eds.). (2014). A life course approach to healthy ageing. New York: Oxford University Press.
Lacey, R. J., Jordan, K. P., & Croft, P. R. (2013). Does Attrition during Follow-Up of a Population Cohort Study Inevitably Lead to Biased Estimates of Health Status? PLoS one, 8(12), e83948.
https://doi.org/10.1371/journal.pone.0083948
Lennartsson, C., & Lundberg, O. (2007). What’s marital status got to do with it? Gender inequalities in
economic resources, health and functional abilities among older adults. In J. Fritzell & O. Lundberg (Eds.), Health inequalities and welfare resources (pp. 179-198). Bristol: Policy Press.
Lennartsson, C., Agahi, N., Hols-Salén, L., Kelfve, S., Kåreholt, I., Lundberg, O., Parker, M. G., & Thorslund, M. (2014). Data Resource Profile: The Swedish Panel Study of Living Conditions of the Oldest Old (SWEOLD). International journal of epidemiology, 43(3), 731-738.
https://doi.org/10.1093/ije/dyu057
Sjögren Lindquist, G. (2006). Late careers and career exits in Sweden. In H. P. Blossfeld, S. Buchholz & D. Hofäcker (Eds.), Globalization, uncertainty and late careers in society (pp. 211-234). London and New York: Routledge.
Lundberg, O., & Thorslund, M. (1996). Fieldwork and measurement considerations in surveys of the oldest old. Social Indicators Research, 37(2), 165-187. https://doi.org/10.1007/BF00315527
Lynn, P. (2011). A fishy story: the roles of rods and nets in maintaining representative longitudinal survey samples. Longitudinal and Life Course Studies, 2(2), 98-100. http://dx.doi.org/10.14301/llcs.v2i2.117 Mackenbach, J. P. (2012). The persistence of health inequalities in modern welfare states: the explanation of
a paradox. Social science & medicine, 75(4), 761-769. https://doi.org/10.1016/j.socscimed.2012.02.031
Michaud, P.-C., Kapteyn, A, Smith, J. P., & Van Soest, A. (2011). Temporary and permanent unit non-response in follow-up interviews of the Health and Retirement Study. Longitudinal and Life Course Studies, 2(2), 145-169. http://dx.doi.org/10.14301/llcs.v2i2.114
Muniz-Terrera, G., & Hardy, R. (2014). Longitudinal data analysis in studies of healthy ageing. In D. Kuh, R. Cooper, R. Hardy, M. Richards & Y. Ben-Shlomo (Eds.), A life course approach to healthy ageing (pp. 79-90). New York: Oxford University Press.
Murphy, T. E., Han, L., Allore, H. G., Peduzzi, P. N., Gill, T. M., & Lin, H. (2011). Treatment of death in the analysis of longitudinal studies of gerontological outcomes. The Journals of Gerontology Series A: Biological Sciences and Medical Sciences, 66A(1), 109-114. https://doi.org/10.1093/gerona/glq188 Palmer, R.F., & Royall, D.R. (2010). Missing Data? Plan on It! Journal of the American Geriatrics Society,
58(S2), 343-348. https://doi.org/10.1111/j.1532-5415.2010.03053.x
Phelan, J. C., Link, B. G., & Tehranifar, P. (2010). Social Conditions as Fundamental Causes of Health Inequalities. Journal of Health and Social Behavior, 51(1 suppl), S28-S40.
https://doi.org/10.1177/0022146510383498
Philipson, P. M., Ho, W. K., & Henderson, R. (2008). Comparative review of methods for handling drop‐out in
120
Radler, B. T., & Ryff, C. D. (2010). Who participates? Accounting for longitudinal retention in the MIDUS national study of health and well-being. Journal of Aging and Health, 22(3), 307-331.
https://doi.org/10.1177/0898264309358617
Rajan, K. B., Leurgans, S. E., Weuve, J., Beck, T. L., & Evans, D. A. (2011). Effect of Demographic Risk Factors on the Change in Cognitive Function in the Presence of Non-Participation and Truncation due to Death. Journal of biometrics & biostatistics, 3(1), 1-7. https://doi.org/10.4172/2155-6180.S3-001 Salthouse, T. A. (2013). Selectivity of attrition in longitudinal studies of cognitive functioning. The Journals of
Gerontology Series B: Psychological Sciences and Social Sciences, 69(4), 567-574. https://doi.org/10.1093/geronb/gbt046
Stringhini, S., Dugravot, A., Shipley, M., Goldberg, M., Zins, M., Kivimäki, M., Severine, S., & Singh-Manoux, A. (2011). Health behaviours, socioeconomic status, and mortality: further analyses of the British Whitehall II and the French GAZEL prospective cohorts. PLoS medicine, 8(2), e1000419. https://doi.org/10.1371/journal.pmed.1000419
Thorslund, M., Wastesson, J. W., Agahi, N., Lagergren, M., & Parker, M. G. (2013). The rise and fall of
women’s advantage: a comparison of national trends in life expectancy at age 65 years. European
journal of ageing, 10(4), 271-277. https://doi.org/10.1007/s10433-013-0274-8
Torssander, J., & Erikson, R. (2010). Stratification and mortality—A comparison of education, class, status, and income. European Sociological Review, 26(4), 465-474. https://doi.org/10.1093/esr/jcp034 Umberson, D. (1992). Gender, marital status and the social control of health behavior. Social science &
medicine, 34(8), 907-917. https://doi.org/10.1016/0277-9536(92)90259-S
Watson, N., & Wooden, M. (2014). Re-engaging with survey non-respondents: evidence from three
household panels. Journal of the Royal Statistical Society: Series A (Statistics in Society), 177(2), 499-522. https://doi.org/10.1111/rssa.12024
Vaupel, J. W., Zhang, Z., & van Raalte, A. A. (2011). Life expectancy and disparity: an international comparison of life table data. BMJ Open, 1, e000128. https://doi.org/10.1136/bmjopen-2011-000128
Weir, D. R., Faul, J. D., & Langa, K. M. (2011). Proxy interviews and bias in the distribution of cognitive abilities due to non-response in longitudinal studies: a comparison of HRS and ELSA. Longitudinal and Life Course Studies, 2(2), 170-184. https://doi.org/10.14301/llcs.v2i2.116
Weuve, J., Tchetgen, E. J., Glymour, M. M., Beck, T. L., Aggarwal, N. T, Wilson, R. S., Evans, D. A., & Mendes de Leon, C. F. (2012). Accounting for bias due to selective attrition: the example of smoking and cognitive decline. Epidemiology, 23(1), 119-128. https://doi.org/10.1097/EDE.0b013e318230e861 Willson, A. E., Shuey, K. M., & Elder, G. H. (2007). Cumulative advantage processes as mechanisms of
inequality in life course health. American Journal of Sociology, 112(6), 1886-1924. https://doi.org/10.1086/512712