OYSTER REEF ECOLOGY AND RESTORATION: FINDINGS FROM FIELD AND
MESOCOSM STUDIES
Nathan Robert Geraldi
A dissertation submitted to the faculty of the University of North Carolina at Chapel Hill in partial fulfillment for the requirements for the degree of Doctor of Philosophy in the
Department of Marine Sciences
Chapel Hill
2012
Approved by:
Charles Peterson
Stephen Fegley
Michael Piehler
Joel Fodrie
ii
©2012
iii
ABSTRACT
Nathan Geraldi: OYSTER REEF ECOLOGY AND RESTORATION: FINDINGS FROM
FIELD AND MESOCOSM STUDIES
(Under the direction of Charles Peterson)
Habitat degradation and invasive species are two of the most rampant threats to
marine ecosystems worldwide. The causes of degradation include coastal development and
destructive harvesting practices. My thesis focuses on how to best invest resources to restore
lost habitat and the unexpected consequences of shoreline hardening. I examined the efficacy
of a costly and widespread restoration practice of adding juvenile oysters to reefs to enhance
reef restoration. The results from my experimental field manipulations of juvenile oysters at
three oyster sanctuaries throughout the Pamlico Sound indicate that the addition of oysters
does not enhance reef development because natural recruitment of oysters is not limiting and
efforts should focus on deploying substrate to restore oyster reefs. In addition to restoration,
understanding biotic and abiotic interactions in oyster reefs is necessary to understand
population dynamics. I ran multiple mesocosm experiments on food web interactions in
oyster reefs and found that movement and size of mud crabs influence oyster survival. In
addition, natural oyster reefs and shoreline hardening structures were surveyed for native and
iv
shoreline hardening was habitat for nonnative species, this species could mitigate excess
nutrient loading. Results from my research will increase the efficacy of habitat restoration
and increase our understanding of interactions between habitat alteration and invasive
v
ACKNOWLEDGEMENTS
First and foremost I would like to thank my wife, Andrea Anton Gamazo, for her
patience, understanding and ecological knowledge. I would also like to thank my advisor, Dr.
Pete Peterson, and my committee members Drs. Stephen Fegley, Michael Piehler, Joel
Fodrie, and Jon Grabowski, whose insight and advice were vital in the successful completion
of my thesis. Individual chapters would not have been possible without coauthors other than
my committee, Peter Macreadie, Ashley Smyth, and Michael Simpson. The North Carolina
Division of Marine Fisheries provided logistical support for seeding and the assistance of
DMF employees C. Hardy, S. Slade, and C. Calhoon. My research would not have been
possible without the help of other grad students and technicians including, B. VanDusen, M.
Vozzo, L. Brown, L. Dee, W. Rogers, C. Martin, V. Pinkerton, M. McQuillan, L. Dee, T.
Creech, C. Martin C. Bland, J. Meiner, J. Moore, S. Vos and C. Biddle. I thank all the staff at
the Institute of Marine sciences, especially Claude Lewis, for the help along the way. I would
finally like to thank my family and friends for their constant support. This research was
funded by a grant from the Coastal Recreational Fishing Licenses and a NOAA NERRS
vi
TABLE OF CONTENTS
LIST OF TABLES ………..……….……….…...viii
LIST OF FIGURES ...……….……….……….……….…ix
LIST OF APPENDICES……….…..x
INTRODUCTION ...1
Literature Cited ...4
TESTING THE EFFICACY OF A WIDESPREAD HABITAT RESTORATION PRACTICE ADDITION OF JUVENILE OYSTERS FAILS TO ENHANCE OYSTER REEF DEVELOPMENT ...5
Introduction ...5
Methods ...8
Results ...15
Discussion ...18
Literature Cited ...24
RESTRICTING PREY DISPERSAL OVERESTIMATES THE IMPORTANCE OF PREDATION IN CAUSING INDIRECT INTERACTIONS ...29
Introduction ...29
Methods ...32
Results ...40
Discussion ...44
vii
NATURAL SIZE RANGES OFPREDATOR AND PREY DIMINISH CASCADING EFFECTS THROUGH AN INCREASE IN PREY
CANNIBALISM AND INTERFERENCE COMPEITIION ...54
Introduction ...54
Methods ...57
Results ...64
Discussion ...67
Literature Cited ...73
UNEXPECTED CONSEQUENCE OF ARTIFICIAL STRUCTRUES: THE POSITIVE EFFECT OF NON-NATIVE SPECIES ON NITRGEN REMOVAL ...78
Introduction ...78
Methods ...81
Results ...90
Discussion ...93
Literature Cited ...156
TABLES ………..……….………101
FIGURES ……….……….…...106
viii
LIST OF TABLES
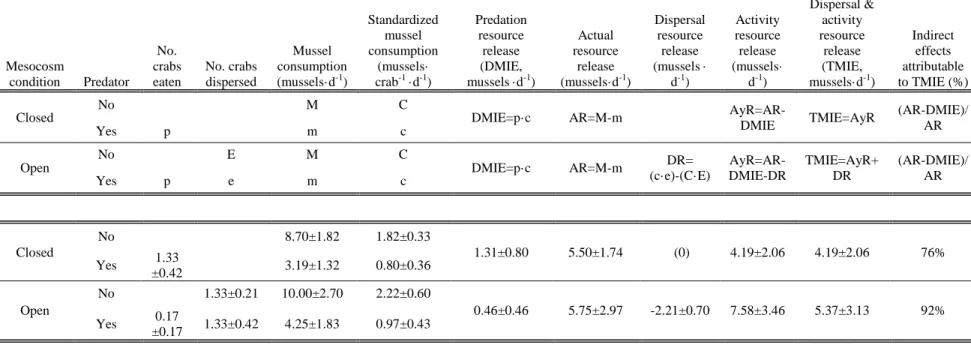
Table 3.1. The variables used to calculate indirect effects ...101
Table 4.1. Size measurements of oysters, mud crabs, and toadfish ...102
Table 5.1. Nutrient fluxes from inflow and outflow of microcosms ...103
Table 5.2. Nitrogen fixation ...104
ix
LIST OF FIGURES
Fig. 2.1. Locations of sampled oyster sanctuaries in Pamlico Sound ...106
Fig. 2.2. Salinities through time at the three sanctuaries ...107
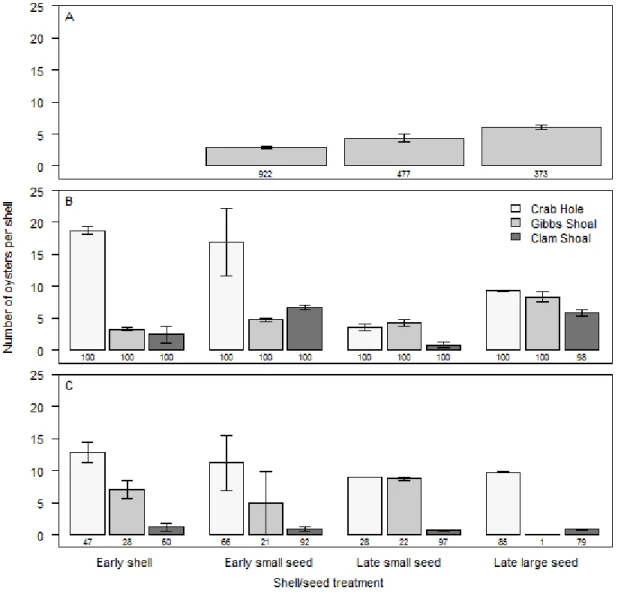
Fig. 2.3. Number of oysters per shell ...108
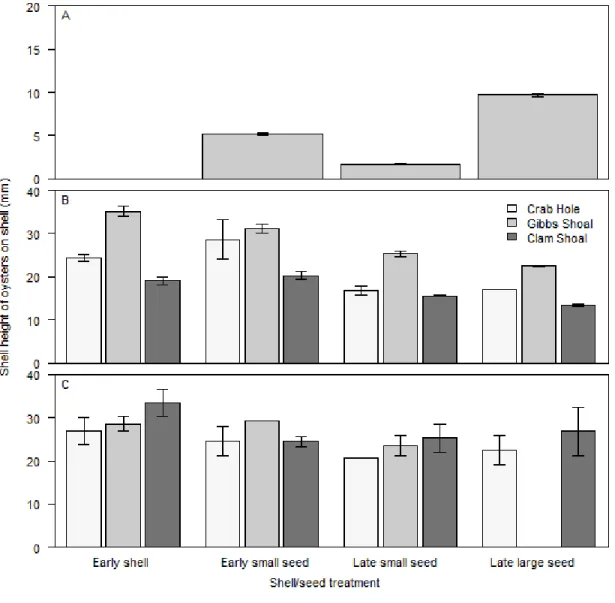
Fig. 2.4. Size of oysters on shells...109
Fig. 2.5. The density of oysters on marl ...110
Fig. 2.6. The density of oysters on NCDMF sampled marl ...111
Fig. 3.1. The experimental setup ...112
Fig. 3.2. Summary of crab (prey) data ...113
Fig. 3.3. Summary of mussel data...114
Fig. 4.1 Crab biomass consumed in treatments ...115
Fig. 4.2. Total number of oysters eaten ...116
Fig. 4.3 Estimated number of oysters that survived...117
Fig. 4.4. Crab biomass consumed ...118
Fig. 4.5. The number of oysters eaten ...119
Fig. 5.1. Locations of sampling sites ...120
Fig 5.2. Percent cover of algae...121
Fig 5.3. The proportion of individuals of Codium ...122
x
LIST OF APPENDICES
Appendix 2.A. The number of oysters per shell ...124
Appendix 2.B. Summary of the number of oysters per shell fit ...125
Appendix 2.C. Summary of the number of oysters per shell ...126
Appendix 2.D. The size of oysters on deployed shell...127
Appendix 2.E. Summary of the size of oysters on deployed shell ...128
Appendix 2.F. The number of oysters on marl ...129
Appendix 2.G. Summary of the number of oysters on marl ...130
Appendix 2.H. Summary of the density of oysters on marl...131
Appendix 2.I. The number of oysters on marl from NCDMF ...132
Appendix 2.J. Summary of the number of oysters from NCDMF...133
Appendix 3.A. Summary of studies using 3 tropic levels...134
Appendix 3.B. Oyster reef habitat ...136
Appendix 3.C. Two-way ANOVA with mesocosm and trial ...137
Appendix 3.D. ANOVA with toadfish, mesocosm, and trial ...138
Appendix 3.E. Two-way ANOVA with toadfish and trial ...139
Appendix 3.F. ANOVA with toadfish, mesocosm, and trial ...140
Appendix 3.G. Two-way ANOVA with toadfish and trial ...141
Appendix 3.H. Two-way MANOVA with toadfishand mesocosm ...142
Appendix 3.I. ANOVA with toadfish, mesocosm, and trial ...143
Appendix 3.J. ANOVA with toadfish, mesocosm, and trial ...144
Appendix 3.K. ANOVA with toadfish, mesocosm, and trial ...145
xi
Appendix 4.B. The variables used to calculate indirect effects ...147
Appendix 4.C. The total number of crabs eaten ...148
Appendix 4.D. The number of crabs eaten ...149
Appendix 5.A. The effect of substrate and season...150
Appendix 5.B. Summary of the results of denitrification rates ...151
Appendix 5.C. Summary of ANOVA on the effects of Codium ...152
Appendix 5.D. Concentration of nutrients ...153
Appendix 5.E. The effect of mixing on denitrification rates ...154
1
INTRODUCTION
Anthropogenic impacts such as global warming and consequent sea-level rise,
overfishing, habitat degradation, introduction of non-native species, and increased
nutrient inputs have accelerated ecological change and are altering the structure and
function of many coastal ecosystems (Vitousek et al. 1997, Lotze et al. 2006, Halpern et
al. 2008). The ability to mitigate and even reverse ecosystem alteration depends on
understanding how these impacts change ecological processes. In my dissertation I use
both applied and basic ecology to understand the effects of anthropogenic changes on
oyster reefs, with the goal of using this knowledge to help restore oyster reefs to historic
abundances.
Oyster reefs are one of the most depleted and degraded marine habitats worldwide
(Beck et al. 2011). To reverse the current trend of oyster reef declines, governmental and
private organizations have invested substantial resources into oyster restoration.
Specifically, North Carolina has established subtidal oyster sanctuaries in the Pamlico
Sound, initiated by creating many large mounds of marl boulders. North Carolina has
seeded sanctuary mounds and harvest areas with hatchery-raised juvenile oysters set on
recycled adult shell to enhance development of oyster reefs. These costly restoration
efforts, which are widely used for the eastern oyster, are carried out despite limited
information on whether seed oysters accelerate reef development and, if so, how oyster
2
mounds at three sanctuaries which were seeded during summer 2010, and varied recycled
shell and seed presence, seed size, and deployment date of shell and seed. Findings from
this study can be used to maximize the resources invested into oyster restoration.
Overfishing on oyster reefs alters the abundance of target species, which are
usually predators, and can change the structure of oyster reef ecosystems (O’Connor et al.
2008). Predators can affect prey populations and, via trophic cascades, indirectly impact
resource populations (2 trophic levels below the predator) through consumption of prey
(density-mediated indirect effects; DMIEs) and by inducing predator-avoidance behavior
in prey (trait-mediated indirect effects; TMIEs). TMIEs are usually calculated based on a
single predator-avoidance response, either dispersal or reduced foraging activity of the
prey, even though prey may employ multiple predator-avoidance behaviors. My third
chapter quantifies direct and indirect predator effects in a mesocosm experiment using an
oyster reef ecosystem consisting of a predator (toadfish – Opsanus tau), prey (mud crab -
Panopeus herbstii) and resource (ribbed mussel – Geukensia demissa). In this chapter, I manipulated the presence and absence of the predator and whether prey could or could
not disperse into a predator-free area, and then calculated the relative importance of
indirect effects based on multiple predator-avoidance responses used by the prey.
Overfishing not only affects species abundance but also the size structure of
populations (Garcia et al. 2012). The size of an organism can change by orders of
magnitude during its lifespan, which can alter whether the individual is a competitor, a
prey, or a predator for other individuals of the same or different species. The effect of
size on intra- and interspecific interactions likely alters trophic cascades through
predator-3
avoidance behavior. In the fourth chapter I measured the effect of prey and predator size
on resource survival by setting up a mesocosm experiment using a tri-trophic food chain
in oyster reefs (predator-toadfish; prey-mud crab; resource-oyster) to measure the effect
of prey and predator size on oyster survival.
One of the biggest threats to ecosystems worldwide is invasive species (Mack et
al. 2000), including oyster reefs. In addition, artificial substrates in areas naturally
devoid of hard substrate might increase the invasive potential of exotic organisms
(Tyrrell and Byers 2007). Although researchers have made strides in understanding and
predicting the effects of anthropogenic impacts, less is known about the potential
interactive effects between human-induced changes. In the fifth chapter I measure the
abundance of native (C. decorticatum) and non-native (C. fragile) Codium species on natural hard substrates (oyster reefs) and artificial substrates (bulkheads and rock
revetments) in North Carolina estuaries and assess the effect of each Codium species on local nitrogen cycling using continuous flow microcosms. Results from this chapter will
increase our knowledge of how multiple anthropogenic impacts can alter ecosystem
4
Literature Cited
Beck, M. W., R. D. Brumbaugh, L. Airoldi, A. Carranza, L. D. Coen, C. Crawford, O. Defeo, G. J. Edgar, B. Hancock, M. C. Kay, H. S. Lenihan, M. W. Luckenbach, C. L. Toropova, G. Zhang, and X. Guo. 2011. Oyster reefs at risk and
recommendations for conservation, restoration, and management. BioScience 61:107–116.
Garcia, S. M., J. Kolding, J. Rice, M.-J. Rochet, S. Zhou, T. Arimoto, J. E. Beyer, L. Borges, A. Bundy, D. Dunn, E. A. Fulton, M. Hall, M. Heino, R. Law, M. Makino, A. D. Rijnsdorp, F. Simard, and A. D. M. Smith. 2012. Reconsidering the consequences of selective fisheries. Science 335:1045–1047.
Halpern, B. S., S. Walbridge, K. A. Selkoe, C. V. Kappel, F. Micheli, C. D’Agrosa, J. F. Bruno, K. S. Casey, C. Ebert, H. E. Fox, R. Fujita, D. Heinemann, H. S. Lenihan, E. M. P. Madin, M. T. Perry, E. R. Selig, M. Spalding, R. Steneck, and R.
Watson. 2008. A global map of human impact on marine ecosystems. Science 319:948–952.
Lotze, H., H. Lenihan, B. Bourque, R. Bradbury, R. Cooke, M. Kay, S. Kidwell, M. Kirby, C. Peterson, and J. Jackson. 2006. Depletion, degradation, and recovery potential of estuaries and coastal seas. Science 312:1806–1809.
Mack, R. N., D. Simberloff, W. M. Lonsdale, H. Evans, M. Clout, and F. A. Bazzaz. 2000. Biotic invasions: causes, epidemiology, global consequences, and control. Ecological Applications 10:689–710.
O’Connor, N. E., J. H. Grabowski, L. M. Ladwig, and J. F. Bruno. 2008. Simulated predator extinctions: predator identity affects survival and recruitment of oysters. Ecology 89:428–438.
Tyrrell, M., and J. Byers. 2007. Do artificial substrates favor nonindigenous fouling species over native species? Journal of Experimental Marine Biology and Ecology 342:54–60.
Vitousek, P. M., J. D. Aber, R. W. Howarth, G. E. Likens, P. A. Matson, D. W.
5
TESTING THE EFFICACY OF A WIDESPREAD HABITAT RESTORATION
PRACTICE: ADDITION OF JUVENILE OYSTERS FAILS TO ENHANCE OYSTER
REEF DEVELOPMENT
Introduction
The extent of historic loss and degradation of biogenic marine habitats caused by
humans is staggering (Lotze et al. 2006). Although remaining threatened habitats may be
maintained through conservation efforts, habitat restoration will be needed to regain lost
habitat and associated ecosystem services. Restoration ecology may become one of the
most important scientific endeavors of this century and is an essential component of
conservation and management (Hobbs et al. 2011). To maximize the benefits of how
limited resources for restoration are utilized, restoration techniques must be based upon
rigorous ecological experimentation (Blankenship and Leber 1995).
Eastern oyster, Crassostrea virginica, populations have been a target of decades of restoration efforts (Brumbaugh and Coen 2009, Kennedy et al. 2011) because only
15% of historic oyster populations persist worldwide (Beck et al. 2011). Unlike other
marine biogenic habitats such as seagrass meadows or coral reefs, oysters are harvested
for human consumption thus increasing risk of degradation and decline. In addition to
supporting a bivalve fishery, oyster reefs also provide other ecosystem services including
enhanced production of fishes, crabs, and shrimps (Lenihan et al. 2001, Peterson et al.
6
Peterson 2007, Coen et al. 2007, Piehler and Smyth 2011). The economic value of
ecosystem services provided by non-harvested reefs is greater than the value of oysters
obtained from harvesting the reefs (Peterson et al. 2003, Grabowski and Peterson 2007,
Coen et al. 2007).
To restore the services provided by lost oyster reefs, governmental and private
organizations have invested substantial resources into oyster restoration, but the
knowledge necessary to maximize the effectiveness of money spent on restoration is
limited. Restoration efforts include providing hard substrate for oyster to grow on such as
oyster shell, clam shell, or marl rip-rap (Lenihan 1999, Coen and Luckenbach 2000,
Mann and Powell 2007). Where oyster recruitment, the number of oysters that settle and
survive to a size that can be visually sampled (approximately 5mm shell height), is
thought to limit oyster reef creation, the new reefs maybe seeded with juvenile oysters.
Seeding consists of spawning oysters in captivity, allowing the larvae to settle on
recycled shell, raising the juvenile oysters in captivity to a size at which it is thought
mortality from predation is reduced and then deploying the seeded shells on natural
substrate or onto constructed reefs. This practice occurs over the entire range of the
eastern oyster (see review by Brumbaugh and Coen 2009) including New Hampshire
(Grizzle et al. 2006), Virginia (Associated Press 2007), Maryland (Rodney and Paynter
2006), Alabama (Wallace et al. 2002), Louisiana (Supan et al. 1999), and North Carolina.
North Carolina has devoted public resources to building multiple oyster hatcheries ($4.3
million for North Carolina in 2008) and deploying seeded shells on harvested areas
(Ortega and Sutherland 1992) and oyster sanctuaries. Remarkably, even though oyster
7
supporting the notion that seeding is necessary to generate or enhance an adult oyster
population.
Seeding newly deployed reefs might be necessary if oyster recruitment is limiting.
Recruitment of oysters may be limiting because adult oysters could be locally extinct or
so depleted that larval supply is low and settlement onto hard substrate does not occur in
densities that result in sufficient recruitment to develop an oyster reef. If settlement is
limiting reef restoration, it may be necessary to restore a network of reefs to ensure
sufficient larval supply to maintain oyster populations because oysters have a 2-3 week
pelagic larval stage (Kennedy et al. 1996) and usually do not recruit to the same reef on
which they were spawned. However, it is difficult to determine whether settlement is
limiting recruitment because settlement varies in space and time (Michener and Kenny
1991, Ortega and Sutherland 1992, Austin et al. 1996). An area that is settlement-limited
one year may not be the next. Devoting resources to deploy seed oysters to create
functional oyster reefs may or may not be necessary for oyster reef restoration depending
on oyster settlement and subsequent recruitment in space and time.
In addition to bottom-up factors limiting recruitment, post-settlement mortality
can also make seeding necessary to restore oyster reefs. High oyster mortality from
predation could result in few oysters reaching maturity (Wallace et al. 2002, Kraeuter et
al. 2003). Shellfish seed survival varies strongly with seed size and date of deployment
(Leber et al. 2005, Peterson et al. 2005) and predation risk and oyster size are negatively
correlated (Newell et al. 2000, Kulp et al. 2011). Predation can vary in time as predators
migrate with season (Brown et al. 2008), recruit to oyster reefs and grow to sizes that
8
(Abbe and Breitburg 1992, Grabowski 2004). Oyster mortality also varies spatially
because of physiological constraints of oyster predators (Wallace et al. 2002). Knowledge
of how seed survival is affected by size at deployment, date of deployment, location of
deployment, and the interaction of these factors is necessary to maximize resources
invested in seed production (Peterson et al. 1995).
In this study we tested the effect of adding seeded recycled shell onto marl
mounds within three different oyster sanctuaries in Pamlico Sound, NC. Specifically,
recycled oyster shell and recycled oyster shell with small seed oysters attached were
deployed in early summer, and shells with two sizes of seed oysters (small and large)
were deployed in mid-summer. Deployed shell and mound surface (marl) were monitored
to determine the effect of seeding on oyster abundance and reef development (abundance
and size of oysters on deployed shell, and oyster density on the surface of the marl
boulders of different treatments over time). To expand our empirical findings in both
space and time, we analyzed survey data from the North Carolina Division of Marine
Fisheries (NCDMF) from three additional sanctuaries seeded in two different years. The
goal of this study was to guide future restoration efforts so that the limited resources
devoted to oyster reef restoration can be maximized by determining if seed oysters are
necessary for oyster restoration and if so, when and at what size the seed oysters should
be deployed to minimize seed mortality.
Methods
9
To test how three combinations of seed size and planting date, plus substrate type
(recycled shell and marl), influence the success of oyster reef development as a function
of location, this experiment was repeated at three NCDMF oyster sanctuaries in Pamlico
Sound, North Carolina (Clam Shoal, Crab Hole and Gibbs Shoal; Fig. 2.1). These sites
were chosen because they span the wide range of salinities that exist in the Pamlico
Sound and because they contained newly created mounds (constructed after Dec. 2009).
Each oyster sanctuary consisted of 50 to 300 mounds of rip-rap marl rock. Each mound
contained approximately 15 tons of marl elevated 3m high with a footprint diameter of
4m. Mounds were created in a uniform grid with mounds separated by approximately 25
m in the diagonal rows. Mean water depths at Clam Shoal, Crab Hole and Gibbs Shoal
were approximately 3.4, 4.0, and 4.3 m, respectively.
Oyster larvae, spawned from 15 oysters collected from the West Bluff oyster
sanctuary in Pamlico Sound, were purchased from Middle Peninsula Aquaculture in
Foster, VA. Substrate for seeding consisted of harvested oysters shells > 7.2 cm shell
height (SH) from the NCDMF recycling program that were thoroughly cleaned by
repeatedly dunking them in seawater and then moved to completely fill 2-bushel plastic
crates (2.5-cm2 openings separated by 1-cm thick plastic on sides and bottom with open
tops). Eighteen crates were placed into large tanks (4.9 x 0.9 x 0.8 m) located on the
NCDMF dock in Morehead City, NC filled with unfiltered seawater from Bogue Sound.
Approximately 2.5 million eyed larvae were added to each tank and fed plankton
provided by the Middle Peninsula Aquaculture twice a day. The larvae were given 3 days
to settle, after which unfiltered seawater was pumped (4.4 l s-1 for each tank) directly
10
weekly at the NCDMF dock using a Sontec YSI and ranged from 21 to 31 psu. One to
three days before deployment, crates were divided into 9 sections (3x3 grid when viewing
the broad side of the crate) and 1-3 shells were haphazardly chosen from each section to
ensure the nine shells were sampled evenly throughout the crate, seed oyster abundance
and size were determined by counting the number of juvenile oysters per shell and
measuring the height of 5 haphazardly chosen spat on each shell.
Larvae were set on shell in two independent additions of eyed larvae on May 25th
and July 5th 2010. Large seed oysters were produced on half the seeded shells from the
May larva, and these shells were kept in separate tanks until the second deployment.
Treatments consisted of: 1) recycled shell deployed in late June 2010, 2) small seed
oysters set on recycled shell (approximately 5 mm SH) deployed in late June 2010, 3)
small seed oysters set on recycled shell (approximately 2 mm SH) deployed in mid
August 2010, 4) large seed oysters set on recycled shell (approximately 10 mm SH)
deployed in mid August 2010, and 5) no shell addition (marl). These treatments will be
referred to as early shell, early small seed, late small seed, late large seed, and marl only,
respectively. Ten mounds at each sanctuary were haphazardly assigned one of five
treatments for a total of two mounds per treatment (two replicates per treatment per
sanctuary). Mounds with shell treatments received 16 bushels of shells (seeded or
unseeded depending on the treatment), which were deployed on the top of the mounds.
The early deployment was achieved by transferring the oyster-filled tanks into a dump
truck and transporting them from Morehead City to boat launches near the sanctuaries,
where they were then delivered to the mounds by boat. Transport in the tanks took no
11
Shoal on June 21, 22 and 23, respectively. For the second deployment, oyster tanks were
transported from their original location on the NCDMF dock to the sanctuaries by barge.
Oysters remained in tanks on the barge deck with a continuous supply of unfiltered
seawater for approximately 10, 20 and, 24 hours as shells were deployed sequentially in
the three sanctuaries. Seeded shell was deployed in Clam Shoal on Aug. 10th and in Gibbs
Shoal and Crab Hole on Aug. 11th. Prior to depositing shell on a mound, divers marked
the center of each mound with a surface buoy attached to a weight. Immediately after
deployment, divers inspected the mounds to ensure shells were on top of the mound and
spread the shell out so that the shell layer was no greater than 5 cm. At Clam Shoal and
Crab Hole, two additional mounds at each sanctuary, created in 2005 and 2006, were
monitored to serve as a baseline for established reefs. Gibbs Shoal was first established as
a sanctuary in 2009 and had no previously constructed mounds. A temperature-salinity
data logger was deployed on the top of one mound at each study sanctuary to measure
environmental conditions. Temperature-salinity data were recorded every 30 minutes
from June 2010 to September 2011, except when loggers malfunctioned (Fig 2.2).
Reef monitoring
To quantify the success of oyster reef development on the reef mounds, we
collected two sets of measurements: abundance and size of oysters on deployed shell, and
oyster density on the surface of the marl boulders. Abundance of seed oysters and their
size frequency were measured on two occasions in fall of 2010 (10/7-10/15) and 2011
(9/8-9/13). Divers searched the mound top for deployed shell and retrieved 50 deployed
shells or as many shells as could be located. Deployed shells could be distinguished from
12
shells were returned to the lab. We recorded the number of oysters on each shell and
measured the shell height of 5 haphazardly chosen oysters on each of the retrieved shells
to obtain a size frequency for each mound.
We quantified the density and size of oysters on the marl mounds in each
sanctuary during three samplings in the fall of 2010 and 2011 (same dates as shell
sampling) and spring of 2011 (5/25-6/3). Divers haphazardly removed 2 marl pieces from
both the top and bottom (<50cm from the base) of the mound and immediately placed the
marl in separate plastic sacks. Care was taken to ensure that oysters remained attached to
the marl or that any oysters that did fall remained in the sack for quantification. Marl
pieces were labeled with location on the mound (top or bottom) and mound type (early
small seed, late small seed, large seed, shell, marl only or old mound) and brought back
to the lab for processing. The surface area of the marl that was exposed on the mound and
available for organisms to occupy was measured by orienting the marl as it was on the
mound (oysters oriented vertically and side of marl with little or no epifauna on the
bottom) and the “bird’s eye view” surface area was estimated by using a 5 cm grid
quadrat held directly over the marl. Oyster size frequency was determined by measuring
50 haphazardly chosen oysters attached to the marl from both top and bottom samples of
each mound. Oysters that recruit on the shells of existing oysters and small oysters can be
difficult to find, especially on the highly complex 3d structure of oysters on the marl. To
ensure accurate counts, three different people counted the number of oysters on each marl
piece. The 3-observer average abundance for each piece of marl was combined with the
13
of harvesting all oysters within a quadrat on the mound because of the difficulty in
removing all oysters from pieces of marl in a defined area.
NC DMF data
To account for temporal variability in oyster recruitment in our study, we
analyzed data from the NCDMF sanctuary program. We only analyzed data from
sanctuaries that had mounds seeded and unseeded within 1 year of the mounds being
built. This criterion was met 4 times. In 2006 South River had 14 mounds built in June
and July and 9 of the mounds were seeded in Aug. Sound River had 8 mounds built in
Mar. 2008 and 7 of the mounds were seeded in June in 2008. In 2008 West Bluff had 5
mounds built in June and July and 3 of them were seeded in Aug. Finally, Ocracoke had
14 mounds built in Sept. 2006 and 6 of these mounds were seeded in Aug. 2007. In these
instances seed production and deployment were similar to methods described above,
except approximately 20 bushels (instead of the 16) were added to each mound after seed
reached approximately 1 cm SH. These sanctuaries were sampled throughout the year,
once a year starting in 2007, with sampling within a sanctuary being completed in less
than one week. NCDMF sampling was similar to our methods, except 3 instead of 2
pieces of marl were collected from the top, middle (half way between the crest and
bottom), and bottom of the mound, for a total of 9 pieces of marl per mound. NCDMF’s
procedure for estimating oyster density (m-2) differed from the method used in our study,
and consisted of estimating surface area of the marl by measuring the length, width, and
height of the marl and used 50% of the calculated surface area to determine the oysters m
-2
. The abundance of oysters on each piece of marl was estimated by taking the sum of the
14 Statistical analysis
Differences in salinity among sites were analyzed using a non-parametric
Kruskal-Wallis test with site as the independent variable. The mean salinity per day (from
measurements taken every 30 min) was used as a replicate and only days that had data
from all sites were used. To determine whether large seed oyster were larger than small
seed oyster before deployment, we ran a non-parametric Kruskal-Wallis test with oyster
seed size as the dependent variable, and treatment (early small, late small, and late large
seed) as the independent variable. Non-parametric tests were necessary because data were
non-normal and had heterogeneous variances. The numbers of oysters on shell or marl
were not normally distributed and heavily skewed towards 0 and a mixed
effects-generalized linear mixed models (GLMM) were used to determine significant effects (R
software, GLMM ADMB package using Laplace approximation). Independent fixed
factors were shell/seed treatment (early shell, early small seed, late small seed, and late
large seed), site, and sampling date. Shell/seed treatment included marl only as a level
(mounds with no shell addition) when running analyses on oyster density on marl.
Sampling date was a fixed factor and not a random factor because including temporal
variation in recruitment was ecologically relevant. Mound was included as a random
factor in all models. Model family (Poisson or Negative binomial) and inclusion of
factors and interactions were chosen based on lowest AIC scores. Model creation started
with treatment factor only and then additional models were created by adding site and
sampling date with and without interactions. The model with the lowest AIC was chosen.
If this model had interactions that were not significant, the highest order interaction was
15
until the best model was found. Model selection was performed separately with the
following dependent variables: number of oysters per shell, oyster density (m-2) on marl,
and oyster density (m-2) on marl from DMF seeded sites. Depth was included as an
additional factor in model selection for number of oysters m-2 on experimental mounds.
Model selection for NCDMF data included an additional fixed factor, year created, and
sampling date was referred to as age of mound. Size of oysters on shells was analyzed
using a general linear model (GLM; R software, glme package with AIC) because it was a continuous variable with homogeneous variance (Bartlett’s test; p > 0.05). Procedures
for model selection were identical to those previously described.
To answer the primary question of the study, which was to determine if seeding
increased oyster abundance, as well as the best model for number of oysters per shell and
oyster density on marl were complex and included 3 independent factors with 3
significant interactions, separate tests were run for each sanctuary with shell/seed
treatment as the independent variable using only data from 1.5 years after shells were
deployed (fall 2012 sampling). The simplified models were run with the same GLMM
procedure as previously described. The significant levels for these additional tests were
adjusted to reduce type I error when running multiple tests (p<0.012; Bonferroni’s
correction).
Results
Salinity was recorded for an average of 194 days at each sanctuary where we
conducted our experiments (Fig. 2.2). All three sites only had 60 days of
16
(mean ±1 SE) of 14.8 ± 0.51, 19.7 ± 0.41, and 21.2 ± 0.64, which were statistically
different (Kruskal-Wallis chi-squared = 57.52, df = 2, p-value < 0.001). The salinity at
the three sanctuaries ranged from 0 to 32 psu, which spans the documented salinity of the
Pamlico Sound (Williams et al. 1973).
The 16 bushels (approximately 560 l) of shell deployed on each mound contained
an average of 32,000 seed oysters. We deployed approximately 588,000 seed oysters to
the Pamlico Sound. On average, late large seed had the highest number of seed oysters
per shell (6.0±0.3, mean±SE), followed by early small seed (4.4±0.6) and late small seed
(2.9±0.2) before deployment (Fig. 2.3A). The size of large and small seed oysters on
recycled adult shell were significantly different immediately before deployment
(Kruskal-Wallis chi-squared = 662.78, df = 2, p-value < 0.001; Fig. 2.4A).
The number of oysters per seeded shell was best described by a negative binomial
model with shell/seed treatment, site, and date sampled as factors (see Appendix 2.A for
all models). As a result of shells being overgrown by oysters and/or moved by wave
action, only one shell originally deployed was found on the late large seed mounds in
Gibbs Shoal during the second sampling, which negated producing a model with all
interactions. The difficulty in finding shells after two summers of growth is evident in the
total number found per two mounds as shown in Fig. 3C. The shells deployed in June
without seed or with small seed had more oysters than the shells deployed in August with
small or large seed (Fig. 2.3, Appendix 2.B). Posthoc comparisons were based on
variables standard errors from the model not overlapping . Crab Hole had more oysters
on shells than the other two sites and these differences were consistent across sampling
17
were run for each sanctuary separately with data from the fall 2011 sampling. In the fall
of 2012 the shell/seed treatment was not significant (p>0.012) when analyses were run
for each site separately (Fig. 2.3C, Appendix 2.C).
The size-frequency of oysters on deployed shell was analyzed using a parametric
model with shell/seed treatment and site as factors (Appendix 2.D). The model would not
run with year as a factor because of the lack of data for late large-seed mounds at Gibbs
Shoal during the second sampling. Shells deployed in June 2010 had larger oysters than
shells deployed later, regardless of seed presence or deployment size of seed (Fig. 2.4C,
Appendix 2.E). Shells deployed at Gibbs Shoal had larger oysters than shells at Clam
Shoal or Crab Hole. There were no significant interactions, but the inclusion of the
interactions improved the model (Appendix 2.D).
The density of oysters on marl was best described by a negative binomial model
with site, depth, and sampling date as factors (Appendix 2.F). The three-way interaction
was not included because it did not significantly change the model and parsimonious
models are preferred (Crawley 2007). Treatment was not included in the model because it
did not explain a significant amount of the variation (Fig. 2.5, Appendix 2.G). Significant
interactions resulted from: more oysters on the top than on the bottom of the mound at
Clam Shoal, the reverse of the pattern at the other sites; oyster density at Gibbs Shoal
increased through time, which was the opposite trend of the other 2 sites (Fig. 2.5); and
bottom marl had more oysters in the first two samplings, but mean oyster density was
similar on the top and bottom of mounds at the final sampling (Fig. 2.5). Although the
interactions prevent conclusions about the main effects the following trends among the
18
Clam Shoal than at the other two sites in the fall after deployment (Fig. 2.5, Appendix
2.G); oyster density at the bottom of the mound was greater than on the top of the mound;
and the third sampling in fall of 2011 had fewer oysters than the samplings in fall of 2010
and spring of 2011. Because of the complexity of the overall model, separate models
were run for each sanctuary at the fall 2011 sampling with shell/seed treatment as a fixed
factor and mound as random factor. There was no difference in shell/seed treatments in
any of the sanctuaries (Fig. 2.5C, Appendix 2.H).
Our analysis of NCDMF data at three additional sanctuaries where mounds were
both seeded and unseeded within 1 year of being created was limited because all four
fixed factors (seeded or not, mound age, site, and year created) could not be included in
one model due to inconstant sampling of mounds each year. The best model included
whether the mound was seeded, mound age, and year of creation as factors (Appendix
2.I). Seeded mounds had a lower density of oysters than unseeded mounts (Appendix 2.J,
Fig. 2.6). Mounds created in 2008 had a higher density of oysters than mounds created in
2006 and the density of oysters increased with mound age.
Discussion
The sanctuaries in this study extended over the entire area of Pamlico Sound and
the temporal scale of results included 3 different years of reef creation. In the fall
following experimental seeding, shells deployed without seed in June had as many
oysters of equal or greater size than any of the shells deployed with seed. Our results
indicate that seeding recently created artificial reefs is neither necessary nor enhances
19
Seeding artificial reefs could have been expected to increase natural recruitment
because oyster larvae are thought to be gregarious settlers (Kennedy et al. 1996).
Laboratory experiments have found that the presence of seed oyster on shell (Hidu and
Haskin 1971, Keck et al. 1971) and presence of chemical cues from adult conspecifics
(Hidu et al. 1978, Turner et al. 1994, Tamburri et al. 2008) increase settlement of larvae.
Although we did not directly measure settlement, natural oyster recruitment
overwhelmed any benefit of seeding. Our results are not consistent with laboratory
findings because the presence of seed oysters did not increase recruitment on shell or on
the mound substrate (marl). Discrepancies between this study and past laboratory
experiments could result from seed oysters not producing a strong enough chemical cue
to attract larvae, or the larvae could have been equally attracted to cues coming from
biofilms on the marl, shell, and shell with seed (Tamburri et al. 1992, 2008).
Oyster recruitment and abundance varied within and among sites. Abundance of
oysters on shell was highest at the low-salinity site, but oyster density was highest on
marl at the high-salinity site. Greater recruitment in higher salinities has been found in
the Pamlico Sound (Ortega and Sutherland 1992), Maryland (Beaven 1954), and the Gulf
of Mexico (Butler 1954). The low recruitment to shell at the high-salinity site compared
to the low-salinity site could have resulted from an earlier settlement pulse at the high
salinity site, with deployment of shell occurring after this pulse. Within sites, recruitment
of oysters was higher at the bottom of the mounds than on the top at the first sampling.
Lenihan (1999) monitored high and low relief oyster reefs and also found higher oyster
recruitment at deeper depths. But 1 year after reef deployment, the density of oysters was
20
time at the low- and high-salinity sites, but increased at the mid-salinity site. This could
indicate that moderate salinities within Pamlico Sound may be the best areas for oyster
restoration with the goal of maximizing oyster densities. However, the average density of
oysters remained above 400 oysters m-2 at all experimental sites, which is greater than the
highest densities found on oyster reef sanctuaries throughout North Carolina and is 40
times higher than the 10 oysters m-2 that has been used as a indicator for a functional reef
(Powers et al. 2009).
Data from NCDMF support our experimental findings that seeding is neither
necessary for nor beneficial to oyster restoration efforts in Pamlico Sound. Results from
these data are not as clear as our experimental study results because of inconsistent
sampling, but conclusions can still be made. At NCDMF-monitored sites, density of
oysters on the marl varied between the 2 years that mounds were created. Seeded mounds
had significantly fewer oysters than unseeded mounds. Addition of seeded shell could
reduce oyster abundance on mounds because added shell is easily dislodged and
redistributed during storm events, and this shell movement can destroy oysters attached
to marl or remove deployed shell from the mound. Shell overgrowth and removal was
evident at the experimental sites by the decreasing number of shells found on the mounds
through time.
In principle, addition of seed oysters could be advantageous for restoration efforts
where oyster recruitment is limiting or mortality is high for recently settled oysters. These
situations would exist if: populations are reduced low enough that gametes released by
adults are not fertilized; habitat is highly degraded (i.e. anoxia) and the existing oyster
21
of recently settled oysters. Although oyster recruitment did vary, recruitment was not
limiting because natural recruitment swamped any effect of seeded shell. Oyster
predators (mud crabs, sheepshead fish, black drum and oyster drills) exist throughout
Pamlico Sound (Chesnut 1955, Rindone and Eggleston 2011, NRG unpub.), but
recruitment seemed to exceed the effect of predators because the density of oysters
remained above 400m-2 regardless of shell/seed treatment. Our results indicate a drastic
decrease in oyster density in high-salinity areas by the last sampling at Clam Shoal and
approximately 3 years after reef creation at Ocracoke. Powers et al. (2009) surveyed a
protected reef near (within 5 km) Clam Shoal in 2002-2003 and found no live oysters.
They attributed the oyster absence to recruitment limitation, but our results and findings
of Ortega and Sutherland (1992) indicate that post-recruitment mortality is probably the
reason for low oyster abundance on the east side of Pamlico Sound. The cause of the high
mortality is presently unknown, but this region had the highest recruitment to marl (Clam
Shoal, approximately 8000 oysters m-2). High recruitment and subsequent high mortality
indicates that this region could be used for transplantation in oyster reef restoration
schemes. Transplantation consists of deploying substrate in high-recruitment areas and
then moving the substrate to an area with lower mortality after recruitment occurs. Such
oyster transplanting is common in many areas and is used to increase oyster harvest and
restore oyster reefs (Powell et al. 1997, Southworth and Mann 1998, Brumbaugh and
Coen 2009, Kennedy et al. 2011).
Beck et al. (2011) estimated that oysters are only 5-10 percent of historic
abundances in North Carolina. However, our findings indicate that extant oyster
22
sufficient to develop oyster reefs on deployed substrate, which confirms historical
observations that oyster recruitment is not limiting south of the Chesapeake Bay (Wallace
1952, Andrews 1954). Ortega and Sutherland (1992) found that recruitment along the
western side of Pamlico Sound seemed to be decreasing from 1988 to 1990, which they
attributed to decreasing oyster populations. Our study two decades later was different
from their finding. Moreover, no-harvest oyster sanctuaries throughout the Pamlico
Sound have remained viable for longer than 10 years (Powers et al. 2009), which would
indicate that recruitment is neither limiting nor decreasing. Determining which factors
contribute to the high recruitment in Pamlico Sound and why recruitment is low in other
areas, such as the Chesapeake Bay (Mann and Powell 2007), is an important step to
facilitate widespread oyster restoration.
To our knowledge, few experimental studies have tested the benefit of seeding
restored oyster reefs, which is unexpected given the widespread use of seed oysters to
restore and maintain oyster populations. One study on whether seed oysters augmented
artificial reefs found 100% mortality of seed oysters from oyster drill predation in Mobile
Bay, AL (Wallace et al. 2002). Although the benefit of seeding for oyster restoration will
vary depending on where and when seeding is used, experiments are needed to determine
if seeding is beneficial to oyster restoration.
Restoring habitats, whether because of widespread degradation or extirpation, is
one of the great challenges of our century (Hobbs and Harris 2001). Management
restoration efforts are usually limited by management schemes that led to the
degradation, the amount of money allocated for restoration and the complexity of
23
whether recruitment is limited before artificially augmenting natural recruitment, a
strategy commonly used to restore other biogenic habitats such as seagrass meadows
(Bell et al. 2008, Orth et al. 2012) and coral reefs (Clark and Edwards 1995, Edwards and
Clark 1998). As habitat restoration efforts increase, restoration techniques need to be
firmly grounded in experimental ecology so that invested resources are maximized based
24
Literature Cited
Abbe, G. R., and D. L. Breitburg. 1992. The influence of oyster toadfish (Opsanus tau) and crabs (Callinectes sapidus and Xanthidae) on survival of oyster (Crassostrea virginica) spat in Chesapeake Bay: does spat protection always work?
Aquaculture 107:21–31.
Andrews, J. D. 1954. Setting of oysters in Virginia. Proceedings of the National Shellfisheries Association 45:38–46.
Associated Press. 2007. Virginia commits $2.1 million to oyster restoration. Chesapeake Bay Journal 3031.
Austin, H. M., D. Evans, and D. S. Haven. 1996. A retrospective time series analysis of oyster, Crassostrea virginica, recruitment (1946-1993). Journal of Shellfish Research 15:565–582.
Beaven, F. G. 1954. Various aspects of oyster seeding in Maryland. Proceedings of the National Shellfisheries Association 45:29–37.
Beck, M. W., R. D. Brumbaugh, L. Airoldi, A. Carranza, L. D. Coen, C. Crawford, O. Defeo, G. J. Edgar, B. Hancock, M. C. Kay, H. S. Lenihan, M. W. Luckenbach, C. L. Toropova, G. Zhang, and X. Guo. 2011. Oyster reefs at risk and
recommendations for conservation, restoration, and management. BioScience 61:107–116.
Bell, S. S., A. Tewfik, M. O. Hall, and M. S. Fonseca. 2008. Evaluation of seagrass planting and monitoring techniques: Implications for assessing restoration success and habitat equivalency. Restoration Ecology 16:407–416.
Blankenship, H. L., and K. M. Leber. 1995. A responsible approach to marine stock enhancement. American Fisheries Society Symposium 15:167–175.
Brown, K., G. George, G. Peterson, B. Thompson, and J. Cowan. 2008. Oyster predation by black drum varies spatially and seasonally. Estuaries and coasts 31:597–604.
Brumbaugh, R., and L. Coen. 2009. Contemporary approaches for small-scale oyster reef restoration to address substrate versus recruitment limitation: a review and
comments relevant for the olympia oyster, Ostrea lurida carpenter 1864. Journal of Shellfish Research 28:147–161.
25
Chesnut, A. F. 1955. The distribution of osyter drills in North Carolina. Proceedings of the National Shellfisheries Association 46:134–139.
Clark, S., and A. Edwards. 1995. Coral transplantation as an aid to reef rehabilitation: Evaluation of a case study in the Maldive Islands. Coral Reefs 14:201–213.
Coen, L. D., R. D. Brumbaugh, D. Bushek, R. Grizzle, M. W. Luckenbach, M. H. Posey, S. P. Powers, and S. G. Tolley. 2007. Ecosystem services related to oyster
restoration. Marine Ecology Progress Series 341:303–307.
Coen, L. D., and M. W. Luckenbach. 2000. Developing success criteria and goals for evaluating oyster reef restoration: Ecological function or resource exploitation? Ecological Engineering 15:323–343.
Crawley, M. J. 2007. The R book. Wiley, Hoboken, N.J.
Edwards, A., and S. Clark. 1998. Coral transplantation: A useful management tool or misguided meddling? Marine Pollution Bulletin 37:474–487.
Grabowski, J. H. 2004. Habitat complexity disrupts predator-prey interactions but not the trophic cascade on oyster reefs. Ecology 85:995–1004.
Grabowski, J. H., and C. Peterson. 2007. Restoring Oyster Reefs to Recover Ecosystem Services. Pages 281–298 Ecosystem Engineers. Academic Press.
Grizzle, R., D. Burdick, J. Greene, H. Abeels, and C. Capone. 2006. Reef structure alternatives for restoration of oyster (Crassostrea virginica) populations in New Hampshire. The New Hampshire Estuaries Project.
Hidu, H., and H. H. Haskin. 1971. Setting of the American oyster related to environmental factors and larval behavior. Proceedings of the National Shellfisheries Association 61:35–50.
Hidu, H., W. G. Valleau, and F. P. Veitch. 1978. Gregarious setting in European and American oysters response to surface chemisty vs. waterborne pheromones. Proceedings of the National Shellfisheries Association 68:11–16.
Hobbs, R. J., L. M. Hallett, P. R. Ehrlich, and H. A. Mooney. 2011. Intervention ecology: applying ecological science in the twenty-first century. BioScience 61:442–450. Hobbs, R. J., and J. A. Harris. 2001. Restoration ecology: repairing the earth’s
ecosystems in the new millennium. Restoration Ecology 9:239–246.
26
Kennedy, V. S., D. L. Breitburg, M. C. Christman, M. W. Luckenbach, K. Paynter, J. Kramer, K. G. Sellner, J. Dew-Baxter, C. Keller, and R. Mann. 2011. Lessons learned from efforts to restore oyster populations in Maryland and Virginia, 1990 to 2007. Journal of Shellfish Research 30:719–731.
Kennedy, V. S., M. S. G. College, R. I. E. Newell, and A. F. Eble. 1996. The eastern oyster : Crassostrea virginica. Maryland Sea Grant College,, College Park, MD.
Kraeuter, J., S. Ford, and W. Canzonier. 2003. Increased biomass yield from Delaware bay oysters (Crassostrea virginica) by alternation of planting season. Journal of Shellfish Research 22:39–49.
Kulp, R. E., V. Politano, H. A. Lane, S. A. Lombardi, and K. T. Paynter. 2011. Predation of juvenile Crassostrea virginica by two species of mud crabs found in the Chesapeake Bay. Journal of Shellfish Research 30:261–266.
Lenihan, H. S. 1999. Physical–biological coupling on oyster reefs: how habitat structure influences individual performance. Ecological Monographs 69:251–275.
Lenihan, H. S., C. H. Peterson, J. E. Byers, J. H. Grabowski, G. W. Thayer, and D. R. Colby. 2001. Cascading of habitat degradation: oyster reefs invaded by refugee fishes escaping stress. Ecological Applications 11:764–782.
Lotze, H., H. Lenihan, B. Bourque, R. Bradbury, R. Cooke, M. Kay, S. Kidwell, M. Kirby, C. Peterson, and J. Jackson. 2006. Depletion, degradation, and recovery potential of estuaries and coastal seas. Science 312:1806–1809.
Mann, R., and E. Powell. 2007. Why oyster restoration goals in the Chesapeake Bay are not and probably cannot be achieved. Journal of Shellfish Research 26:905–917.
McDonald, J. 1982. Divergent life-history patterns in the co-occurring inter-tidal crabs
Panopeus-herbstii and Eurypanopeus-depressus (crustacea, brachyura, xanthidae). Marine Ecology-Progress Series 8:173–180.
Michener, W. K., and P. D. Kenny. 1991. Spatial and temporal patterns of Crassostrea virginica (Gmelin) recruitment: relationship to scale and substratum. Journal of Experimental Marine Biology and Ecology 154:97–121.
Newell, R., G. Alspach, V. Kennedy, and D. Jacobs. 2000. Mortality of newly metamorphosed eastern oysters (Crassostrea virginica) in mesohaline Chesapeake Bay. Marine Biology 136:665–676.
Ortega, S., and J. Sutherland. 1992. Recruitment and growth of the eastern oyster,
27
Orth, R. J., K. A. Moore, S. R. Marion, D. J. Wilcox, and D. B. Parrish. 2012. Seed addition facilitates eelgrass recovery in a coastal bay system. Marine Ecology Progress Series 448:177–195.
Peterson, C., J. Grabowski, and S. Powers. 2003. Estimated enhancement of fish production resulting from restoring oyster reef habitat: quantitative valuation. Marine Ecology-Progress Series 264:249–264.
Peterson, C., H. Summerson, and J. Huber. 1995. Replenishment of hard clam stocks using hatchery seed: Combined importance of bottom type, seed size, planting season, and density. Journal of Shellfish Research 14:293–300.
Piehler, M. F., and A. R. Smyth. 2011. Habitat-specific distinctions in estuarine denitrification affect both ecosystem function and services. Ecosphere 2:art12.
Powell, E., J. Klinck, E. Hofmann, and S. Ford. 1997. Varying the timing of oyster transplant: implications for management from simulation studies. Fisheries Oceanography 6:213–237.
Powers, S. P., C. H. Peterson, J. H. Grabowski, and H. S. Lenihan. 2009. Success of constructed oyster reefs in no-harvest sanctuaries: implications for restoration. Marine Ecology Progress Series 389:159–170.
Rindone, R. R., and D. B. Eggleston. 2011. Predator-prey dynamics between recently established stone crabs (Menippe spp.) and oyster prey (Crassostrea virginica). Journal of Experimental Marine Biology and Ecology 407:216–225.
Rodney, W. S., and K. T. Paynter. 2006. Comparisons of macrofaunal assemblages on restored and non-restored oyster reefs in mesohaline regions of Chesapeake Bay in Maryland. Journal of Experimental Marine Biology and Ecology 335:39–51.
Southworth, M., and R. Mann. 1998. Oyster reef broodstock enhancement in the Great Wicomico River, Virginia. Journal of Shellfish Research 17:1101–1114.
Tamburri, M. N., M. W. Luckenbach, D. L. Breitburg, and S. M. Bonniwell. 2008. Settlement of Crassostrea ariakensis larvae: effects of substrate, biofilms, sediment and adult chemical cues. Journal of Shellfish Research 27:601–608.
Tamburri, M., R. Zimmerfaust, and M. Tamplin. 1992. Natural sources and properties of chemical inducers mediating settlement. Biological Bulletin 183:327–338.
28
Wallace, D. H. 1952. A critique of present biological research on oysters. Proceedings of the Gulf and Caribbean Fisheries Institute 5:132–136.
Wallace, R. K., F. S. Rikard, and J. C. Howe. 2002. Optimum size for planting hatchery produced oyster seed. Final Technical Report MS-AL Sea Grant.
29
RESTRICTING PREY DISPERSAL OVERESTIMATES THE IMPORTANCE OF
PREDATION IN CAUSING INDIRECT INTERACTIONS
Introduction
The importance of predation in community dynamics is exemplified by trophic
cascades (Carpenter and Kitchell 1988, Estes et al. 1998, Pace et al. 1999, Myers et al.
2007). Studies on trophic cascades have usually focused on the indirect effect of
predators that are generated by consumption of prey, but there is a growing number of
studies that have found that behavioral responses of prey to avoid predators are also
important to understanding both direct and indirect effects of predators in food webs
(Schmitz et al. 2004, Preisser et al. 2005, Okuyama and Bolker 2007). For example,
studies of tri-trophic food chains (predator-prey-resource) that include assessment of
behavioral effects have shown that resource persistence is influenced as much by prey
predator-avoidance behaviors (trait-mediated indirect effects; TMIEs) as by predators
consuming prey (density-mediated indirect effects; DMIEs) (Werner and Peacor 2003,
Preisser et al. 2005, Trussell et al. 2006). For instance, in grassy meadows, spiders
feeding on grasshoppers had a similar positive effect on grasses as when non-feeding
spiders were present (Schmitz et al. 1997). Hence, the inclusion of prey behavior in food
web models is an important step towards developing a holistic understanding of
30
TMIEs often result from more than one predator-avoidance behavior in nature
(Wirsing and Ripple 2011). For instance, elk, under the risk of predation by wolves,
increase vigilance time and decrease foraging (Laundré et al. 2001, Childress and Lung
2003), which results in increasing willow heights (Ripple and Beschta 2006, Beschta and
Ripple 2007). In addition, elk can also alter habitat selection in the presence of wolves
and move away from their preferred resource in open grasslands to safer coniferous
forests with lower-quality resources (Creel et al. 2005). Even though animals use multiple
behaviors in response to predators, few studies consider more than one
predator-avoidance behavior, especially when determining the relative importance between TMIEs
and DMIEs (Abrams 2007, Wirsing and Ripple 2011).
Quantifying the relative importance of TMIEs and DMIEs is necessary in order to
include behavior in food chain models that have until recently included only the effects of
consumption. In a recent meta-analysis on the relative importance of prey behavior and
predation in indirect interactions, all 20 examples of studies that measured TMIEs and
DMIEs were conducted in mesocosms (Preisser et al. 2005). Researchers rely on
mesocosm experiments to determine TMIEs and DMIEs because prey mortality and the
consumption of resources by prey must be measured (Schmitz 2005, Okuyama and
Bolker 2007). Generally mesocosm designs limit how prey can respond to predators.
Three different quantified predator avoidance behaviors of prey, in addition to prey
mortality, have been studied; reduced activity, changes in habitat, and immigration, but
only one predator avoidance behavior has been measured at a time (Preisser et al. 2005;
Appendix A). This practice of measuring one predator-avoidance behavior at a time may
31
compared to prey behavior natural settings.
One of the most frequently studied predator avoidance behaviors in indirect effect
studies is reduced prey activity, but studies on prey activity that are conducted in
mesocosms usually restrict the ability of prey to disperse to locations where the threat of
a predator is diminished (Schmitz et al. 1997, 2008, Grabowski 2004, Grabowski and
Kimbro 2005). For instance, the studies that measured the effect of reduced prey activity
on indirect effects in Preisser et al. (2005) had mesocosm boundaries that limited
dispersing prey to distances that we estimate prey could move in less than a minute
(Appendix A). Restricting prey to an area that is small compared to the area that they use
in nature (home range) inhibits the prey’s ability to disperse from predators. The ability
of prey to move away from the threat of predation can depend on the density of predators
and the distance at which prey are able to detect a predator. Even if mesocosm size does
not alter the ability of prey to disperse, mesocosms boundaries can alter detection and
capture of prey (Englund 1997). Furthermore, minor changes in predator-prey
interactions can have major impacts on resources (Preisser et al. 2005). Thus, mesocosm
experiments measuring the effects of predators on prey activity could overestimate
DMIEs because prey are unable to disperse from the threat of predation and mesocosm
boundaries increase predator capture success.
The indirect effect of prey dispersal on the resource has been tested in enclosure
studies in streams (Cooper et al. 1990, Sih and Wooster 1994, Forrester 1994, McIntosh
et al. 1999) and grasslands (Cronin et al. 2004; see review by Preisser et al. 2005). But,
these studies did not assess how resource survival was affected by predator consumption
32
of prey eaten versus the number of prey that dispersed (Preisser and Bolnick 2008,
Orrock et al. 2008). One mesocosm study did estimate the effect of prey dispersal and
reduced activity on algae in streams but did not measure the number of prey eaten by
predators and the relative importance of TMIE and DMIE was not calculated (Diehl et al.
2000).
Our study system consisted of a tri-trophic food chain with toadfish (Opsanus tau; predator), mud crabs (Panopeus herbstii; prey), and ribbed mussels (Geukensia demissa; resource). Past experiments have been conducted with these same species in 1.7 m
diameter mesocosms and found that the relative importance of TMIEs, resulting from
reduced prey activity in the presence of a predator, was much greater than DMIEs
(Grabowski 2004, Grabowski and Kimbro 2005). However, a study on the mobility of the
same species of mud crab found that marked crabs released in the wild were not found
within 5m of the release point after 48h (Stachowicz and Hay 1999). Consequently, we
designed a relatively large-scale experiment that manipulated the presence and absence of
a predator within mesocosms that either prevented or allowed prey, but not a predator, to
disperse out of the mesocosm. The importance of reduced activity of prey, prey dispersal,
and predation of prey were each quantified to assess the indirect effects of the predator on
the resource.
Methods
Calculating indirect effects
Assessments of the importance of prey behavior in ecological processes must
33
al. 2004, Okuyama and Bolker 2007). Our experiment accomplished this by parsing
different indirect effects via counting the numbers of the resource species eaten per day
by prey in the absence (M) and presence (m) of a predator, the daily per-prey
consumption of the resource in absence (C) and presence (c) of a predator, and the
number of prey eaten by a predator (p; Table 1). Following the labeling convention used
by Okuyama and Bolker (2007), capital letters indicate absence of a predator and lower
case letters indicate presence of a predator. The DMIEs were the amount of resources
surviving because of prey mortality (c·p). The actual release (AR) was the difference
between resources consumed by prey in the absence and presence of a predator (M-m).
The activity resource release (AyR), or the amount of resources that were not eaten
because prey reduce activity and foraging in the presence of a predator, was the
difference between the AR and the DMIEs (Grabowski 2004), when dispersal was
prevented. Thus, if the change in the numbers of resources and prey are known, indirect
effects can be estimated (Table 1). We took this construct one step further by calculating
the dispersal resource release (DR), the positive effect of a predator on resource survival
resulting from prey dispersal, by multiplying the per-prey consumption of resources by
the number of prey that dispersed and then subtracting the number of resources not eaten
because of dispersal in the presence (c·e) and absence (C·E) of a predator. The increase
in resource survival resulting from reduced prey activity was then calculated in
mesocosms that allowed prey dispersal (AyR=AR-DR-DMIE; Table 3.1).
Our mesocosm design was based on a combination of past research on prey
dispersal, which has primarily been measured in stream mesocosms (referred to as
34
primarily been conducted in closed mesocosms mimicking marine or terrestrial
environments. Crab movement out of the mesocosm was considered dispersal and not
refuge-seeking behavior because we refer to dispersal as the movement out of a hostile
environment while refuge seeking behavior is hiding within a hostile environment.
Refuge seeking is a reduction in crab activity when crabs hide deeper within the oyster
shell to escape predation (Grabowski and Kimbro 2005).
Experimental Setup
Experiments were conducted in 21 m2 outdoor cement ponds (7 x 3m) at the University of North Carolina’s Institute of Marine Sciences (Morehead City, NC, USA).
Animals were collected by hand or trap in Bogue Sound and held in flow-through tanks
supplied with raw seawater (1 Ls-1). Toadfish were fed chunks of frozen fish and crabs
were fed mussels (> 1 cm shell height) ad libitum every 2 days before experiments started.
The experimental design consisted of 2 crossed factors: predator (present or
absent) and mesocosm design (open - prey could leave the mesocosm or closed - prey
could not leave mesocosm). The 2 mesocosm designs were created by dividing each
cement pond in half with one of 2 alternate sizes of Vexar mesh, one of which allowed
crab dispersal (open – 5 cm mesh) while the other did not (closed – 1 cm mesh).
Depending on the mesh size crabs could move out of the mesocosm (3.5 x 3m) into a
predator-free sanctuary (other side of the cement pond; Fig. 3.1). The sanctuary in the
closed treatment was used as a control to measure mussel mortality not attributable to
35
Oyster habitat was created by adding cleaned adult oyster shells (37.9 L bucket
full of shells) to each mesocosm and sanctuary and spreading it out to cover a 0.56 m2
area. The oyster shells were approximately 15 cm deep. The oyster habitat was placed 0.5
m from the mesh barrier so that oyster habitat in open mesocosms was 1m apart from
oyster habitat in sanctuaries (Fig. 3.1). The size of the oyster habitat and the distance
between patches are commonly found in natural oyster reefs (Eggleston et al. 1998,
Macreadie et al. 2011; Appendix 3.A). Eight oyster shells each had 7 mussels(resource)
attached to them and were haphazardly placed within the oyster habitat. Mussels are
commonly found in interstitial spaces in oyster reefs and are eaten by mud crabs
(Toscano and Griffen 2012). Mussel shell height ranged from 8 to 24 mm (17 ± 0.04, mean ± standard error, n=60). Mussels were placed on the shell 24 hours before the
beginning of the trial and they naturally attached to the oyster shell via their byssal
threads.
Five mud crabs (range=10 - 39 mm carapace width, 26 ± 0.4 mm, n=119) were placed in the oyster habitat in each mesocosm (Fig.3.1). Crab density within the oyster
habitat in mesocosms (8.9 crabs m-2 of oyster habitat) was selected from the lower end of
the natural range of crab density for individuals with 20 - 40 mm carapace widths within intertidal oyster reefs in South Carolina (4 - 20 m-2, McDonald 1982) to reduce
density-dependent movement and interference competition. After crabs had acclimated for 30
min in the mesocosm, a single adult toadfish (range=230 - 320 mm total length, 278 ± 1.0
mm, n=8) was added to the predator-present treatments. Each trial of the experiment
consisted of a single replicate of each of the 4 treatments (predator-present or absent