1
A Mendelian randomization study of metabolite profiles, fasting glucose and type 2 diabetes
Jun Liu1, Jan Bert van Klinken2, Sabina Semiz3,4, Ko Willems van Dijk2,5, Aswin Verhoeven6, Thomas Hankemeier1,7,8, Amy C. Harms7,8, Eric Sijbrands9, Nuala A.
Sheehan10, Cornelia M. van Duijn1,6, Ayşe Demirkan1,5
1
Department of Epidemiology, Erasmus Medical Center, Rotterdam, the Netherlands 2
Department of Human Genetics, Leiden University Medical Center, Leiden, the Netherlands
3
Genetics and Bioengineering Program, Faculty of Engineering and Natural Sciences, International University of Sarajevo, Sarajevo, Bosnia and Herzegovina
4
Department of Biochemistry and Clinical Analysis, Faculty of Pharmacy, University of Sarajevo, Sarajevo, Bosnia and Herzegovina
5
Department of Endocrinology, Leiden University Medical Center, Leiden, the Netherlands
6
Center for Proteomics and Metabolomics, Leiden University Medical Center, Leiden, the Netherlands
7
Division of Analytical Biosciences, Leiden Academic Centre for Drug Research, Leiden University, Leiden, the Netherlands
8
Netherlands Metabolomics Centre, Leiden University, Leiden, the Netherlands 9
Department of Internal Medicine, Section Pharmacology Vascular and Metabolic diseases, Erasmus Medical Center, Rotterdam, The Netherlands
10
Department of Health Sciences, University of Leicester, Leicester, UK
2 Key words
Type 2 diabetes, lipoproteins, causal modeling, metabolism, HDL Cholesterol Corresponding author: Ayşe Demirkan
Tel: +31 6303 65865
3 Abstract
4 Introduction
Type 2 diabetes is a progressive metabolic disease characterized by hyperglycemia, initially as a result of insulin resistance and in later stages also as a result of insulin insufficiency. Type 2 diabetes is also associated with dyslipidemia, including higher circulating concentrations of triglycerides and lower concentrations of high-density lipoprotein (HDL) cholesterol. In addition, several circulating molecules have previously been shown to be dysregulated in type 2 diabetes, including phospholipids, branched-chain amino acids, keto-acid metabolites and other metabolites such as acyl-carnitines (1-3). However, the causal paths between these metabolites and glucose/type 2 diabetes in human remain unclear from observational studies, and require randomized controlled trials that are difficult to conduct.
5
considered. However, false signals may also be due to pleiotropic effects of the chosen genetic variants leading to possibly invalid instrumental variables. As high-throughput analyses techniques improve, the quantification of circulating molecules is becoming ever more detailed and precise. For instance, instead of LDL-cholesterol, HDL-cholesterol and total triglycerides (TG) determined by routine clinical biochemistry, lipoprotein particle size distribution and content as well as tens of biochemical components can now be measured using Nuclear Magnetic Resonance (NMR) spectroscopy and Mass Spectrometry (MS) based approaches (12; 13). These additional measures offer an opportunity to gain novel insight into the pathogenesis of diseases like type 2 diabetes. With the knowledge of genetic determinants of metabolites gained from genome-wide association studies (GWAS) (14-16), one can use MR for causal inference given the specific conditions encoded in Figure 1. In the present study, with the aim of unraveling potentially causal metabolic paths that underlie the observed associations, we used genetic predictors from published metabolite GWAS, guided by pathway-based evidence to select instrumental variables, and performed MR between selected metabolic markers and glucose/type 2 diabetes.
Materials and Methods
Study population
6
measurements of the ERF participants were collected between 2002 and 2006. Venous blood samples were collected after at least eight hours fasting. The detailed description of the ERF study and related measurements were reported previously (17). Type 2 diabetes was defined according to a fasting plasma glucose ≥ 7·0 mmol/L and/or anti-diabetic treatment. The analytical sample included 2,564 non-diabetic and 212 diabetic participants.
Metabolite measurements
7
molecules and 12 amino acids available in up to 2,639 participants) measured in the Center for Proteomics and Metabolomics, Leiden University Medical Center (19; 20); (4) Lipoprotein window-based NMR spectroscopy (NMR-LIPO, 104 lipoprotein particles size sub-fractions comprising of 28 VLDL components, 30 HDL components, 35 LDL components, 5 IDL components and 6 plasma totals, available in up to 2,609 participants) measured in the Center for Proteomics and Metabolomics, Leiden University Medical Center and lipoprotein sub-fraction concentrations were determined by the Bruker algorithm (Bruker BioSpin GmbH, Germany) as detailed in Kettunen et al (16); (5) AbsoluteIDQTM p150 Kit of Biocrates Life Sciences AG (153 molecules comprising of 14 amino acids, 91 phospholipids, 14 sphingolipids, 33 acyl-carnitines and hexose available in up to 989 participants) measured as detailed in publication from Draisma et al (15) and the experiments were carried out at the Metabolomics Platform of the Genome Analysis Center at the Helmholtz Zentrum München, Germany as per the manufacturer’s instructions. The laboratories had no access to phenotype information.
Statistical methods
8
metabolites associated with glucose in the ERF study were taken forward (n = 124) as candidates for MR. In this set of 124 metabolites, we also tested the association with type 2 diabetes using logistic regression.
Mendelian randomization
For each metabolite associated with glucose, we performed two-sample bi-directional MR. The same method on two-sample MR has been performed in the previous MR studies on type 2 diabetes (6; 9; 22). We tested if genetically varying levels of a particular metabolite affect the risk for elevated glucose and type 2 diabetes (we call this the
forward approach) and if genetically increased risk of type 2 diabetes or elevated glucose is associated with circulating levels of a particular metabolite (we call this the backward
9
genetic loci (1 Mbp window) of glucose, type 2 diabetes, insulin and HOMA-IR extracted from previous publications (23; 24; 28) in the forward MR and the genetic loci (1 Mbp window) of the particular metabolite of interest, using the published GWAS information in the backwards MR (see Supplemental Table 1 for list of genetic loci excluded at this stage). We restricted the SNP lists to a set of independent SNPs in low linkage disequilibrium (pairwise R2 < 0.05) for each test (29) based on the genotype data in ERF. SNPs with disproportionate effects in the risk score were excluded to reduce pleiotropy (see Supplemental Table 2 for list of SNPs excluded at this stage). Genetic risk scores comprising > 5 SNPs which explain > 1% of variance in exposure were taken forward. This effort yielded 20 metabolite-glucose/type 2 diabetes sets in the forward
MR and 76 glucose-metabolite sets and 79 type 2 diabetes-metabolite sets in the
backward MR. A false discovery rate (FDR) of 0.05 was used as the significance threshold for the four series (i.e. metabolite-glucose, metabolite-type 2 diabetes, glucose-metabolite and type 2 diabetes-glucose-metabolite series).
Pathway-based sensitivity analysis
10
that affects the exposure, we assumed that the link between the instrumental variable and the exposure was direct and not mediated by the outcome. For the forward approach, we checked the biological link between the locus and the target metabolite and for the
backward approach the link with glucose. As the pathway in the disease type 2 diabetes is complex, we did not check the biological link with type 2 diabetes in the backward
11
for which the instrumental variable assumption can be validated using genetic and biochemical evidence from online databases. We have successfully applied this workflow in earlier studies (19; 36-38). Heemskerk et al gives the best example of the power of our method (37), where we re-analyzed published results of a GWAS on metabolite levels (39) and confirmed the annotation by an in vitro experiment.
Results
Observed associations
Characteristics of the present study population are given in Table 1. Participants with type 2 diabetes were older, tended to be more often male, and more likely to be on lipid-lowering medication. They had higher BMI, WHR, systolic blood pressure, triglycerides, fasting glucose, insulin, HOMA-IR, and lower HDL-cholesterol, adiponectin and LDL-cholesterol.
12
correlated negatively with fasting glucose. We observed negative correlation between glucose and alkyl-acyl and diacyl phosphatidylcholines, mostly of the poly-unsaturated type, lysophosphatidylcholines, mostly of the saturated type and parts of the lipoprotein sub-fractions from LDL and HDL. These lipoprotein sub-fractions particularly consisted of lipid components of extra-large (XL) and large (L) LDL particles, XHDL and L-HDL particles as well as total L-HDL measurements. The second cluster of metabolites which we observed to correlate positively with glucose included several phospholipids; phosphatidylethanolamines, and lysophosphatidylcholines. Amino acids and low-molecular weight compounds also correlated positively with glucose, in addition to lipid side-groups, and triglycerides. Finally, from the lipoprotein sub-fractions, small (S), extra-small (XS), medium (M) and XL-VLDL particles, as well as the total VLDL components, followed by IDL and LDL-triglycerides, XS-LDL to M-LDL particle components, as well as the ApoA1 and triglyceride content of S-HDL particles were correlated positively with fasting glucose in the non-diabetic population.
Mendelian randomization
13
not supported (FDR = 0.17). At the same time, pathway-based sensitivity analysis revealed possibly causal roles for three additional metabolic markers, including S-VLDL-triglycerides (FDR = 0.04), S-HDL-S-VLDL-triglycerides (FDR = 0.04), and plasma-S-VLDL-triglycerides (FDR = 0.04). Table 3 shows the suggested causal effects of metabolites on type 2 diabetes, i.e. XS-VLDL-phospholipids, IDL-phospholipids and plasma-triglycerides. Interestingly, the statistical significance for both XS-VLDL-phospholipids and IDL-phospholipids in the initial results are filtered out after the sensitivity analysis (FDR: XS-VLDL-phospholipids 0.03 vs 0.31; IDL-phospholipids 0.01 vs 0.24), while plasma-triglycerides shift to being borderline significant (FDR = 0.07 vs 0.046). The results from the full lists of performed forward MR tests are given in Supplemental Table 4 and the SNPs included in the all the genetic risk scores are given in Supplemental Table 5.
The significant results of the backward MR are shown in Table 4. We found that genetic predisposition to type 2 diabetes is associated with lower levels of phosphatidylcholine alkyl-acyl 42:5 (FDR = 0.02) and phosphatidylcholine alkyl-acyl 44:4 (FDR = 0.02) and higher levels of alanine (FDR = 0.02). The details of all the tested SNP sets are shown in Supplemental Table 6 and Supplemental Table 7. No possible causal role for glucose was supported. As the genetic risk scores of the glucose explained less than 1% of variance, the backward MR with pathway analysis is not performed. Figure 4 displays the suggested paths discovered by the MR approach after the pathway-based sensitivity analysis. Overall, the associations estimated by MR were in the consistent direction with the observed associations in ERF.
Discussion
14
population and, using MR, we tested if this metabolic profile points to any causal paths involved in glucose level or type 2 diabetes. Combining metabolomics and MR, we detected fourteen candidate causal associations; ten metabolites influencing fasting glucose, one influencing type 2 diabetes and three influenced by type 2 diabetes.
Our initial observational association tests yielded correlation estimates within the expected range of power calculations for the 124 glucose-associated metabolites. To our knowledge, 35 of these metabolites were previously published to be associated with glucose or type 2 diabetes, including 31 concordant and 4 discordant results (Supplemental Table 3) in studies with very limited sample size (40; 41). Our significant results on subfractions of lipoproteins yielded resolution on the established association of dyslipidemia, especially for the HDL subfractions.
15
16
mediate glucose regulation in the pathophysiology of T2DM (43). Suggested mechanisms include (44): (i) Insulin secretion from pancreatic beta cells combating cellular lipid accumulation and lipotoxicity (45), endoplasmic reticulum stress and apoptosis (46; 47); (ii) Insulin-independent glucose uptake by muscle via the AMP-activated protein kinase(48), calcium/calmodulin activated protein kinase(49); (iii) and insulin sensitivity (50). The ILLUMINATE trial (51) demonstrated that in a subgroup of diabetic participants statin treatment led to increased glucose levels, while this effect was not observed in participants treated with combination of statin and CETP-inhibitor torcetrapib, suggesting that CETP inhibition and consequent HDL cholesterol elevation may improve glycemic control in diabetic patients. It is of note that CETP gene is a major determinant of XL-HDL and was included in our MR experiment.
We have detected three associations potentially pointing out an influence of type 2 diabetes over the metabolome. The first two are long chain polyunsaturated alkyl-acyl phosphatidylcholines which are decreased in type 2 diabetes. This is interesting considering our previous report which showed that three shorter chain polyunsaturated alkyl-acyl phosphatidylcholines are increased in type 2 diabetes patients and decreased in patients using the glucose lowering drug metformin (52). The other molecule affected by diabetes was alanine, which is a non-essential amino acid and can be synthesized in the body from pyruvate and branched chain amino acids such as valine, leucine, and isoleucine. Alanine has been previously implicated in glucose response (53). The enzyme alanine aminotransferase (ALT) catalyzes the conversion of alanine to pyruvate and glutamate and high levels of ALT indicate liver damage.
17
18
excluding the known predictors, (2) heterogeneity tests and (3) finally by pathway analysis, we cannot exclude a correlation between the genetic instruments tested, especially for the HDL subfractions, for which the genes coding overlap. Whilst effect alleles were weighted by their original effects estimates from each GWAS (of exposure variables), there was strong overlap in the SNPs used for different lipid subfractions, meaning the genetic instruments were not highly specific to these subfractions.
In conclusion, using MR, the present study provide evidence for potentially causal metabolic paths of glucose homeostasis and type 2 diabetes. Our results indicate that increase of large HDL particles might have decreasing effect on glucose, while increase of small HDL particles have increasing effect, refining earlier MR findings suggesting a possible causal effect of HDL on glucose levels, as well as pointing these particles out as targets for glucose management. We further found evidence that type 2 diabetes may alter levels of alkyl-acyl phosphatidylcholines and alanine which also here can be translated into prevention of disease complications and prognosis.
Author contributions
Designed the study: CMvD and AD. Generated the metabolomics data: AV, ACH and TH. Analyzed the data: JL and JBvK. Explained the results and wrote the manuscript: JL, JBvK, SS, AV, ACH, TH, ES, KWvD, NAS, CMvD, and AD.
Acknowledgements
19
20 References
1. Floegel A, Stefan N, Yu Z, Muhlenbruch K, Drogan D, Joost HG, Fritsche A, Haring HU, Hrabe de Angelis M, Peters A, Roden M, Prehn C, Wang-Sattler R, Illig T, Schulze MB, Adamski J, Boeing H, Pischon T: Identification of serum metabolites associated with risk of type 2 diabetes using a targeted metabolomic approach. Diabetes 2013;62:639-648
2. Kotronen A, Velagapudi VR, Yetukuri L, Westerbacka J, Bergholm R, Ekroos K, Makkonen J, Taskinen MR, Oresic M, Yki-Jarvinen H: Serum saturated fatty acids containing triacylglycerols are better markers of insulin resistance than total serum triacylglycerol concentrations. Diabetologia 2009;52:684-690
3. Roberts LD, Koulman A, Griffin JL: Towards metabolic biomarkers of insulin resistance and type 2 diabetes: progress from the metabolome. Lancet Diabetes Endocrinol 2:65-75
4. Lawlor DA, Harbord RM, Sterne JA, Timpson N, Davey Smith G: Mendelian randomization: using genes as instruments for making causal inferences in epidemiology. Statistics in medicine 2008;27:1133-1163
5. Haase CL, Tybjaerg-Hansen A, Nordestgaard BG, Frikke-Schmidt R: HDL Cholesterol and Risk of Type 2 Diabetes: A Mendelian Randomization Study. Diabetes 2015;64:3328-3333
21
7. De Silva NM, Freathy RM, Palmer TM, Donnelly LA, Luan J, Gaunt T, Langenberg C, Weedon MN, Shields B, Knight BA, Ward KJ, Sandhu MS, Harbord RM, McCarthy MI, Smith GD, Ebrahim S, Hattersley AT, Wareham N, Lawlor DA, Morris AD, Palmer CN, Frayling TM: Mendelian randomization studies do not support a role for raised circulating triglyceride levels influencing type 2 diabetes, glucose levels, or insulin resistance. Diabetes 2011;60:1008-1018
8. Marott SC, Nordestgaard BG, Tybjaerg-Hansen A, Benn M: Components of the Metabolic Syndrome and Risk of Type 2 Diabetes. J Clin Endocrinol Metab 2016;101:3212-3221
9. White J, Swerdlow DI, Preiss D, Fairhurst-Hunter Z, Keating BJ, Asselbergs FW, Sattar N, Humphries SE, Hingorani AD, Holmes MV: Association of Lipid Fractions With Risks for Coronary Artery Disease and Diabetes. JAMA cardiology 2016;1:692-699 10. Andersson C, Lyass A, Larson MG, Robins SJ, Vasan RS: Low-density-lipoprotein cholesterol concentrations and risk of incident diabetes: epidemiological and genetic insights from the Framingham Heart Study. Diabetologia 2015;58:2774-2780
11. Islam M, Jafar TH, Wood AR, De Silva NM, Caulfield M, Chaturvedi N, Frayling TM: Multiple genetic variants explain measurable variance in type 2 diabetes-related traits in Pakistanis. Diabetologia 2012;55:2193-2204
12. Moreno-Gordaliza E vdLS, Demirkan A, van Duijn CM, Kuiper J, Lindenburg PW, Hankemeier T: A novel method for serum lipoprotein profiling using high performance capillary isotachophoresis. Analytica Chimica Acta 944:57-59
22
metabonomics of plasma lipoprotein subclasses: elucidation of metabolic clustering by self-organising maps. NMR Biomed 2007;20:658-672
14. Demirkan A, van Duijn CM, Ugocsai P, Isaacs A, Pramstaller PP, Liebisch G, Wilson JF, Johansson A, Rudan I, Aulchenko YS, Kirichenko AV, Janssens AC, Jansen RC, Gnewuch C, Domingues FS, Pattaro C, Wild SH, Jonasson I, Polasek O, Zorkoltseva IV, Hofman A, Karssen LC, Struchalin M, Floyd J, Igl W, Biloglav Z, Broer L, Pfeufer A, Pichler I, Campbell S, Zaboli G, Kolcic I, Rivadeneira F, Huffman J, Hastie ND, Uitterlinden A, Franke L, Franklin CS, Vitart V, Consortium D, Nelson CP, Preuss M, Consortium CA, Bis JC, O'Donnell CJ, Franceschini N, Consortium C, Witteman JC, Axenovich T, Oostra BA, Meitinger T, Hicks AA, Hayward C, Wright AF, Gyllensten U, Campbell H, Schmitz G, consortium E: Genome-wide association study identifies novel loci associated with circulating phospho- and sphingolipid concentrations. PLoS genetics 2012;8:e1002490
15. Draisma HH, Pool R, Kobl M, Jansen R, Petersen AK, Vaarhorst AA, Yet I, Haller T, Demirkan A, Esko T, Zhu G, Bohringer S, Beekman M, van Klinken JB, Romisch-Margl W, Prehn C, Adamski J, de Craen AJ, van Leeuwen EM, Amin N, Dharuri H, Westra HJ, Franke L, de Geus EJ, Hottenga JJ, Willemsen G, Henders AK, Montgomery GW, Nyholt DR, Whitfield JB, Penninx BW, Spector TD, Metspalu A, Eline Slagboom P, van Dijk KW, t Hoen PA, Strauch K, Martin NG, van Ommen GJ, Illig T, Bell JT, Mangino M, Suhre K, McCarthy MI, Gieger C, Isaacs A, van Duijn CM, Boomsma DI: Genome-wide association study identifies novel genetic variants contributing to variation in blood metabolite levels. In Nature communications, 2015, p. 7208
23
Kangas AJ, Lyytikainen LP, Pirinen M, Pool R, Sarin AP, Soininen P, Tukiainen T, Wang Q, Tiainen M, Tynkkynen T, Amin N, Zeller T, Beekman M, Deelen J, van Dijk KW, Esko T, Hottenga JJ, van Leeuwen EM, Lehtimaki T, Mihailov E, Rose RJ, de Craen AJ, Gieger C, Kahonen M, Perola M, Blankenberg S, Savolainen MJ, Verhoeven A, Viikari J, Willemsen G, Boomsma DI, van Duijn CM, Eriksson J, Jula A, Jarvelin MR, Kaprio J, Metspalu A, Raitakari O, Salomaa V, Slagboom PE, Waldenberger M, Ripatti S, Ala-Korpela M: Genome-wide study for circulating metabolites identifies 62 loci and reveals novel systemic effects of LPA. Nature communications 2016;7:11122
17. Santos RL, Zillikens MC, Rivadeneira FR, Pols HA, Oostra BA, van Duijn CM, Aulchenko YS: Heritability of fasting glucose levels in a young genetically isolated population. Diabetologia 2006;49:667-672
18. Gonzalez-Covarrubias V, Beekman M, Uh HW, Dane A, Troost J, Paliukhovich I, van der Kloet FM, Houwing-Duistermaat J, Vreeken RJ, Hankemeier T, Slagboom EP: Lipidomics of familial longevity. Aging cell 2013;12:426-434
19. Demirkan A, Henneman P, Verhoeven A, Dharuri H, Amin N, van Klinken JB, Karssen LC, de Vries B, Meissner A, Goraler S, van den Maagdenberg AM, Deelder AM, PA CtH, van Duijn CM, van Dijk KW: Insight in genome-wide association of metabolite quantitative traits by exome sequence analyses. PLoS genetics 2015;11:e1004835
20. Verhoeven A, Slagboom E, Wuhrer M, Giera M, Mayboroda OA: Automated quantification of metabolites in blood-derived samples by NMR. Analytica Chimica Acta 2017;
24
22. Lotta LA, Scott RA, Sharp SJ, Burgess S, Luan J, Tillin T, Schmidt AF, Imamura F, Stewart ID, Perry JR, Marney L, Koulman A, Karoly ED, Forouhi NG, Sjogren RJ, Naslund E, Zierath JR, Krook A, Savage DB, Griffin JL, Chaturvedi N, Hingorani AD, Khaw KT, Barroso I, McCarthy MI, O'Rahilly S, Wareham NJ, Langenberg C: Genetic Predisposition to an Impaired Metabolism of the Branched-Chain Amino Acids and Risk of Type 2 Diabetes: A Mendelian Randomisation Analysis. PLoS Med 2016;13:e1002179
25
Fowkes GR, Kovacs P, Lindstrom J, Zemunik T, Bandinelli S, Wild SH, Basart HV, Rathmann W, Grallert H, Replication DIG, Meta-analysis C, Maerz W, Kleber ME, Boehm BO, Peters A, Pramstaller PP, Province MA, Borecki IB, Hastie ND, Rudan I, Campbell H, Watkins H, Farrall M, Stumvoll M, Ferrucci L, Waterworth DM, Bergman RN, Collins FS, Tuomilehto J, Watanabe RM, de Geus EJ, Penninx BW, Hofman A, Oostra BA, Psaty BM, Vollenweider P, Wilson JF, Wright AF, Hovingh GK, Metspalu A, Uusitupa M, Magnusson PK, Kyvik KO, Kaprio J, Price JF, Dedoussis GV, Deloukas P, Meneton P, Lind L, Boehnke M, Shuldiner AR, van Duijn CM, Morris AD, Toenjes A, Peyser PA, Beilby JP, Korner A, Kuusisto J, Laakso M, Bornstein SR, Schwarz PE, Lakka TA, Rauramaa R, Adair LS, Smith GD, Spector TD, Illig T, de Faire U, Hamsten A, Gudnason V, Kivimaki M, Hingorani A, Keinanen-Kiukaanniemi SM, Saaristo TE, Boomsma DI, Stefansson K, van der Harst P, Dupuis J, Pedersen NL, Sattar N, Harris TB, Cucca F, Ripatti S, Salomaa V, Mohlke KL, Balkau B, Froguel P, Pouta A, Jarvelin MR, Wareham NJ, Bouatia-Naji N, McCarthy MI, Franks PW, Meigs JB, Teslovich TM, Florez JC, Langenberg C, Ingelsson E, Prokopenko I, Barroso I: Large-scale association analyses identify new loci influencing glycemic traits and provide insight into the underlying biological pathways. Nat Genet 2012;44:991-1005
26
27
Frayling TM, Hattersley AT, Boerwinkle E, Melander O, Kathiresan S, Nilsson PM, Deloukas P, Thorsteinsdottir U, Groop LC, Stefansson K, Hu F, Pankow JS, Dupuis J, Meigs JB, Altshuler D, Boehnke M, McCarthy MI, Replication DIG, Meta-analysis C: Large-scale association analysis provides insights into the genetic architecture and pathophysiology of type 2 diabetes. Nat Genet 2012;44:981-990
28
29
30
Jarvelin MR, Peltonen L, Mooser V, Sladek R, investigators M, Consortium G, Musunuru K, Smith AV, Edmondson AC, Stylianou IM, Koseki M, Pirruccello JP, Chasman DI, Johansen CT, Fouchier SW, Peloso GM, Barbalic M, Ricketts SL, Bis JC, Feitosa MF, Orho-Melander M, Melander O, Li X, Li M, Cho YS, Go MJ, Kim YJ, Lee JY, Park T, Kim K, Sim X, Ong RT, Croteau-Chonka DC, Lange LA, Smith JD, Ziegler A, Zhang W, Zee RY, Whitfield JB, Thompson JR, Surakka I, Spector TD, Smit JH, Sinisalo J, Scott J, Saharinen J, Sabatti C, Rose LM, Roberts R, Rieder M, Parker AN, Pare G, O'Donnell CJ, Nieminen MS, Nickerson DA, Montgomery GW, McArdle W, Masson D, Martin NG, Marroni F, Lucas G, Luben R, Lokki ML, Lettre G, Launer LJ, Lakatta EG, Laaksonen R, Kyvik KO, Konig IR, Khaw KT, Kaplan LM, Johansson A, Janssens AC, Igl W, Hovingh GK, Hengstenberg C, Havulinna AS, Hastie ND, Harris TB, Haritunians T, Hall AS, Groop LC, Gonzalez E, Freimer NB, Erdmann J, Ejebe KG, Doring A, Dominiczak AF, Demissie S, Deloukas P, de Faire U, Crawford G, Chen YD, Caulfield MJ, Boekholdt SM, Assimes TL, Quertermous T, Seielstad M, Wong TY, Tai ES, Feranil AB, Kuzawa CW, Taylor HA, Jr., Gabriel SB, Holm H, Gudnason V, Krauss RM, Ordovas JM, Munroe PB, Kooner JS, Tall AR, Hegele RA, Kastelein JJ, Schadt EE, Strachan DP, Reilly MP, Samani NJ, Schunkert H, Cupples LA, Sandhu MS, Ridker PM, Rader DJ, Kathiresan S: Novel loci for adiponectin levels and their influence on type 2 diabetes and metabolic traits: a multi-ethnic meta-analysis of 45,891 individuals. PLoS genetics 2012;8:e1002607
31
32
33
2015;518:197-34 206
35
36
T, Rao DC, Rice TK, Ridker PM, Ritchie MD, Rudan I, Salomaa V, Samani NJ, Saramies J, Sarzynski MA, Schwarz PE, Shuldiner AR, Staessen JA, Steinthorsdottir V, Stolk RP, Strauch K, Tonjes A, Tremblay A, Tremoli E, Vohl MC, Volker U, Vollenweider P, Wilson JF, Witteman JC, Adair LS, Bochud M, Boehm BO, Bornstein SR, Bouchard C, Cauchi S, Caulfield MJ, Chambers JC, Chasman DI, Cooper RS, Dedoussis G, Ferrucci L, Froguel P, Grabe HJ, Hamsten A, Hui J, Hveem K, Jockel KH, Kivimaki M, Kuh D, Laakso M, Liu Y, Marz W, Munroe PB, Njolstad I, Oostra BA, Palmer CN, Pedersen NL, Perola M, Perusse L, Peters U, Power C, Quertermous T, Rauramaa R, Rivadeneira F, Saaristo TE, Saleheen D, Sinisalo J, Slagboom PE, Snieder H, Spector TD, Thorsteinsdottir U, Stumvoll M, Tuomilehto J, Uitterlinden AG, Uusitupa M, van der Harst P, Veronesi G, Walker M, Wareham NJ, Watkins H, Wichmann HE, Abecasis GR, Assimes TL, Berndt SI, Boehnke M, Borecki IB, Deloukas P, Franke L, Frayling TM, Groop LC, Hunter DJ, Kaplan RC, O'Connell JR, Qi L, Schlessinger D, Strachan DP, Stefansson K, van Duijn CM, Willer CJ, Visscher PM, Yang J, Hirschhorn JN, Zillikens MC, McCarthy MI, Speliotes EK, North KE, Fox CS, Barroso I, Franks PW, Ingelsson E, Heid IM, Loos RJ, Cupples LA, Morris AP, Lindgren CM, Mohlke KL: New genetic loci link adipose and insulin biology to body fat distribution. Nature 2015;518:187-196
28. Prasad RB, Groop L: Genetics of type 2 diabetes-pitfalls and possibilities. Genes (Basel) 2015;6:87-123
37 2007;81:559-575
30. Sherry ST, Ward MH, Kholodov M, Baker J, Phan L, Smigielski EM, Sirotkin K: dbSNP: the NCBI database of genetic variation. Nucleic Acids Res 2001;29:308-311 31. Magrane M, UniProt Consortium: UniProt Knowledgebase: a hub of integrated protein data. Database (Oxford) 2011;2011
32. Kamburov A, Pentchev K, Galicka H, Wierling C, Lehrach H, Herwig R: ConsensusPathDB: toward a more complete picture of cell biology. Nucleic Acids Res 2011;39:D712-D717
33. Saier J, M.H., Tran CV, Barabote RD: TCDB: the Transporter Classification Database for membrane transport protein analyses and information. Nucleic Acids Res 2006;34:D181-D186
34. Gasteiger E, Gattiker A, Hoogland C, Ivanyi I, Appel RD, Bairoch A: ExPASy: The proteomics server for in-depth protein knowledge and analysis. Nucleic Acids Res 2003;31:3784-3788
35. Kanehisa M, Goto S: KEGG: Kyoto Encyclopedia of Genes and Genomes. Nucleic Acids Research 2000;28:27-30
38
T, Salomaa V, LifeLines Cohort S, Kooner AS, Kooner JS, Lehne B, Scott WR, Tan ST, de Geus EJ, Milaneschi Y, Penninx BW, Willemsen G, de Mutsert R, Ford I, Gansevoort RT, Segura-Lepe MP, Raitakari OT, Viikari JS, Nikus K, Forrester T, McKenzie CA, de Craen AJ, de Ruijter HM, Group CLW, Pasterkamp G, Snieder H, Oldehinkel AJ, Slagboom PE, Cooper RS, Kahonen M, Lehtimaki T, Elliott P, van der Harst P, Jukema JW, Mook-Kanamori DO, Boomsma DI, Chambers JC, Swertz M, Ripatti S, Willems van Dijk K, Vitart V, Polasek O, Hayward C, Wilson JG, Wilson JF, Gudnason V, Rich SS, Psaty BM, Borecki IB, Boerwinkle E, Rotter JI, Cupples LA, van Duijn CM: Meta-analysis of 49 549 individuals imputed with the 1000 Genomes Project reveals an exonic damaging variant in ANGPTL4 determining fasting TG levels. J Med Genet 2016;53:441-449
37. Heemskerk MM, van Harmelen VJ, van Dijk KW, van Klinken JB: Reanalysis of mGWAS results and in vitro validation show that lactate dehydrogenase interacts with branched-chain amino acid metabolism. Eur J Hum Genet 2016;24:142-145
38. Draisma HHM, Pool R, Kobl M, Jansen R, Petersen A-K, Vaarhorst AAM, Yet I, Haller T, Demirkan A, Esko T: Genome-wide association study identifies novel genetic variants contributing to variation in blood metabolite levels. Nature communications 2015;6
39
Human metabolic individuality in biomedical and pharmaceutical research. Nature 2011;477:54-60
40. Suhre K, Meisinger C, Doring A, Altmaier E, Belcredi P, Gieger C, Chang D, Milburn MV, Gall WE, Weinberger KM, Mewes HW, Hrabe de Angelis M, Wichmann HE, Kronenberg F, Adamski J, Illig T: Metabolic footprint of diabetes: a multiplatform metabolomics study in an epidemiological setting. PloS one 2010;5:e13953
41. Cheng S, Rhee EP, Larson MG, Lewis GD, McCabe EL, Shen D, Palma MJ, Roberts LD, Dejam A, Souza AL, Deik AA, Magnusson M, Fox CS, O'Donnell CJ, Vasan RS, Melander O, Clish CB, Gerszten RE, Wang TJ: Metabolite profiling identifies pathways associated with metabolic risk in humans. Circulation 2012;125:2222-2231
42. Eickhoff H, Guimaraes A, Louro TM, Seica RM, Castro ESF: Insulin resistance and beta cell function before and after sleeve gastrectomy in obese patients with impaired fasting glucose or type 2 diabetes. Surg Endosc 2015;29:438-443
43. Drew BG, Rye KA, Duffy SJ, Barter P, Kingwell BA: The emerging role of HDL in glucose metabolism. Nat Rev Endocrinol 2012;8:237-245
44. Siebel AL, Heywood SE, Kingwell BA: HDL and glucose metabolism: current evidence and therapeutic potential. Front Pharmacol 2015;6:258
45. Hao M, Head WS, Gunawardana SC, Hasty AH, Piston DW: Direct effect of cholesterol on insulin secretion: a novel mechanism for pancreatic beta-cell dysfunction. Diabetes 2007;56:2328-2338
40
47. Rutti S, Ehses JA, Sibler RA, Prazak R, Rohrer L, Georgopoulos S, Meier DT, Niclauss N, Berney T, Donath MY, von Eckardstein A: Low- and high-density lipoproteins modulate function, apoptosis, and proliferation of primary human and murine pancreatic beta-cells. Endocrinology 2009;150:4521-4530
48. Dalla-Riva J, Stenkula KG, Petrlova J, Lagerstedt JO: Discoidal HDL and apoA-I-derived peptides improve glucose uptake in skeletal muscle. J Lipid Res 2013;54:1275-1282
49. Drew BG, Duffy SJ, Formosa MF, Natoli AK, Henstridge DC, Penfold SA, Thomas WG, Mukhamedova N, de Courten B, Forbes JM, Yap FY, Kaye DM, van Hall G, Febbraio MA, Kemp BE, Sviridov D, Steinberg GR, Kingwell BA: High-density lipoprotein modulates glucose metabolism in patients with type 2 diabetes mellitus. Circulation 2009;119:2103-2111
50. Briand F, Prunet-Marcassus B, Thieblemont Q, Costard C, Muzotte E, Sordello S, Sulpice T: Raising HDL with CETP inhibitor torcetrapib improves glucose homeostasis in dyslipidemic and insulin resistant hamsters. Atherosclerosis 2014;233:359-362
51. Barter PJ, Rye KA, Tardif JC, Waters DD, Boekholdt SM, Breazna A, Kastelein JJ: Effect of torcetrapib on glucose, insulin, and hemoglobin A1c in subjects in the Investigation of Lipid Level Management to Understand its Impact in Atherosclerotic Events (ILLUMINATE) trial. Circulation 2011;124:555-562
41
Ruepp A, Hrabe de Angelis M, Li Y, Wichmann HE, Stratmann B, Strauch K, Metspalu A, Gieger C, Suhre K, Adamski J, Illig T, Rathmann W, Roden M, Peters A, van Duijn CM, Boomsma DI, Meitinger T, Wang-Sattler R: Effects of Metformin on Metabolite Profiles and LDL Cholesterol in Patients With Type 2 Diabetes. Diabetes Care 2015;38:1858-1867
53. Wurtz P, Tiainen M, Makinen VP, Kangas AJ, Soininen P, Saltevo J, Keinanen-Kiukaanniemi S, Mantyselka P, Lehtimaki T, Laakso M, Jula A, Kahonen M, Vanhala M, Ala-Korpela M: Circulating metabolite predictors of glycemia in middle-aged men and women. Diabetes Care 2012;35:1749-1756
54. Tyrrell J, Jones SE, Beaumont R, Astley CM, Lovell R, Yaghootkar H, Tuke M, Ruth KS, Freathy RM, Hirschhorn JN, Wood AR, Murray A, Weedon MN, Frayling TM: Height, body mass index, and socioeconomic status: mendelian randomisation study in UK Biobank. BMJ (Clinical research ed) 2016;352:i582
42 Table 1 Characteristics of the study population
1
Controls
n=2,564
Cases
n=212 P-value P-value*
Male [n (%)] 1132 (44.1) 108 (50.9) 0.059 0.20
Age (years) 48.2 ± 14.3 59.8 ± 11.8 6.4 × 10⁻³² 2.1 × 10⁻¹²
Body mass index (kg/m2) 26.7 ± 4.6 30.0 ± 5.9 3.4 × 10⁻¹³ 3.7 × 10⁻¹²
Waist-to-hip ratio 0.86 ± 0.10 0.95 ± 0.10 9.5 × 10⁻²⁷ 2.6 × 10⁻¹⁷
Systolic blood pressure (mmHg) 139 ± 20 154 ± 21 7.3 × 10⁻¹⁹ 8.2 × 10⁻⁶
Diastolic blood pressure (mmHg) 80.3 ± 10.0 82.9 ± 9.9 4.5 × 10⁻⁴ 0.11
LDL-cholesterol (mmol/l) 3.8 ± 1.0 3.2 ± 1.0 4.8 × 10⁻¹⁵ 1.0 × 10⁻⁹
Triglycerides (mmol/l) 1.2 (0.8, 1.6) 1.6 (1.1, 1.9) 2.0 × 10⁻¹⁰ 5.1 × 10⁻⁶
HDL-cholesterol (mmol/l) 1.3 ± 0.4 1.1 ± 0.3 2.7 × 10⁻¹¹ 5.6 × 10⁻⁸
Fasting glucose (mmol/l) 4.5 ± 0.7 7.4 ± 2.2 9.4 × 10-44 1.5 × 10-54
Fasting insulin (mU/L) 11 (8, 15) 16 (11, 22) 1.2 × 10⁻⁷ 9.0 × 10⁻⁷
43
Lipid lowering medication [n (%)] 265 (10.3) 99 (46.7) 7.2 × 10⁻²⁰ 1.5 × 10⁻²²
Data are means ± standard deviations (SD), medians (inter-quartile range) or percentages. Triglycerides, fasting insulin, adiponectin, 2
and HOMA-IR were natural logarithm transformed prior to analysis. P-value: T-test and Chi-squire test were used in continuous 3
variables and categorical variables, respectively. P-value*: Logistic regression was used with adjusting age, sex and lipid lowering 4
44
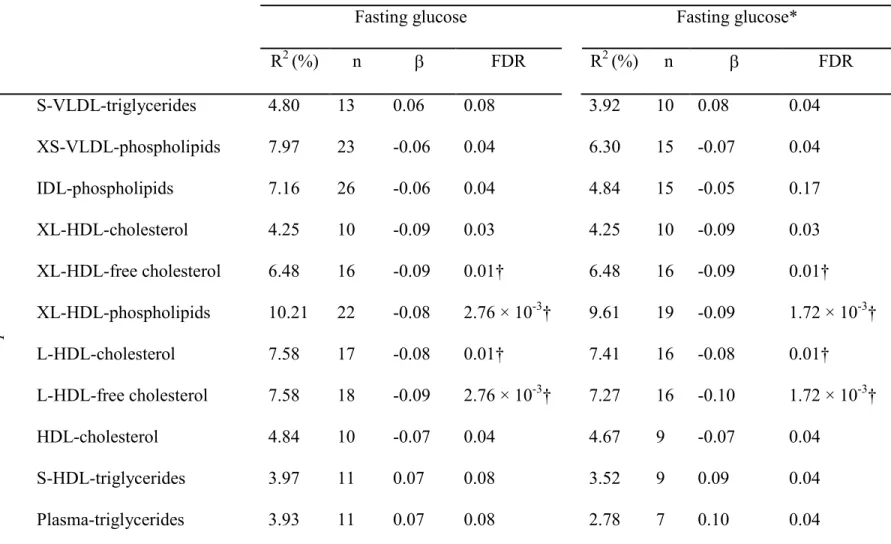
Table 2 Mendelian randomization of metabolites (exposure) on fasting glucose (outcome) 6
Outcome
Fasting glucose Fasting glucose*
R2 (%) n β FDR R2 (%) n β FDR
E
xp
o
su
re
S-VLDL-triglycerides 4.80 13 0.06 0.08 3.92 10 0.08 0.04
XS-VLDL-phospholipids 7.97 23 -0.06 0.04 6.30 15 -0.07 0.04
IDL-phospholipids 7.16 26 -0.06 0.04 4.84 15 -0.05 0.17
XL-HDL-cholesterol 4.25 10 -0.09 0.03 4.25 10 -0.09 0.03
XL-HDL-free cholesterol 6.48 16 -0.09 0.01† 6.48 16 -0.09 0.01†
XL-HDL-phospholipids 10.21 22 -0.08 2.76 × 10⁻³† 9.61 19 -0.09 1.72 × 10⁻³†
L-HDL-cholesterol 7.58 17 -0.08 0.01† 7.41 16 -0.08 0.01†
L-HDL-free cholesterol 7.58 18 -0.09 2.76 × 10⁻³† 7.27 16 -0.10 1.72 × 10⁻³†
HDL-cholesterol 4.84 10 -0.07 0.04 4.67 9 -0.07 0.04
S-HDL-triglycerides 3.97 11 0.07 0.08 3.52 9 0.09 0.04
Plasma-triglycerides 3.93 11 0.07 0.08 2.78 7 0.10 0.04
The Mendelian randomization sets with FDR < 0.05 with respect to either outcome is shown in this table. R2 (%): the percentage of 7
45
genetic risk score of exposure on outcome FDR: A false discovery rate on the number of Mendelian randomization sets adjusted P-9
value. * results of pathway-based analysis. † the Mendelian randomization sets with P-value < Bonferroni P-value 2.5 × 10⁻³ (0.05/20). 10
46
Table 3 Mendelian randomization of metabolites (exposure) on type 2 diabetes (outcome) 12
Outcome
Type 2 diabetes Type 2 diabetes*
R2 (%) n β FDR R2 (%) n β FDR
E
xp
o
su
re
XS-VLDL-phospholipids 8.02 23 -0.08 0.03 6.34 15 -0.06 0.31
IDL-phospholipids 7.18 26 -0.09 0.01 4.86 15 -0.07 0.24
Plasma-triglycerides 4.21 12 0.08 0.07 3.16 8 0.12 0.046†
The Mendelian randomization sets with either FDR < 0.05 are shown in this table. R2 (%): the percentage of explained variance in the 13
exposure by genetic risk score. n: the number of SNPs in the genetic risk score. β: the weighted effect of the genetic risk score of 14
exposure on outcome. FDR: A false discovery rate on the number of Mendelian randomization sets adjusted P-value. * results of 15
pathway-based analysis. † the Mendelian randomization sets with P-value < Bonferroni P-value 2.5 × 10⁻³ (0.05/20). 16
47
Table 4 Mendelian randomization of fasting glucose/type 2 diabetes (exposure) on metabolites (outcome) 18
Exposure
Fasting glucose Type 2 diabetes
R2 (%) n β FDR R2 (%) n β FDR
O
u
tc
o
m
e
PC alkyl-acyl C42:5 0.83 13 NP NP 1.51 32 -0.08 0.02†
PC alkyl-acyl C44:4 1.10 15 0.02 0.95 1.51 32 -0.08 0.02
Alanine 1.06 14 0.06 0.48 1.48 31 0.08 0.02
The Mendelian randomization sets with either FDR < 0.05 are shown in this table. PC: Phosphatidylcholine. R2 (%): the percentage of 19
explained variance in the exposure by genetic risk score. n: the number of SNPs in the genetic risk score. β: the weighted effect of the 20
genetic risk score of exposure on outcome. FDR: A false discovery rate on the number of Mendelian randomization sets adjusted P-21
48
Table 5 Review of the previous MR in metabolites or lipids and type 2 diabetes (T2D) or glucose 23
Study Methods Exposure Outcome OR/β (95%CI) P-value
Instrumental variables
and pleiotropy control
Luca LA(22) Two-sample MR Isoleucine T2D (n=315,571)
1.44 (1.22, 1.17) 2.0 × 10⁻⁵
1) Independent
SNPs from
GWAS
meta-analysis.
2)Control for
pleiotropy. Leucine 1.73 (1.28, 2.34) 3.4 × 10⁻⁴
Valine 1.45 (1.18, 1.77) 3.4 × 10⁻⁵
Marott
SC,
2016(8)
Two-stage
least-squares regression
HDL-C
T2D
(n=93,097)
0.86 (0.43, 1.72) 0.68
3 variants from ABCA1,
CETP
TG
T2D
(n=97,199)
1.05 (0.88, 1.24) 0.60
4 variants from TRIB1,
APOA5, LPL.
White J,
2016 (9)
Conventional
two-sample MR;
Multivariate MR;
LDL-C
T2D
(DIAGRAM)
0.79 (0.71, 0.88) P < 0.05 1) Independent
SNPs from
GLGC GWAS.
HDL-C 0.83 (0.76, 0.90) P < 0.05
49
MR-Egger 2) gtx package
with pleiotropic
control.
Haase CL,
2015(5)
Two-stage
least-squares regression
HDL-C
T2D
(n=47,627)
0.93 (0.78, 1.11) 0.42
9 variants from ABCA1,
CETP, LCAT, LIPC,
APOA1.
Fall T,
2015(6)
Two-sample MR
LDL-C
T2D
(DIAGRAM)
-0.03 (-0.19, 0.12)* 0.67
1) Independent SNPs
with large effect on the
lipid and smaller effect
on other lipid fractions
from GLGC GWAS. 2)
gtx package with
pleiotropic control. FG (MAGIC) 0 (-0.03, 0.03)* 0.85
HDL-C
T2D
(DIAGRAM)
-0.19 (-0.38, -0.01)* 0.04
FG (MAGIC) -0.02 (-0.06, 0.01)* 0.24
Andersso
n C,
2015(10)
Two-stage
least-squares regression
LDL-C Incident T2D 0.85 (0.76, 0.96) 0.009
GRS from 37 LDL-C
related SNPs without any
50 * β (95%CI).
24
25
Islam M,
2012(11)
Two-stage
least-squares regression
TG T2D (n=2,111) 0.04 (0.014, 0.072)* 0.004
Included 10 independent
SNPs from previous
studies (excluded FADS1
and GCKR).
De Silva
NM,
2011(7)
Two-stage
least-squares regression TG
T2D (n=8,335) 0.99 (0.97, 1.01) 0.26
Included 10 independent
SNPs from previous
studies (excluded FADS1
51
Figure 1 Overview of the Mendelian randomization process 26
52
Figure 2 Data handling, quality checks and exclusions during Mendelian randomization 29
30
*MAGIC and DIAGRAM sets are imputed based on HapMap2 and therefore do not include 31
53
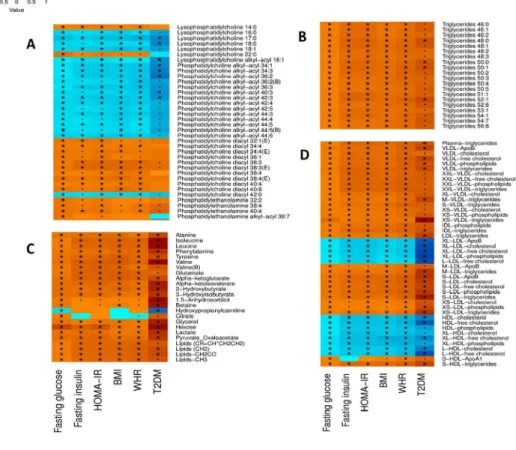
Figure 3 Metabolites correlated with markers of T2DM and anthropometric risk factors 33
34 35
A: Phosphatidylcholines; B: Triglycerides; C: small molecules and amino acids; D: 36
lipoproteins. The associations between metabolites and continuous variables were 37
performed by partial correlation in the non-diabetic population. The color in the figure 38
displays the value of correlation coefficient. The associations between metabolites and 39
type 2 diabetes status were performed by logistic regression. The color in the figure 40
displays the standardized effect of metabolites on type 2 diabetes. Age, sex and lipid 41
lowering medication are considered as covariates. FG: fasting glucose. FI: fasting insulin. 42
HOMA-IR: homeostasis model assessment of insulin resistance. BMI: body mass index. 43
WHR: waist-to-hip ratio. *: 0.05 < P-value < 5.24 × 10⁻⁵ (0.05/191/5). •: P-value < 0.05 44
& P-value ≥ 5.24 × 10⁻⁵. (B): Selected measurement is from the Biocrates platform when 45
the same metabolite is also captured by the LC-MS/NMR-COMP/NMR-LIPO platform. 46
(E): Selected measurement is from the ESI-MS platform when the same metabolite is 47
also captured by the LC-MS platform. 48
54
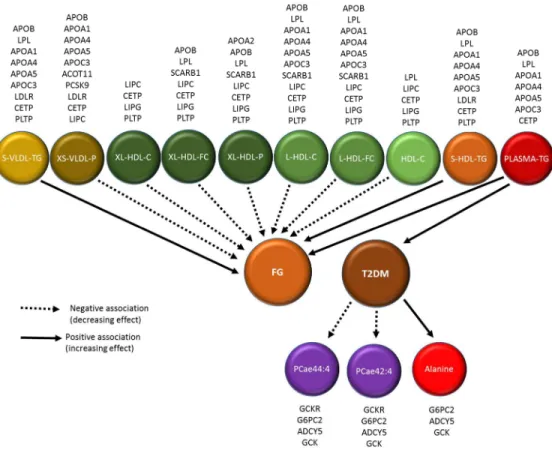
Figure 4 Suggested causal paths for glucose homeostasis and type 2 diabetes after 51
pathway-based sensitivity analysis. 52
53 54
FG: fasting glucose; TG: triglycerides; C: cholesterol; FC: free cholesterol; P: 55
phospholipids; PCae: phosphatidylcholine alkyl-acyl. The gene names above the 56
metabolite names indicate the loci where the SNPs used in the genetic risk score are 57
located. 58
Figure 1 Overview of the Mendelian randomization process
Figure 2 Data handling, quality checks and exclusions during Mendelian randomization . *MAGIC and DIAGRAM sets are imputed based on HapMap2 and therefore do not include indels.
Figure 3 Metabolites correlated with markers of T2DM and anthropometric risk factors
A: Phosphatidylcholines; B: Triglycerides; C: small molecules and amino acids; D: lipoproteins. The associations between metabolites and continuous variables were performed by partial correlation in the
non-diabetic population. The color in the figure displays the value of correlation coefficient. The associations between metabolites and type 2 diabetes status were performed by logistic regression. The color in the figure displays the standardized effect of metabolites on type 2 diabetes. Age, sex and lipid lowering medication are considered as covariates. FG: fasting glucose. FI: fasting insulin. HOMA-IR: homeostasis model assessment of insulin resistance. BMI: body mass index. WHR: waist-to-hip ratio. *: 0.05 < P-value < 5.24 × 10⁻⁵ (0.05/191/5). : P-value < 0.05 & P-value 5.24 × 10⁻⁵. (B): Selected measurement is from the Biocrates platform when the same metabolite is also captured by the LC-MS/NMR-COMP/NMR-LIPO
platform. (E): Selected measurement is from the ESI-MS platform when the same metabolite is also captured by the LC-MS platform.
Figure 4 Suggested causal paths for glucose homeostasis and type 2 diabetes after pathway-based sensitivity analysis.
FG: fasting glucose; TG: triglycerides; C: cholesterol; FC: free cholesterol; P: phospholipids; PCae: phosphatidylcholine alkyl-acyl. The gene names above the metabolite names indicate the loci where the
SNPs used in the genetic risk score are located.
The correlations between the glucose-related metabolites are performed in the non-diabetic
population. The color in the figure displays the value of correlation coefficient. *: P-value <
when the same metabolite is also captured by the LC-MS / NMR-COMP/ NMR-LIPO
platform. (E): Selected measurement is from the ESI-MS platform when the same metabolite
1
Supplemental table 1 SNPs that are excluded from the genetic risk score because of their major association to outcome phenotypes or possible confounders BMI and WHR
BMI: body mass index. WHR: waist-to-hip ratio. T2DM: type 2 diabetes.
Please find the table (Suppl_t_1) in the link
2
Supplemental table 2 SNPs that are excluded from the genetic risk score because of disproportionate weights in the genetic risk score, as detected by the gtx function
T2DM: type 2 diabetes. R2 (%): the percentage of explained variance in the exposure by genetic risk score.
Please find the table (Suppl_t_2) in the link
3
Supplemental table 3 All 124 metabolites' correlation coefficients, p-values as well as the overlap with previous research
R: correlated coefficient. HOMA-IR: Homeostatic model assessment insulin resistance; BMI: body mass index; WHR: waist-to-hip ratio; T2DM: type 2 diabetes. ESI-MS: Electrospray Ionisation-Mass
Spectrometry; LC-MS: Liquid Chromatography-Mass Spectrometry; NMR-COMP: Small Compound Nuclear Magnetic Resonance Spectroscopy; NMR-LIPO: Lipoprotein Nuclear Magnetic Resonance Spectroscopy. (P): positive association; (N): negative association.
Please find the table (Suppl_t_3) in the link
https://www.dropbox.com/s/cd0xp33gube4rky/Supplementary_tables_LIU_J_revised.xlsx?dl=0
References:
Drogan, D., et al. Untargeted metabolic profiling identifies altered serum metabolites of type 2 diabetes mellitus in a prospective, nested case control study. Clin Chem 61, 487-497 (2015).
Floegel, A., et al. Identification of serum metabolites associated with risk of type 2 diabetes using a targeted metabolomic approach. Diabetes 62, 639-648 (2013).
Suhre, K., et al. Metabolic footprint of diabetes: a multiplatform metabolomics study in an epidemiological setting. PLoS One 5, e13953 (2010).
Ha, C.Y., et al. The association of specific metabolites of lipid metabolism with markers of oxidative stress, inflammation and arterial stiffness in men with newly diagnosed type 2 diabetes. Clin Endocrinol (Oxf) 76, 674-682 (2012).
Rhee, E.P., et al. Lipid profiling identifies a triacylglycerol signature of insulin resistance and improves diabetes prediction in humans. J Clin Invest 121, 1402-1411 (2011).
Kotronen, A., et al. Serum saturated fatty acids containing triacylglycerols are better markers of insulin resistance than total serum triacylglycerol concentrations. Diabetologia 52, 684-690 (2009).
Cheng, S., et al. Metabolite profiling identifies pathways associated with metabolic risk in humans. Circulation 125, 2222-2231 (2012).
Ferrannini, E., et al. Early metabolic markers of the development of dysglycemia and type 2 diabetes and their physiological significance. Diabetes 62, 1730-1737 (2013).
4
Wurtz, P., et al. Circulating metabolite predictors of glycemia in middle-aged men and women. Diabetes Care 35, 1749-1756 (2012).
Bao, Y., et al. Metabonomic variations in the drug-treated type 2 diabetes mellitus patients and healthy volunteers. J Proteome Res 8, 1623-1630 (2009).
Shaham, O., et al. Metabolic profiling of the human response to a glucose challenge reveals distinct axes of insulin sensitivity. Mol Syst Biol 4, 214 (2008).
Fiehn, O., et al. Plasma metabolomic profiles reflective of glucose homeostasis in non-diabetic and type 2 diabetic obese African-American women. PLoS One 5, e15234 (2010).
5
Supplemental table 4 Results of Mendelian randomization of metabolites on fasting glucose/T2DM (forward approach)
® Pathway based sensitivity analysis. T2DM: type 2 diabetes. R2 (%): the percentage of explained variance in the exposure by genetic risk score. FDR: false discovery rate. NP: not performed.
Please find the table (Suppl_t_4) in the link
6
Supplemental table 5 SNP lists included in exposure genetic risk score in Mendelian randomization of metabolites on fasting glucose/T2DM (forward approach)
T2DM: type 2 diabetes. MAF: minor allele frequency. Standardized effect is the t-statistic in the
association analysis. (NA): no genes confirmed by the outcome in the pathway analysis. ? The gene in the pathway analysis is not confirmed. R2 (%): the percentage of explained variance in the exposure by genetic risk score. NP: not performed.
Please find the table (Suppl_t_5) in the link
7
Supplemental table 6 Mendelian randomization of fasting glucose/T2DM on metabolites (backward approach)
® Pathway based sensitivity analysis. T2DM: type 2 diabetes. FDR: false discovery rate. NP: not performed. R2 (%): the percentage of explained variance in the exposure by genetic risk score. As the genetic risk scores of the glucose explained less than 1% of variance, the backward MR with pathway analysis is not performed.
Please find the table (Suppl_t_6) in the link
8
Supplemental table 7 SNP lists included in exposure genetic risk score in Mendelian randomization of fasting glucose/T2DM on metabolites (backward approach)
T2DM: type 2 diabetes. MAF: minor allele frequency. Standardized effect is the t-statistic in the
association analysis. (NA): no genes confirmed by the outcome in the pathway analysis. ? The gene in the pathway analysis is not confirmed. Only fasting glucose was done the pathway analysis. NP: not
performed. R2 (%): the percentage of explained variance in the exposure by genetic risk score.
Please find the table (Suppl_t_7) in the link