Unified thalamic model generates multiple
distinct oscillations with state-dependent
entrainment by stimulation
Guoshi Li1, Craig S. Henriquez2, Flavio Fro¨ hlich1,3,4,5,6*
1 Department of Psychiatry, University of North Carolina at Chapel Hill, Chapel Hill, NC, United States of
America, 2 Department of Biomedical Engineering, Duke University, Durham, NC, United States of America,
3 Department of Biomedical Engineering, University of North Carolina at Chapel Hill, Chapel Hill, NC, United
States of America, 4 Department of Cell Biology and Physiology, University of North Carolina at Chapel Hill, Chapel Hill, NC, United States of America, 5 Department of Neurology, University of North Carolina at Chapel Hill, Chapel Hill, NC, United States of America, 6 Neuroscience Center, University of North Carolina at Chapel Hill, Chapel Hill, NC, United States of America
Abstract
The thalamus plays a critical role in the genesis of thalamocortical oscillations, yet the underlying mechanisms remain elusive. To understand whether the isolated thalamus can generate multiple distinct oscillations, we developed a biophysical thalamic model to test the hypothesis that generation of and transition between distinct thalamic oscillations can be explained as a function of neuromodulation by acetylcholine (ACh) and norepinephrine (NE) and afferent synaptic excitation. Indeed, the model exhibited four distinct thalamic rhythms (delta, sleep spindle, alpha and gamma oscillations) that span the physiological states corre-sponding to different arousal levels from deep sleep to focused attention. Our simulation results indicate that generation of these distinct thalamic oscillations is a result of both intrin-sic oscillatory cellular properties and specific network connectivity patterns. We then sys-tematically varied the ACh/NE and input levels to generate a complete map of the different oscillatory states and their transitions. Lastly, we applied periodic stimulation to the thalamic network and found that entrainment of thalamic oscillations is highly state-dependent. Our results support the hypothesis that ACh/NE modulation and afferent excitation define tha-lamic oscillatory states and their response to brain stimulation. Our model proposes a broader and more central role of the thalamus in the genesis of multiple distinct thalamo-cor-tical rhythms than previously assumed.
Author summary
Computational modeling has served as an important tool to understand the cellular and circuit mechanisms of thalamocortical oscillations. However, most of the existing tha-lamic models focus on only one particular oscillatory pattern such as alpha or spindle oscillations. Thus, it remains unclear whether the same thalamic circuitry on its own could generate all major oscillatory patterns and if so what mechanisms underlie the a1111111111 a1111111111 a1111111111 a1111111111 a1111111111 OPEN ACCESS
Citation: Li G, Henriquez CS, Fro¨hlich F (2017) Unified thalamic model generates multiple distinct oscillations with state-dependent entrainment by stimulation. PLoS Comput Biol 13(10): e1005797.
https://doi.org/10.1371/journal.pcbi.1005797
Editor: Boris S. Gutkin, E´cole Normale Supe´rieure, College de France, CNRS, FRANCE
Received: August 27, 2017
Accepted: September 26, 2017
Published: October 26, 2017
Copyright:©2017 Li et al. This is an open access
article distributed under the terms of theCreative
Commons Attribution License, which permits unrestricted use, distribution, and reproduction in any medium, provided the original author and source are credited.
Data Availability Statement: All relevant data are contained within the paper. Simulation code is
available from the ModelDB database (http://
modeldb.yale.edu/233509; Accession number 233509).
Funding: This work was supported by the National Institute of Mental Health (NIMH) of the National
Institutes of Health (NIH) (https://www.nimh.nih.
gov) R01 Grants MH101547 and MH111889 to FF
and the National Institute on Deafness and Other
Communication Disorders (NIDCD) of NIH (https://
transition among these distinct states. Here we present a unified model of the thalamus that is capable of independently generating multiple distinct oscillations corresponding to different physiological conditions. We then mapped out the different thalamic oscillations by varying the ACh/NE modulatory level and input level systematically. Our simulation results offer a mechanistic understanding of thalamic oscillations and support the long standing notion of a thalamic “pacemaker”. It also suggests that pathological oscillations associated with neurological and psychiatric disorders may stem from malfunction of the thalamic circuitry.
Introduction
The thalamocortical network plays a central role in cerebral rhythmic oscillations [1–4] and abnormal thalamocortical rhythms have been associated with disorders such as depression, schizophrenia and Alzheimer’s disease [5–7]. Understanding the cellular and circuit mecha-nisms of thalamocortical oscillations thus constitutes a crucial first step to comprehend the network impairments underlying neurological and psychiatric disorders. However, the mecha-nisms by which the thalamocortical network generates distinct states of oscillatory patterns remain highly debated [8–11]. One important question is whether the thalamus, originally believed to be the “pacemaker” of thalamocortical oscillations [7,8,12], is indeed able to inde-pendently generate multiple distinct brain rhythms or whether the thalamus requires interac-tion with the cortex [13–16]. Answering this question not only provides the basis for a
mechanistic understanding of brain oscillations, but also will provide important insights in the design of effective mechanism-based brain stimulation techniques that specifically target abnormal thalamocortical dynamics.
Experimental evidence suggests that the thalamus is capable of independently generating multiple, distinct oscillatory states. In the cat lateral geniculate nucleus (LGN),in vitroandin vivostudies have identified a subset of thalamocortical cells (TCs) that generate high-threshold bursting at theta (θ) and alpha (α) frequency bands and thus may mediate the cellular mecha-nism of bothθ andαoscillations [12,17,18]. Coupled with gap junctions [12,17], high-threshold bursting TC cells provide synchronized excitatory inputs to local interneurons and reticular cells that entrain the majority of TC cells (i.e., non-high threshold bursting TC cells) into theαrhythm via feed-forward and feedback inhibition [18]. Besidesθ/αoscillations, the thalamus is also critically involved in the genesis of the slow delta rhythm and spindle oscilla-tions that appear at different stages of non-rapid eye movement (NREM) sleep [2,19,20]. Moreover, the thalamus is able to produce high frequency oscillations in bothβandγbands (20–60 Hz) in the neonatal rat whisker sensory system [21], during attentional processing in cats [22] and during cognitive tasks in humans [23]. Consistently, experimental data indicated that fast rhythms (30–40 Hz) could be synchronized with an intrathalamic mechanism [24]. It is not known whether the same neural substrate and circuitry forθ andαoscillations could also mediate other oscillatory patterns and what controls the transition among these oscillatory states.
Thalamic processing is subject to the action of modulatory neurotransmitters including acetylcholine (ACh), norepinephrine (NE), serotonin (5-HT), histamine (HA) and dopamine (DA) [25]. Of these neurotransmitters, cholinergic and noradrenergic modulation plays the key and best understood role in shaping the oscillatory state of the thalamocortical network [26]. Consistently, theαrhythm is both induced by muscarinic cholinergic receptor activation in slices of cat LGN [17] and supported by cholinergic innervationin vivo[18]. Fast rhythmic
The funders had no role in study design, data collection and analysis, decision to publish, or preparation of the manuscript.
activities in theβ/γfrequency band (20–60 Hz) are observed in cat thalamocortical cells [11] and promoted by cholinergic projection from the brainstem [27]. Besides, slowδoscillations are believed to be mediated by hyperpolarization of TC neurons with diminished activation of both the cholinergic and noradrenergic systems [28,29]. In addition to neuromodulation, the specific type of thalamic oscillation is also dependent on the level of afferent excitation. For example, the amplitude of theαoscillation is maximal when the eyes are closed and therefore input form the retina is low [30]. Hence, generation and transition of distinct thalamic oscilla-tions depend critically on neuromodulation and afferent excitation, yet a unified model has been lacking so far.
To close this gap, we developed a biophysical, conductance-based model of the thalamic network constrained by extensive experimental data to test the hypothesis that generation and transition of distinct thalamic oscillations are functions of both ACh/NE neuromodulation and afferent excitation under various physiological conditions. By varying only these two model parameters, ACh/NE neuromodulation and afferent excitation, we demonstrated that the thalamic network is capable of generating multiple distinct oscillatory states (δ, spindle,α/ θ andγ/βoscillations) in absence of cortical input. We elucidated the cellular and circuit mechanisms for each oscillatory state by manipulating the network connectivity and key model parameters. Simulation results suggest that generation of distinct thalamic oscillations is a result of both intrinsic oscillatory cellular properties and specific network connectivity pat-terns. The manifestation of multiple distinct oscillations in one unified biophysical thalamic model enabled us to examine the impact of rhythmic stimulation on thalamic network dynam-ics. By applying periodic stimulation to the thalamic model during three major oscillatory states (δ,αandγoscillations), we observed that entrainment of thalamic oscillations is highly state-dependent in that the same stimulation induced much stronger and more prominent entrainment duringγoscillations thanδandαoscillations due to the different oscillatory mechanisms. Our findings emphasize the importance of considering the rich role of endoge-nous oscillations in thalamus for the study of thalamo-cortical rhythms and highlight the need to consider the network state when modulating brain oscillations with periodic stimulation waveforms.
Results
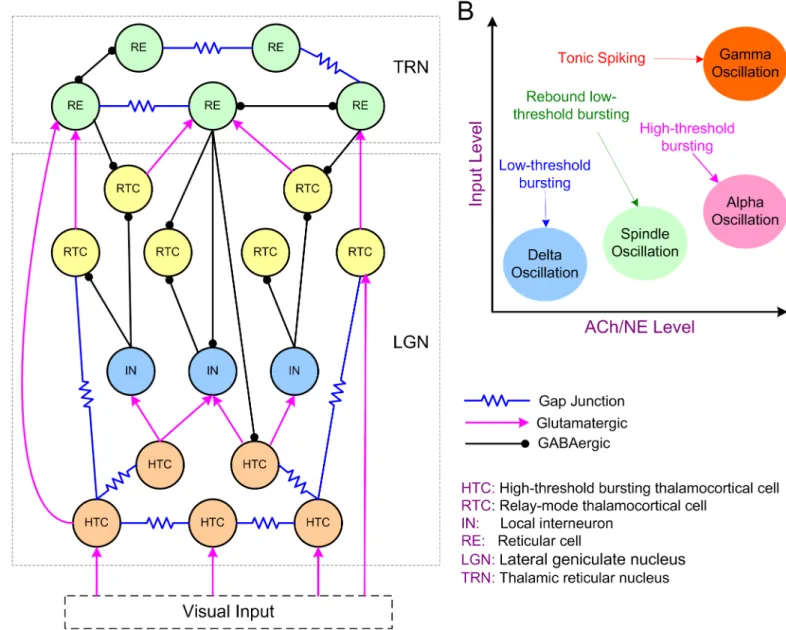
We developed a biophysical conductance-based thalamic network model containing both the lateral geniculate nucleus (LGN) and the reticular nucleus (TRN) of the thalamus (Fig 1A; see
Methods). We first constructed single cell models of high-threshold bursting TC cells (HTCs), relay-mode TC cells (RTCs), local interneurons (INs) and thalamic reticular cells (REs) that replicated experimentally observed firing patterns both in control condition and in case of modulation by ACh/NE (S1andS2Figs;S1 Text). By connecting the four types of neurons into a thalamic network (Fig 1A), we tested the central hypothesis that generation and transi-tion of distinct thalamic oscillatransi-tions are functransi-tions of both ACh/NE modulatransi-tion and afferent excitation (Fig 1B).
The thalamic network is able to produce multiple distinct oscillatory
states dependent on ACh/NE modulation and afferent excitation
in HTC, RTC and RE cells, but higher potassium leak conductance in INs (Table 1; also see
Methods). All four types of thalamic neurons received random Poisson distributed inputs mediated by AMPA receptors and the maximal input conductance was a fixed constant value associated with the AMPA synaptic channels.
Delta oscillations. For modeling deep sleep (i.e., non-rapid eye movement sleep, NREM
3), both the ACh/NE modulation and afferent inputs were set to very low values (Table 1). In this case, our model generated a low frequency oscillation at 3.7 Hz (Fig 2A), which was within theδfrequency band (1–4 Hz; [19,29,31,32]). The oscillation frequency was reduced to around 3 Hz if the potassium leak conductance in TC cells increased slightly (S3A Fig), and further reduced to around 2 Hz when the inactivation time constant of the low-threshold T-Fig 1. The thalamic network structure and model hypothesis. (A) Schematic diagram of the thalamic network model. (B) Model hypothesis: Generation
and transition of thalamic oscillations are functions of both ACh/NE modulation and afferent excitation. Delta oscillations occur in the low ACh/NE modulatory state with minimal afferent input; spindle oscillations exist in the medium ACh/NE modulatory state with slightly increased afferent input; alpha oscillations are generated in the high ACh/NE modulatory state with weak afferent input, while gamma oscillations are generated in the high ACh/NE modulatory state with strong afferent input. The labels with arrows indicate the firing patterns of the high-threshold bursting thalamocortical cells in different oscillatory states.
type Ca2+current (ICa/T) increased 25% combined with increase of the potassium leak current
and substantial blockage of the regular leak current (S3B Fig). Thus, the specificδfrequency can be fine-tuned by the leak/potassium leak conductance and the dynamics ofICa/T. Duringδ
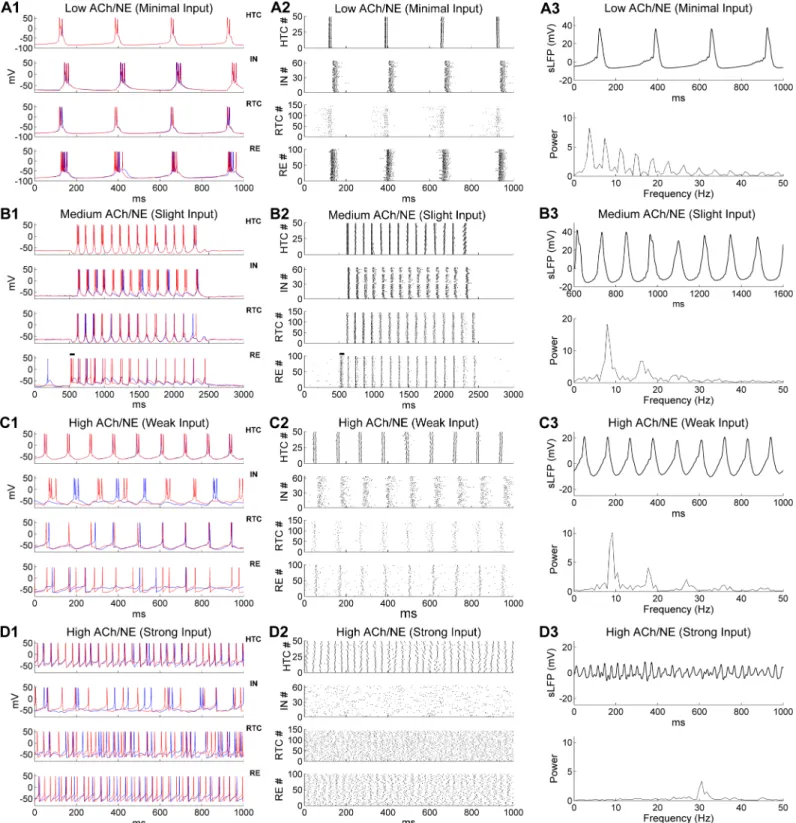
oscil-lation, all four types of neurons fired low-threshold bursts (LTBs) at membrane potentials lower than or close to -70 mV and were well synchronized (Fig 2A1). Some additional firing of RTC cells was observed before the start of eachδcycle but not later in the cycle due to inhibition from both IN and RE neurons (Fig 2A2,lower middle). The inter-burst frequency (3.7 Hz) was close to the spontaneous LTB frequencies of isolated TC cells in the low ACh/NE modulation state (S1 Fig), suggesting thatδoscillation was predominantly generated by the intrinsic burst-ing properties of TC neurons under hyperpolarized condition [29,31]. Both the IN and RE neu-rons fired strong bursts of action potentials following HTC and RTC cells as they received excitatory inputs from TC neurons. IN and RE inhibition did not produce rebound bursting in TC cells because of the hyperpolarized membrane potential (around -82 mV). The highly syn-chronized network activity gave rise to strong simulated local field potential (sLFP) oscillation at the same bursting frequency (3.7 Hz;Fig 2A3,top;spectrogram,bottom). Thereforeδ oscilla-tions can be generated locally in the thalamus during low ACh/NE modulation in case of low levels of afferent excitation, a physiological condition achieved during deep sleep [19].
Spindle oscillations. In the network condition simulating light sleep (i.e., NREM 2), we
increased both the ACh/NE modulation level (i.e., medium ACh/NE modulation) and the ran-dom background input (Table 1). With increased ACh/NE modulation, the potassium leak conductance in TC cells decreased (Table 1). As a result the membrane potential of TC cells was less hyperpolarized and thus they no longer generated LTBs (due to inactivation of the low-threshold T-type Ca2+current at a resting potential between -62 and -65 mV;Fig 2B1,top
and lower middle), in line with the simulation results of isolated TC neurons (S1 Fig). Under
such condition, when RE neurons were activated by a transient afferent input (100 ms× 100 pA, simulating a cortical UP state, indicated by the horizontal bars inFig 2B1 and 2B2), a train of oscillation cycles were triggered that lasted for about 2 seconds (Fig 2B1), resembling tha-lamic spindles during light sleep [2,33]. Transient activation of RE neurons hyperpolarized both HTC and RTC cells, producing rebound LTBs which in turn drove IN and RE burst firing that then initiated the next oscillation cycle. This back-and-forth interaction ended when RE firing eventually failed to evoke rebound LTBs in TC cells due to short-term synaptic depres-sion (Fig 2B1; also see below). At a population level, all four types of model neurons were highly synchronized during spindle oscillations (Fig 2B2). Compared with theδoscillations, the number of spikes per burst in RE neurons was greatly reduced due to depolarization of membrane potentials with decreased potassium leak conductance (compareFig 2B2withFig
2A2,bottom). Also, random sparse spontaneous RE firing was not able to trigger spindle
oscil-lations as it was not strong enough to hyperpolarize TC cells to evoke rebound bursting (Fig
Table 1. Model parameters for different oscillatory states.
ACh/NE Level Network Condition Oscillatory State gKL(mS/cm2) (nS) ginput(nS)
HTC & RTC IN RE HTC & RTC IN RE
Low Deep sleep δ 0.035
(10.2)
0.01 (1.7)
0.03 (4.3) 0.1 0.1 0.1
Medium Light sleep Spindle 0.01
(2.9)
0.015 (2.6) 0.02 (2.9) 0.3 0.3 0.3
High Awake
(eyes closed)
α 0.0
(0.0)
0.02 (3.4)
0.01 (1.4) 1.5 1.5 1.5
Awake
(eyes opening + attention)
γ 0.0
(0.0)
0.02 (3.4)
0.01 (1.4) 17 1.5 1.5
Fig 2. Generation of multiple distinct oscillations in the thalamic network model under three different levels of ACh/NE modulation and four different levels of afferent excitation. The parameters used in different oscillatory states are shown inTable 1. (A) Generation ofδoscillations in the low ACh/NE modulatory state and with minimal afferent excitation. (A1) Voltage traces of two representative HTC, IN, RTC and RE cells each. (A2) Spike rastergrams of HTC, IN, RTC and RE cells. (A3) Simulated LFP (top) with associated frequency power spectrum (bottom). (B) Generation of spindle oscillations in the medium ACh/NE modulatory state and with slight afferent excitation. The black horizontal bars in (B1-B2) indicate the injection of a transient current input (100 ms×100 pA) into RE neurons to trigger spindle oscillations. (C) Generation ofαoscillations in the high ACh/NE modulatory state and with weak afferent excitation. (D) Generation ofγoscillations in the high ACh/NE modulatory state and with strong afferent excitation.
2B2, first and last 500 ms). Thus, spindle oscillation was a result of both intrinsic properties of TC cells (rebound bursts after hyperpolarization;S1 Fig) and network interaction (TC-RE interplay). The simulated LFP exhibited strong periodicity with an oscillation frequency of 7.9 Hz (Fig 2B3), within the spindle frequency range (7–15 Hz; [20]). Our simulation results are consistent with a number of experimental findings: (1) spindle oscillations occur at more depolarized membrane potentials (between -65 and -55 mV) of TC cells thanδoscillations (−68 and −90 mV; [31]); (2) spindle oscillations are generated by synaptic interaction of TC and RE neurons [2,3,34]; and (3) stimulation of cholinergic release suppressesδoscillations by depolarizing TC neurons [29].
Since the effects of NE on INs are not known [25,26], we considered the modulatory effect of ACh only (on INs) in the above simulation (i.e., increase ofgKLfromδto spindle oscilla-tions;Table 1). To account for other possible effects of NE on INs, we either fixedgKL(the excitatory effect of NE counteracts the inhibitory effect of ACh) or decreasedgKL(the excit-atory effect of NE overcomes the inhibitory effect of ACh) during the transition from deep sleep to light sleep. We found that both the duration and power of spindle activity increased slightly ifgKLwas fixed at 0.01 mS/cm
2
(controls: 0.015 mS/cm2) as IN bursting became more robust (S4B Fig). By comparison, ifgKLdecreased to 0.005 mS/cm2, the spindle duration and power reduced slightly because the high level of uncorrelated IN background spiking substan-tially suppressed RTC bursting (S4C Fig). Overall, spindle oscillations were not significantly affected by considering other possible NE effects on INs.
Alpha oscillations. We modeled the increased ACh/NE levels of the waking state by
completely blocking the potassium leak current in TC cells, reducing it in RE neurons, and increasing it in INs (Table 1). The synaptic weight of the random Poisson inputs to the net-work also increased considerably from the light sleep stage (from 0.3 nS to 1.5 nS;Table 1), simulating an overall increase of random background inputs in the awake state. With these parameter values, the thalamic network displayed prominentαoscillations (Fig 2C). Similar to isolated HTC cells in the high ACh/NE modulation state (S1 Fig), HTC cells in the network generated high-threshold bursts (HTBs) in theαfrequency band and were highly synchro-nized because of gap junctions (Fig 2C1,top; [12,17]). The synchronized HTBs strongly excited INs and produced corresponding HTBs in INs (Fig 2C1,upper middle). Subsequently, these HTBs in the INs provided pronounced phasic inhibition on RTC cells. Once recovered from IN and RE inhibition, RTC cells fired single action potentials (APs) at relatively depolar-ized membrane potentials (>-65 mV) and were strongly synchronized (Fig 2C1,lower mid-dle). The synchronized HTC/RTC inputs drove correlated firing in RE neurons that provided feedback inhibition to both HTC and RTC cells (Fig 2C1,bottom). At the population level, a high level of synchrony was observed in all four types of neurons in the network (Fig 2C2). Of note, both HTC and IN neurons fired bursts of APs whereas both RTC and RE neurons fired tonic spiking (Fig 2C1 and 2C2). The sLFP showed strong rhythmic structure (Fig 2C3,top) and the frequency power spectrum revealed a dominant peak at 9.2 Hz (Fig 2C3,bottom), close to theαfrequency (8.9± 1.2 Hz) recorded from freely moving cats during natural wake-fulness [18]. Hence, our simulation results are consistent with recent experimental observa-tions that thalamicαoscillations are mediated by high-threshold bursting of HTC cells under muscarinic cholinergic receptor activation [17,18]. Moreover, a high level of phase locking between RE spikes andαrhythm was not required for coherentαoscillations (S7 Fig; [18]) while blocking the gap junctions among TC cells (HTC-HTC & HTC-RTC connections) seri-ously disrupted theαrhythm in the thalamic network (S8 Fig), as observed experimentally [12,35].
(gKL= 0.01 mS/cm2), RTC activities were suppressed considerably compared to controls (gKL= 0.02 mS/cm2) due to substantial increase of spontaneous IN firing (S5B Fig). Consequently, the oscillation power decreased moderately (S5B Fig). On the other hand, if the potassium leak conductance in INs was reduced to 0 mS/cm2due to NE action, the high level spontaneous fir-ing of INs almost completely suppressed RTC responses leadfir-ing to little RE activities. Without effective RE feedback inhibition, HTC cells switched from bursting to single spiking or became inactive because of the inactivation of the high-threshold T-type Ca2+channel (S5C Fig). As a result, theαoscillation was seriously disrupted. Thus, the model predicts that inhibition of INs by ACh and/or NE will increase the robustness ofαoscillations.
Gamma oscillations. In the high ACh/NE modulation state, when the maximal synaptic
conductance of the random Poisson inputs to TC cells was substantially increased (from 1.5 nS duringαoscillations to 17 nS;Table 1) to mimic the condition of eyes opening and addi-tional intracortical input during focused attention, endogenousαoscillations in the thalamic network gave way toγoscillations (Fig 2D). With much stronger synaptic excitation, the aver-age firing rates of both HTC and RTC cells increased substantially (HTC,α: 18.6 Hz,γ: 31.4 Hz; RTC,α: 3.9 Hz,γ: 26.4 Hz;Fig 3A). Notably, HTC cells switched from HTBs (duringα oscillations) to tonic spiking while remaining well synchronized because of the gap junction connections (Fig 2D1 and 2D2,top; alsoFig 3B). In contrast, synchrony was not detectable in either the RTC voltage traces (Fig 2D1,lower middle) or spike rastergram (Fig 2D2,lower mid-dle), demonstrating that the firing of RTC cells started to lose rhythmicity as the random inputs greatly increased (Fig 3B). Different fromαoscillations, INs fired a mix of single spikes
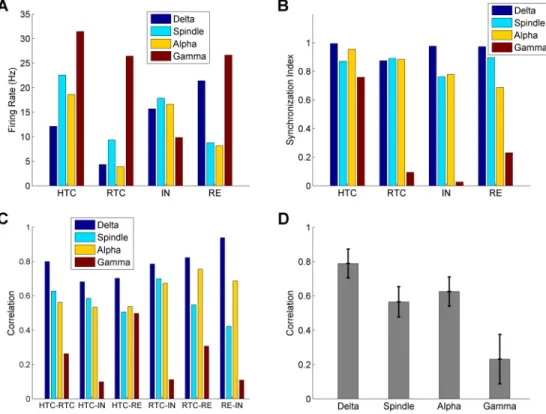
Fig 3. Quantification of thalamic network activity during four oscillatory states (δ, spindle,αandγ
oscillations). Average firing rates of HTC, RTC, IN and RE neurons across four oscillatory states. (A)
Synchronization index of HTC, RTC, IN and RE neurons across four oscillatory states (B) Cross-correlation between different groups of thalamic neurons during four oscillatory states. (C) Average cross-correlation of six pairs of neuronal groups (C) during four oscillatory states. Error bars indicate standard deviation.
and bursts in a random fashion (Fig 2D1 and 2D2,upper middle). This was because compared with HTBs, single HTC spikes were less potent in driving IN bursts and with higher HTC fir-ing rates, the strength of the HTC!IN synapses was reduced more by short-term depression (STD). Indeed, the IN spikes became synchronized and phase-locked to theγrhythm when the STD at the HTC!IN synapses was removed (S9 Fig). As the excitatory inputs from HTC and RTC cells increased, the average firing rate of RE neurons also went up considerably (α: 8.2 Hz;γ: 26.7 Hz;Fig 3A). Unlike INs, weak synchrony was still observed in RE voltage traces (Fig 2D1,bottom) and the population spike rastergram (Fig 2D2,bottom), owing to inter-RE gap junctions and inhibition. With reduced network synchronization, the amplitude of the sLFP oscillations decreased substantially compared with lower frequency oscillations (δ, spin-dle andα) (compareFig 2D3withFig 2A3–2C3,top). The frequency power spectrum revealed a dominant peak at 30.5 Hz, within the low gamma frequency band (Fig 2D3,bottom). Our simulation results are in agreement with experimental data that TC cells are capable of gener-ating fast rhythmic spiking activities inγfrequency band in response to strong depolarizing inputs [11,27,36]. In particular, the depolarization-induced transition from high-threshold bursting to high-frequency tonic spiking in HTC cells closely matches the experimental data (see Fig 2B of [27]). In addition, if the synaptic drive to TC cells reduced, the thalamic network oscillated at a lower frequency in theβband (e.g., 23.2 Hz;S10 Fig). This suggests that thalamic βandγoscillations may share the same cellular mechanism and they constitute a continuous range of “fast” oscillation frequency dependent on depolarization, as suggested experimentally [37]. Lastly, there was little change inγoscillation frequency or power when the potassium leak conductance in INs was maintained at the level used to model deep sleep (gKL= 0.01 mS/ cm2) or blocked completely (gKL= 0.0 mS/cm2), though IN spikes became more synchronized with reduced level of the potassium leak current (S6 Fig). This suggests that altering the potas-sium leak current in INs has differential effects on different oscillatory states (see above).
Quantification of thalamic network activity during four oscillatory states
To quantify the network activity during the four oscillatory states, we calculated the average firing rates and synchronization index of four different groups of thalamic neurons (HTC, RTC, IN & RE,Fig 3A and 3B) along with the correlation between different neuronal popula-tions (Fig 3C and 3D). Overall, the average firing rates of RTC cells were lower than HTC cells for all oscillatory states, because RTC cells were less excitable than HTC cells due to a much smaller high-threshold T-type Ca2+current (ICa/HT,S1 Table). In addition, RTC cells received
larger potassium leak conductance (Table 1); (2) INs received inputs from HTCs only while REs received inputs from both HTC and RTC cells (Fig 1A). Consequently, the large increase in RTC firing duringγoscillations led to substantial increase in RE spikes; (3) HTC cells switched from HTBs duringαoscillations to tonic spiking duringγoscillations, which reduced the effectiveness of excitatory drive on INs, as mentioned earlier. Combined with STD, INs switched from strong bursting to irregular mix of bursting and tonic spiking (compareFig 2C1withFig 2D1,upper middle). As a result, the IN firing rate reduced duringγoscillations compared withαoscillations.
The generation of distinct oscillations in the thalamic network depends on synchronization of different neuronal populations. To evaluate the degree of neuronal synchrony in the tha-lamic network, we calculated the synchronization index (SI) of the four neuronal populations during different oscillatory states (Fig 3B). TheSIof both HTC and RTC cells maintained at relatively high level duringδ, spindle andαoscillations (>0.87;Fig 3B). Duringγoscillations, theSIof RTC cells substantially decreased to 0.09, while that of HTC cells only slightly reduced to 0.76 (Fig 3B) because of gap junctions. TheSIof INs decreased moderately fromδto spin-dle/αoscillations and reduced greatly duringγoscillations (δ: 0.98; spindle: 0.76;α: 0.78;γ: 0.03;Fig 3B). Similarly, theSIof REs showed a decreasing trend fromδtoγoscillations, but the reduction duringγoscillations was smaller (δ: 0.97; spindle: 0.90;α: 0.69;γ: 0.23;Fig 3B) due to the inter-RE gap junctions and inhibition. These results indicate that the thalamic net-work had the highest level of synchrony duringδoscillations followed by spindle andα oscilla-tions and the synchronization level was the lowest duringγoscillations.
We next computed the cross-correlation between different groups of neuronal populations during the four oscillatory states (Fig 3C). First, the correlation was consistently highest during δoscillations and lowest duringγoscillations for all six neuronal population pairs. Second, the correlation during spindle oscillations was either comparable to (e.g., HTC-RTC) or moder-ately lower than (e.g., RTC-RE)αoscillations (Fig 3C). Lastly, the correlation between HTC cells and RE neurons duringγoscillations was substantially higher than other population pairs (Fig 3C), consistent with higher level of synchrony of these two neuronal assembles duringγ oscillations (Fig 3B). On average, the neuronal correlation was largest duringδoscillations fol-lowed byαand spindle oscillations and the correlation was lowest duringγoscillations (Fig 3D).
Overall, as the ACh/NE modulation level and synaptic input increased, the thalamic net-work switched from low frequency oscillations (δoscillations) to higher frequency oscillations (spindle andαoscillations), and to fast frequency oscillations (γoscillations). Correspond-ingly, the membrane potentials of TC neurons gradually depolarized and the firing patterns of HTC cells switched from LTBs to rebound LTBs to HTBs and to tonic spiking, while those of RTC neurons changed from LTBs to rebound LTBs and to tonic spiking. Hence, with minimal change of parameters (the potassium leak conductance and the synaptic input strength;
Table 1), the thalamic network was able to generate multiple distinct and stable oscillatory states that appear under different behavioral and cognitive conditions [2,18,19,22,23]. Next, we dissected the cellular and circuit mechanisms for each oscillatory state by manipulating the major network connectivity and varying key model parameters.
Delta oscillations are synchronized by both gap junctions and synaptic
inhibition
because of intrinsic heterogeneity (i.e., different leak conductance) and external noise input (Fig 4A,top). It also reduced RTC synchrony through the HTC-RTC gap junctions (compare
Fig 4AwithFig 2A2,lower middle). Consequently, after a few partially synchronizedδcycles, both HTC and RTC cells broke into two subpopulations separated by the IN and RE inhibi-tion. In one cycle, a majority of HTC cells burst with a small percentage of RTC cells while in the next cycle, a majority of RTC cells burst with a small percentage of HTC cells (Fig 4A). As a result, the network oscillation frequency doubled to about 6.7 Hz (S11 Fig). Interestingly, if the HTC-RTC gap junctions were additionally removed, the frequency doubling effect was not observed (Fig 4B) and the network oscillation frequency just slightly increased to about 4 Hz (S11 Fig). Although theδrhythm was maintained without any TC gap junctions, the degree of network synchrony was substantially reduced compared with the control condition (compare
Fig 4BwithFig 2A2).
To examine the role of synaptic inhibition in thalamic network synchronization, we first blocked the HTC!IN projections to remove the feedforward IN inhibition on RTC cells (gap junctions intact). We found that RTC cells remained well synchronized (Fig 4C). We next blocked the TC!RE connections to eliminate the RE feedback inhibition on TC cells. Simi-larly, RTC bursting was still well phase-locked to theδrhythm (Fig 4D). If, however, both the HTC!IN and TC!RE connections were blocked, RTC bursts became largely desynchro-nized, except the subset of RTC cells that formed gap junctions with HTC cells (Fig 4E). This suggests that either IN or RE inhibition is required for the synchronization of RTC cells. Lastly, when the HTC-RTC gap junctions were additionally removed (besides IN and RE inhibition), RTC bursting became completely desynchronized (Fig 4F). Therefore, thalamicδoscillations Fig 4. Thalamicδoscillations are synchronized by both gap junctions and synaptic inhibition from IN and RE neurons. (A) Rastergrams of HTC,
IN, RTC and RE cells when the gap junctions among HTC cells are removed. (B) Gap junctions among HTC cells and between HTC and RTC cells are removed. (C) Projection from HTC cells to IN neurons is removed. (D) Projection from TC cells to RE neurons is removed. (E) Projection from TC cells to both IN and RE neurons is removed. (F) Projection from TC cells to both IN and RE neurons is removed and the gap junctions between HTC and RTC cells are blocked.
are generated intrinsically by TC cells and are synchronized by both gap junctions and synap-tic inhibition.
Spindle oscillations are mainly generated through TC-RE interaction
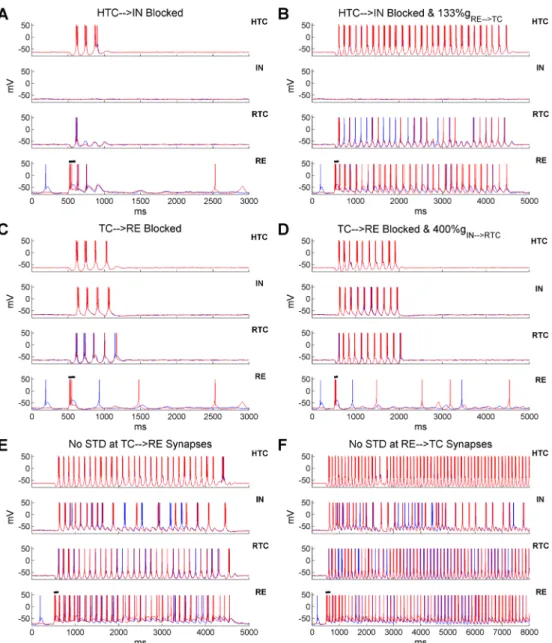
In the thalamic network, spindle oscillations were triggered by transient synchronized RE burst firing which produced rebound LTBs in TC cells. Besides RE inhibition, RTC cells also received IN inhibition which could elicit rebound LTBs. To differentiate the role of IN and RE inhibition in spindle oscillations, we blocked the HTC!IN and TC!RE projections, respec-tively, to eliminate IN and RE bursts. When IN burst firing was removed, HTC and RTC cells fired only three and one bursts respectively (Fig 5A), indicating that IN inhibition contributed to spindle oscillations by hyperpolarizing RTC cells. Nevertheless, the lack of IN inhibition could be easily compensated by increased inhibition from RE neurons. In the absence of IN inhibition, when the inhibitory RE!TC synaptic weight increased only 33% (from 3 nS to 4 nS), spindle oscillations persisted for about 4 seconds, twice the duration of the control case (compareFig 5BwithFig 2B1). Thus, with sufficient RE inhibition, the TC-RE feedback loop was able to create and sustain spindle oscillations for a few seconds. On the other hand, when the TC!RE synapses were blocked, the TC-IN network generated four cycles of spindle oscil-lations before termination (Fig 5C). This was because the IN bursts hyperpolarized RTC cells resulting in rebound RTC bursts. At the same time, RTC hyperpolarization facilitated rebound bursts in HTC cells through the HTC-RTC gap junctions, which further drove IN bursting. Nevertheless, in the absence of RE inhibition, the inhibitory IN!RTC synaptic weight needed to increase fourfold (from 3 nS to 12 nS) in order to sustain spindles for about 1.5 seconds (Fig 5D). This contrasted to a much more prominent increase in spindle duration induced by a much smaller increase of the RE!TC synaptic weight (compareFig 5DwithFig 5B). Such dif-ference suggests that RE inhibition plays a more major role than IN inhibition in generating spindle oscillations, consistent with experimental data [3,20,38].
Similar to the effect of increased RE!TC synaptic weight, when the TC!RE synaptic weight increased 50% (AMPA: from 4 nS to 6 nS; NMDA: from 2 nS to 3 nS), RE neurons responded to TC inputs with more burst spikes and the duration of spindle oscillations increased substantially from about 2 seconds to 3.8 seconds (S12 Fig). Hence, spindle duration was fine-tuned by the strength of RE inhibition. As RE inhibition gradually decreased over the course of spindles due to short-term depression (STD), we hypothesized that removing STD at the TC!RE or RE!TC synapses could significantly extend or even sustain spindles indefi-nitely. Indeed, when STD at the TC!RE synapses was removed, spindle oscillations were sus-tained for about 4 seconds (Fig 5E), whereas they continued beyond 7 seconds when STD at the RE!TC synapses was abolished (Fig 5F). Thus in our model, spindle oscillations are ter-minated mainly by STD at the inhibitory RE!TC synapses, as suggested previously [39]. Our results are consistent with a recent experimental study showing that the duration of spindle oscillations depends critically on the inhibitory strength of RE neurons on TC cells [38]. More-over, it suggests that the variable spindle duration observed in experiments may be a result of difference in RE excitability and heterogeneous synaptic strength between TC and RE neurons.
Thalamic
α
oscillations are sculpted by high-threshold bursting dynamics
of HTC cells
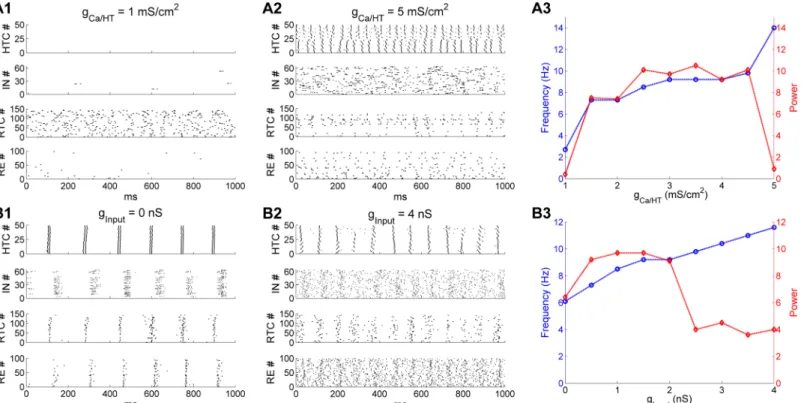
(gCa/HT) in HTC cells from 1 mS/cm2to 5 mS/cm2(default: 3 mS/cm2). When gCa/HTwas
reduced to 1 mS/cm2, HTC cells failed to produce HTBs (Fig 6A1,top). With a lack of excitation from HTC cells, IN neurons were mostly silent (Fig 6A1,upper middle). In the absence of feed-forward inhibition from IN neurons, RTC cells fired random spontaneous activities at about 3 Hz without synchronization (Fig 6A1,lower middle). As a result, theαrhythm disappeared. On the other hand, when gCa/HTwas increased to 5 mS/cm2, depolarized HTC cells started to
tran-sition from the bursting mode to the tonic spiking mode and became desynchronized because Fig 5. Spindle oscillations are mainly generated through the TC-RE interaction and the spindle duration is tightly regulated by RE inhibition. (A) Voltage traces of two representative HTC, IN, RTC and
RE cells each when the excitatory inputs from HTC cells to IN neurons are blocked. Black horizontal bar indicates the presence of transient current injection (100 ms) into RE neurons to trigger spindles (same for below). (B) Excitatory inputs from HTC cells to IN neurons are blocked and the maximal synaptic conductance of the inhibitory RE!TC synapses increased 33% (from 3 nS to 4 nS). (C) Excitatory inputs from TC cells to RE neurons are blocked. (D) Excitatory inputs from TC cells to RE neurons are blocked and the maximal synaptic conductance of the inhibitory IN!RTC synapses increases fourfold (from 3 nS to 12 nS). (E) STD at the TC!RE synapses is blocked. (F) STD at the RE!TC synapses is blocked.
of strong heterogeneous bursting dynamics (Fig 6A2,top). Consequently, INs fired random bursts (Fig 6A2,upper middle) and suppressed the activity of RTC cells (Fig 6A2,lower middle). As a result, no synchronizedαoscillations developed. These simulation results demonstrated that synchronized HTBs of HTC cells were essential for the generation of thalamicα oscilla-tions, consistent with experimental observations [12,17].Fig 6A3plots the network oscillation frequency (blue) and the spectral peak power (red) as a function of gCa/HT. When gCa/HT
increased from 1.5 to 4.5 mS/cm2, the oscillation frequency moderately increased from 7.3 Hz to 9.8 Hz while the oscillation power remained relatively stable. At the values of 1 and 5 mS/ cm2, there was a large drop in oscillation power because no synchronizedαoscillations
occurred. Hence, thalamicαoscillations are limited to a relatively narrow frequency band (8–10 Hz) where HTC cells fired robust high-threshold bursting.
The HTB frequency of HTC cells is also dependent on the depolarization level (S1 Fig; [7,17]). As such, changing the external drive to the network would alter the frequency ofα oscillations. Indeed, when the random afferent inputs were removed from the thalamic net-work, HTC cells still fired spontaneous synchronized HTBs, but at a lower frequency (6 Hz;
Fig 6B1,top). Subsequently, the whole network was synchronized at about 6 Hz (Fig 6B1), which was within theθ frequency band. One the other hand, when the maximal synaptic input conductance to the whole network increased to 4 nS (default: 1.5 nS), the HTB fre-quency of HTC cells increased to about 12 Hz, but there was only one spike per burst (Fig 6B2,top) due to inactivation of theICa/HTcurrent. The random activity of both IN and RE
neurons increased substantially because of reduced synchronized HTC excitation and Fig 6. Thalamicαoscillations are sculpted by the high-threshold bursting dynamics of HTC cells. (A) Effect of varying the maximal conductance
density of the high-threshold T-type Ca2+current (gCa/HT) in HTC cells. (A1) Spike rastergrams of HTC, IN, RTC and RE cells when gCa/HTis reduced to 1
mS/cm2. (A2) gCa/HTis increased to 5 mS/cm 2
. The default value is 3 mS/cm2. (A3) Dominant network oscillation frequency (blue) and spectral peak power (red) when gCa/HTvaries from 1 mS/cm2to 5 mS/cm2. (B) Effect of varying the maximal input conductance to all thalamic cells. (B1) Spike rastergrams of
HTC, IN, RTC and RE cells when the maximal input conductance is reduced to 0 nS. (B2) Maximal input conductance increases to 4 nS. The default value is 1.5 nS. (B3) Dominant network oscillation frequency (blue) and spectral peak power (red) when the maximal input conductance varies from 0 nS to 4 nS.
increased random input drive, which substantially suppressed RTC firing (compareFig 6B2
withFig 2C2,lower middle). As a result, theαoscillation power was significantly reduced (Fig 6B3). The network oscillation frequency (blue) and power (red) as a function of the maximal input conductance (ginput) are shown inFig 6B3. As ginputincreased from 0 to 4
nS, the oscillation frequency increased monotonically from 6.1 Hz to 11.6 Hz. By compari-son, the oscillation power increased initially from 0 nS to 0.5 nS and stayed in the same level for values up to 2 nS before decreasing considerably for larger input strength. Therefore, reducing the excitatory drive to the thalamic network switchedαoscillations toθ oscilla-tions while increasing the excitation level moved it to the upperαfrequency band, consis-tent with experimental observation that HTC cells could underlie bothαandθ oscillations dependent on the depolarization level of HTC cells [7,12]. Nevertheless, although stronger depolarization of HTC cells increasedαfrequency, it reduced theαpower by switching high-threshold bursting to tonic spiking (Fig 6A2 and 6B2). Consequently, thalamicα oscil-lations exhibit optimal power between 8–10 Hz (Fig 6A3 and 6B3). Our results thus explain whyαoscillations decrease with more afferent excitation (e.g., eyes opening; [30]).
HTC gap junctions are required for thalamic
γ
oscillations in the absence
of strong RE feedback inhibition
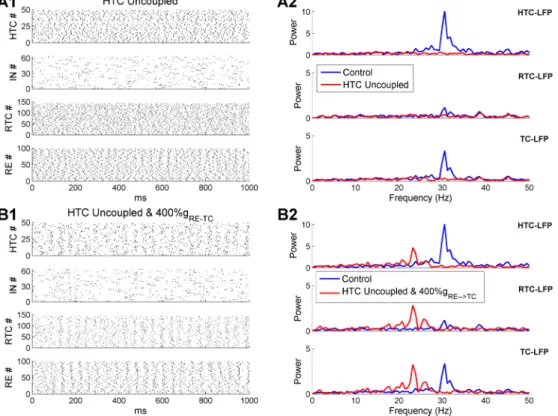
The key forγoscillations was that HTC cells maintained a high level of synchrony even in the pres-ence of strong random afferent inputs (Fig 2D2,top). The HTC rhythmicity was propagated to RE neurons via excitatory projection and to RTC cells via gap junctions. RE synchrony was boosted by inter-RE gap junctions and inhibition, which moderately constrained RTC firing through the RE!RTC inhibitory synapses. If the gap junctions between HTC cells were removed duringγ oscillations, HTC cells were completely desynchronized (Fig 7A1,top) leading to unconstrained RE and RTC firing (Fig 7A1,lower middle and bottom). As a result, the sLFP spectral peak of either HTC or RTC cells was eliminated (Fig 7A2). Thus, gap junctions may play a critical role in syn-chronizingγoscillations in the thalamus, as in the hippocampus [40] and neocortex [41].
Besides gap junctions, the negative feedback loop between excitatory (e.g., pyramidal cells) and inhibitory neurons also plays an important role in fast oscillation synchronization [42,
43]. To examine whether the feedback interaction between TC and RE cells could sustainγ oscillations as well, we increased the maximal RE!TC synaptic conductance fourfold (default: 3 nS; 4-fold increase: 12 nS) in the absence of HTC gap junction coupling. With much stronger RE inhibition, moderate degree of population rhythmicity emerged from the HTC, RTC and RE neurons (Fig 7B1). The sLFP frequency spectra revealed peaks of similar amplitude as con-trols, but at a lower frequency (controls: 30.5 Hz; 4-fold increase of RE inhibitory strength: 23.2 Hz;Fig 7B2) because of increased RE inhibition. Also, without HTC gap junctions, the amplitude of spectral peaks was similar for both HTC and RTC cells since they had similar degree of spike synchronization (Fig 7B1,top and lower middle). This was in contrast to the control case where the spectral peak of HTC-sLFP was much higher than that of RTC-sLFP (Fig 7B2). As a slight increase of the RE inhibitory synaptic weight significantly prolongs spin-dle oscillations (Fig 5B), such strong RE feedback inhibition (i.e., 4-fold increase of synaptic strength) seems unlikely in the thalamic network. Therefore, we conclude that HTC gap junc-tions are required for the synchronization of thalamicγoscillations.
Oscillatory state transition as a function of ACh/NE modulation and
afferent excitation
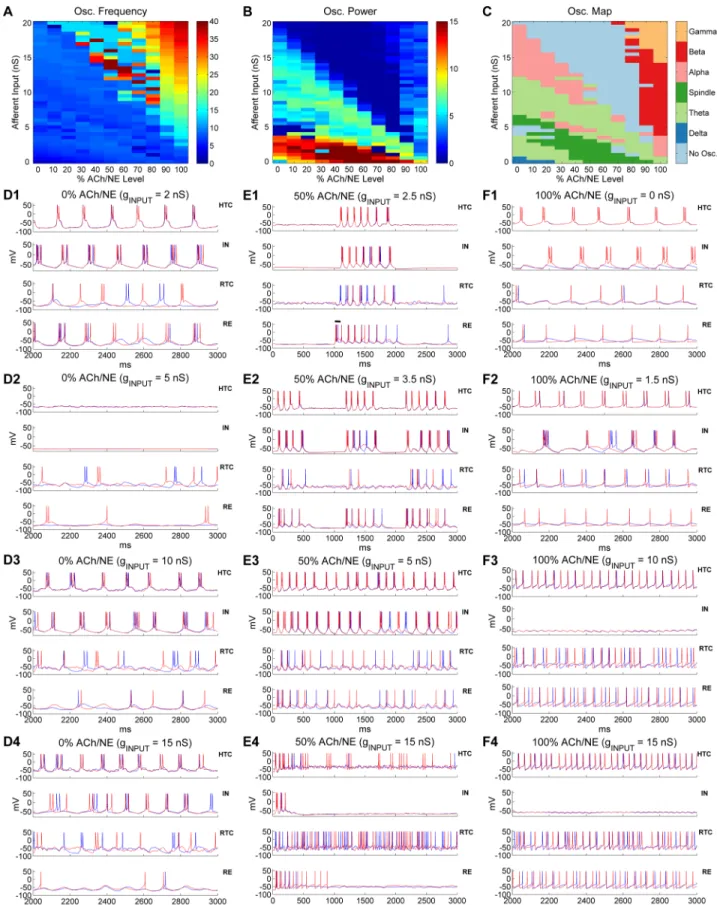
how the thalamic network transitions from one state to the other on a continuous basis, we divided the ACh/NE modulation into 11 levels evenly ranging from 0% to 100% and varied the maximal input conductance to TC cells from 0 up to 20 nS with a 0.5 nS step, which resulted in 451 different parameter combinations (seeMethodssection). We then simulated the tha-lamic network with all possible combinations of ACh/NE and input levels and identified the oscillatory state of the network across the entire parameter space. The network oscillation fre-quency and spectral power heat maps are shown inFig 8A and 8Brespectively. The networks with higher oscillation frequency (>15 Hz) were predominantly located above the principal diagonal of the 2D parameter space (Fig 8A) indicating that the network oscillated faster with higher levels of ACh/NE modulation and afferent excitation. The highest oscillation frequency with the maximal level of ACh/NE (100%) and input (20 nS) was 38 Hz (note some oscillation frequencies close to 40 Hz right above the principal diagonal, but these network states were classified as non-oscillatory due to low oscillation power; see below). By comparison, the net-works with higher oscillation power were primarily located below the principal diagonal with the maximal power residing in the bottom of the 2D space, corresponding to weak afferent excitation (Fig 8B). This suggests that oscillations driven minimally by the afferent input (e.g., spindle oscillations) are stronger than oscillations driven mostly by afferent excitation (e.g.,γ oscillations). In addition, the oscillation power was minimal (<1) above the principal diagonal except for high levels of ACh/NE modulation (>70%).
Fig 7. HTC gap junctions are required for thalamicγoscillations in the absence of extra-strong feedback RE inhibition. (A) Thalamicγoscillations are eliminated when the gap junctions among HTC cells are removed. (A1) Spike rastergrams of HTC, IN, RTC and RE cells. (A2) Frequency power spectrum of sLFP from HTC cells (top), RTC cells (middle) and combined HTC and RTC cells (bottom) in the control (blue) and HTC uncoupled (red) conditions, respectively. (B) The RE!TC synaptic weight needs to increase four-fold to generate similarγoscillations in the absence of gap junctions among HTC cells. (B1-B2) As (A1-A2), but with fourfold increase of the RE!TC synaptic weight.
Fig 8. Oscillatory state transition as a function of ACh/NE modulation and afferent input. (A)Oscillation frequency heat map as a
Next, we determined the oscillatory state of the thalamic network under all examined com-binations of ACh/NE and input levels and plotted the prominent oscillatory regimes across the entire parameter space (Fig 8C). Consistent with our modeling hypothesis (Fig 1B) and pervi-ous analysis, we observed slowδoscillations with low ACh/NE modulation (<30%) and mini-mal afferent excitation (<1 nS), spindle oscillations with medium ACh/NE modulation (20%-80%) and relatively weak afferent input (<5 nS), andα,βandγoscillations under high ACh/ NE modulation (>70%) with weak, moderate and strong inputs respectively (Fig 8C). The spindle oscillations under medium ACh/NE modulation were induced by a transient input to RE neurons as mentioned above (e.g.,Fig 8E1) and the spindle regime moved to lower input area as the ACh/NE level increased (Fig 8C). For example, spindle appeared at 3 nS with 20% ACh/NE compared with 0 nS with 50% ACh/NE. This was because with low ACh/NE, TC cells fired spontaneous low-threshold bursts (LTBs) so higher afferent input was required to inactivate the low-threshold Ca2+current to generate the state that permitted the occurrence of spindles. By comparison, for higher ACh/NE levels (50%-90%), TC cells no longer gener-ated spontaneous LTBs and the network was relatively quiet without or with little afferent input (e.g.,Fig 2B1). In addition to the externally-induced spindles (e.g., triggered by a tran-sient input to RE neurons), we observed spontaneous spindle oscillations under low ACh/NE modulation (<30%) and with higher level of afferent input (4.5–6.5 nS;Fig 8C). Such sponta-neous spindle oscillations were induced spontasponta-neously by the random afferent input and usu-ally lasted for a few cycles (S13 Fig). Also, besidesαoscillations at high ACh/NE modulation (100%), there were prominentαoscillations under low or medium ACh/NE modulation (<60%) and with relatively large afferent input (>8 nS). This was because large random affer-ent input activated the high-threshold bursting dynamics in HTC cells (see below). The region of such low-modulationαoscillations shifted to lower input area and became narrower as the ACh/NE level increased (Fig 8C; pink area in the left side). There were also sporadicα oscilla-tions right above the region of spindles. During the transition fromδto spindles and from spindles toαoscillations, there existed two prominentθ oscillation regions (light green area): the first one appeared in the lower left corner while the second one started at higher input lev-els (7–12 nS) with 0% ACh/NE and gradually decreased to 0 nS with 100% ACh/NE, indicating lower afferent input was needed to drive the network toθ oscillations as ACh/NE increased. Besides the prime oscillatory regimes, there was also non-oscillatory area in the parameter map (light blue area inFig 8C) characterized by very low oscillation power (Fig 8B). The first major non-oscillatory region was relatively narrow and appeared between the low-inputθ oscillations and spontaneous spindle oscillations under low ACh/NE modulation (<30%). By comparison, the second major non-oscillatory region was much wider which occurred above the principal diagonal extending from 0% up to 80% ACh/NE. One important characteristic of this non-oscillatory region was that it started at the highest input level (20 nS) without ACh/ NE modulation (i.e., %0 ACh/NE) and expanded into lower input area as the ACh/NE modu-lation increased (Fig 8C, upper light blue area).
To understand the cellular basis of such oscillatory state transitions, we plotted the voltage traces of representative thalamic neurons with different afferent input drive at three levels of
afferent input. (C) Distribution of different oscillatory states as a function of ACh/NE modulation and afferent input. (D) Voltage traces of two representative HTC, IN, RTC and RE neurons each under low ACh/NE modulation (0%) at four different levels of afferent input (D1: 2 nS;
D2: 5 nS; D3: 10 nS; D4: 15 nS). (E) Voltage traces of two representative HTC, IN, RTC and RE neurons each under medium ACh/NE
modulation (50%) at four different levels of afferent input (E1: 2.5 nS; E2: 3.5 nS; E3: 5 nS; E4: 15 nS). The horizontal bar in (E1) indicates the injection of a transient current input (100 ms×100 pA) into RE neurons to trigger spindle oscillations. (F)Voltage traces of two representative HTC, IN, RTC and RE neurons each under high ACh/NE modulation (100%) at four different levels of afferent input (F1: 0 nS; F2: 1.5 nS; F3: 10 nS; F4: 15 nS). Note the scale difference in x axis between (E) and (D, F).
ACh/NE modulation (0%, 50% and 100%;Fig 8D–8F). As shown earlier, the thalamic network generated slowδoscillations (1–4 Hz) with minimal input (e.g., 0.1 nS) in the low ACh/NE condition (Fig 2A). When the afferent input slightly increased (e.g., 2 nS), the LTB frequency of TC cells increased to theθ band (4–8 Hz;Fig 8D1), which underlayθ oscillations. Thus, model simulation suggested that bothδandθ oscillations could be mediated by the LTBs of TC cells depending on the input. With further increase of the afferent drive (e.g., 5 nS), the network entered the non-oscillatory state where HTC cells stopped bursting and RTC cells burst sparsely (Fig 8D2). This was because as the membrane depolarization increased, the low-threshold T-type Ca2+current started to inactivate, reducing the intrinsic bursting dynamics of TC cells. Consequently, the spontaneous HTC bursts driven by random Poisson inputs were not able to induce synchronous bursts (only burstlets) but after-hyperpolarization in neighboring cells through gap junctions. As a result, the coupled HTC cells eventually became silent. Indeed, when the gap junctions were blocked, HTC cells were able to burst randomly (S14 Fig). When the afferent drive increased beyond 6.5 nS (e.g., 10 nS), HTC cells started to burst synchronously again owing to the activation of the high-threshold T-type Ca2+current and the bursting frequency went into theθ band again (7.3 Hz,Fig 8D3). As the afferent input increased further (e.g., 15 nS), the burst frequency of HTC cells rose to theαband (9.2 Hz,Fig 8D4). At the highest afferent input tested (20 nS), HTC cells switched from HTBs to spare tonic spiking because of inactivation of the high-threshold T-type Ca2+current and the net-work became desynchronized in the presence of strong random inputs (S15 Fig). To recapitu-late, at the lowest level of ACh/NE (0%), as the afferent input increased, the thalamic network switched from slowδoscillations to slowθ oscillations both mediated by the LTBs of TC cells. After a brief non-oscillatory state, the network exhibited spontaneous spindle oscillations fol-lowed byθ andαoscillations mediated by HTBs of HTC cells. The network eventually became desynchronized with strong afferent drive.
With medium level of ACh/NE modulation (50%), the thalamic network exhibited exter-nally- induced spindle activity for relatively weak input (0–3 nS;Fig 8E1, alsoFig 2B). The duration of spindles reduced with afferent excitation (S16 Fig) because depolarization
increased the inactivation of the low-threshold Ca2+current in TC cells making rebound LTBs less effective. Increasing the afferent input to 3.5 nS generated intermittentθ or spontaneous spindle-like oscillations with an oscillation frequency of 7.9 Hz (Fig 8E2). Specifically, the net-work driven by random Poisson inputs burst spontaneously for about 500 ms and stopped for about 500 ms before bursting again. Since the inter-burst interval (~500 ms) was relatively short, such network behavior was classified as intermittent or transientθ/αoscillations. When the afferent input further increased to 5 nS, the network generated continuous oscillations in theθ band (~ 6 Hz) which was mediated by HTBs of HTC cells (Fig 8E3). With large afferent drive (e.g., 15 nS), HTC cells switched from periodic HTBs to random sparse firing and the network became desynchronized (Fig 8E4). Similar to the non-oscillatory state in the low ACh/NE and high input condition (0% ACh/NE, 20 nS input;S15 Fig), the network desyn-chronization was caused by the inactivation of the high-threshold T-type Ca2+current in the presence of random input drive (i.e., the gap junctions were no longer able to synchronize HTC cells with sparse random spikes). Notably, with medium ACh/NE modulation, the net-work entered the desynchronizing state at a much lower input level (0% ACh/NE: 20 nS; 50% ACh/NE: 9.5 nS;Fig 8C). This was due to the fact that with higher ACh/NE, the high-threshold T-type Ca2+current started to inactivate at smaller input intensity. As a result, the non-oscil-latory state expanded into lower input region when the ACh/NE modulation increased (Fig 8C, upper light blue area).
cells. The bursting frequency increased toαband (8–14 Hz) when the afferent input slightly increased (e.g., 1.5 nS,Fig 8F2; similar toFig 2C1). With further increase of the afferent input (e.g., 10 nS), HTC cells switched from HTBs to tonic spiking and the network synchronized at theβfrequency band (23.8 Hz;Fig 8F3). With strong afferent excitation (e.g., 15 nS), the oscil-lation frequency of the thalamic network increased to theγband (31.7 Hz,Fig 8F4; similar to
Fig 2D1), which gave rise to potentialγoscillations. Note that INs had no spiking activities for medium or large afferent inputs (Fig 8F3 and 8F4,upper middle), different from defaultγ oscil-lations (Fig 2D1,upper middle). This was because INs did not receive direct afferent inputs in producing the oscillation map, while INs received weak afferent inputs (1.5 nS,Table 1) in the defaultγsimulation. In addition, different from the desynchronizing state under the low and medium ACh/NE conditions (S15 FigandFig 8E4), strong afferent drive did not disrupt net-work synchrony in the high ACh/NE condition (>80%;Fig 8F3 and 8F4). This was because HTC cells were much more excitable with high ACh/NE modulation and fired rhythmic spik-ing activities that were synchronized by gap junctions even when the high-threshold T-type Ca2+current was inactivated. Thus, the model suggests that fastβ/γoscillations only occur at high ACh/NE level in the thalamic network.
Responses of the thalamic network to periodic stimulation
frequency for all three oscillatory states (Fig 9A2–9C2,top; enclosed by red ellipses), suggesting that stimulation favored higher frequency entrainment. For example, primary entrainment occurred at 3–10 Hz during stimulation ofδoscillations (endogenous frequency: 3.7 Hz) and took place at 19–47 Hz during stimulation ofγoscillations (endogenous frequency: 30.5 Hz). Besides primary entrainment, thalamic network oscillations were also shaped by subharmonic as well as harmonic entrainment (indicated by blue, cyan and magenta ellipses,Fig 9A2–9C2,
top). The thalamic network activity during subharmonic entrainment ofαoscillations is illus-trated inFig 9B3. In response to 22 Hz stimulation, HTC cells burst at half of the stimulation Fig 9. Stimulation of LGN induces state-dependent entrainment and resonance in three oscillatory states. (A) Thalamic network dynamics during
stimulation ofδoscillations. (A1) Normalized color-coded frequency power spectrum of sLFP. (A2) Dominant network oscillation frequency (top) with normalized spectral peak (bottom) as a function of the stimulation frequency.(A3) Sample of thalamic network activity during stimulation. Stimulation amplitude is 0.2 nA. The bottom panel in (A3) displays the stimulation pulses and the stimulation frequency is 6 Hz. (B) Thalamic network dynamics during stimulation ofαoscillations. Stimulation frequency is 22 Hz for (B3). The vertical arrow in (B2) indicates oscillation suppression. (C) Thalamic network dynamics during stimulation ofγoscillations. Stimulation frequency is 35 Hz for (C3). Red ellipses in (A2-C2) indicate primary entrainment (1:1) and resonance, blue ellipses indicate the first subharmonic entrainment (2:1) and first harmonic resonance, cyan ellipses indicate the first harmonic entrainment (1:2) and first subharmonic resonance; magenta ellipses indicate the second harmonic entrainment (1:3) and second subharmonic resonance. The dotted horizontal lines in (A2-C2) indicate the normalized spectral peak without stimulation.
frequency (11 Hz) and the whole network synchronized at 11 Hz. By comparison, during (the first) harmonic entrainment ofγoscillations, HTC cells oscillated at twice the stimulation fre-quency (S17 Fig).
Stimulation of the LGN also induced resonance, an enhancement of oscillation power when the stimulation frequency was close to the endogenous frequency, its harmonics and/or subhar-monics. The thalamic neuronal activity during primary resonance is exemplified inFig 9C3. When the LGN was stimulated at 35 Hz, close to the endogenous frequency (30.5 Hz), the spik-ing activities of all four types of neurons became more synchronized and rhythmic than without stimulation (compareFig 9C3withFig 2D2). Resonance occurred in all three oscillatory states (Fig 9A2–9C2,bottom), but with substantial differences among the states. During stimulation of γoscillations, the primary resonance peak was much wider than that during stimulation ofδor αoscillations (compareFig 9C2withFig 9A2 and 9B2,bottom; enclosed by red ellipses), in line with much wider primary entrained frequency range during stimulation ofγoscillations. Nota-bly, similar to entrainment, resonance was asymmetric with respect to the endogenous fre-quency and favored higher frefre-quency stimulation. For instance, the primary resonance peak occurred at 5 and 6 Hz during stimulation ofδoscillations (Fig 9A2,bottom; enclosed by red ellipse) and 10 and 11 Hz during stimulation ofαoscillations (Fig 9B2,bottom; enclosed by red ellipse), both of which were higher than their respective endogenous frequencies (3.7 Hz and 9.2 Hz respectively). Such asymmetry was most prominent during stimulation ofγoscillations. Although the endogenousγfrequency was 30.5 Hz, stimulation induced maximal resonance (>60%) between 35 and 41 Hz (Fig 9C2,bottom; enclosed by red ellipse). The strong bias towards higher frequency in both entrainment and resonance suggests that stimulation increases the endogenous frequency of thalamic oscillations by enhancing the excitability of TC neurons. In addition to resonance enhancement, we observed substantial power suppression during high frequency (>25 Hz) stimulation ofαoscillations (Fig 9B2,bottom; indicated by black arrow), but not during the other two oscillatory states. This was because high frequency stimulation switched HTC bursting to tonic spiking and suppressed RTC activities by increas-ing IN firincreas-ing (S18 Fig). Overall, stimulation of the thalamic network induces state-dependent entrainment and resonance, which are stronger duringγoscillations thanδandαoscillations.
Discussion
Given the dominant focus on cortical circuits for the mechanistic study of brain oscillations, the thalamus has been somewhat overlooked, despite repeated suggestions that the thalamus may serve as a “pacemaker” of brain oscillations [7,8,45,46]. Indeed, recent experimental findings indicate that the thalamus plays a key role in controlling cortical states and function-ing [32,47,48] and regulating the information transmission between different cortical areas [49,50]. However, it is not clear whether the thalamus can independently generate different types of brain oscillations without interaction with the cortex. Answering this question will help to determine the validity of a thalamic pacemaker model. Using a biophysically realistic thalamic network model, we provided for the first time a full account of how multiple distinct oscillations could arise from the cellular and network properties of the thalamic circuitry and how thalamic oscillation transitions from one state to the another. This model then enabled us to investigate the state-dependent response to brain stimulation.
State-dependent oscillatory properties of TC cells underlie the genesis of
distinct thalamic oscillations
(S1 Fig). In the low ACh/NE modulation state, TC cells are sufficiently hyperpolarized to gen-erate low-threshold bursts (LTBs) in theδfrequency band mediated by the low-threshold T-type Ca2+current [51,52]. Such low-frequency LTBs form the neuronal basis ofδoscillations (Fig 10). In the medium ACh/NE modulation state, although TC cells are not spontaneously bursting, hyperpolarization of TC cells by afferent input or inhibition evoked rebound LTBs after the release of hyperpolarization [53,54]. Such hyperpolarization-induced rebound LTBs are necessary for spindle oscillations (Fig 10). In the high ACh/NE modulation state, HTC cells fire high-threshold bursts (HTBs) in theθ/αfrequency band that mediateθ orα oscilla-tions depending on afferent excitation level (Fig 10; [7,12]). Stronger depolarization of HTC cells by afferent input switches HTBs into high frequency tonic spiking enablingγoscillations (Fig 10). Such high frequency tonic spiking of TC cells was supported by experimental data that TC neurons exhibited fast oscillatory discharge in theγfrequency band in LGN (~50 Hz; [11]) and in the ventroanterior-ventrolateral (VA-VL) complex (20–40 Hz; [27]). Thus, the rhythmic burst/spiking properties of TC neurons provide the cellular mechanism underlying multiple distinct thalamic oscillations [55].
Thalamic network is endowed with multiple synchronizing mechanisms
To generate oscillations at the population level, the rhythmic burst firing or tonic spiking of TC neurons has to be synchronized. We found that the specific connectivity of the thalamic network endows it with the capability to synchronize under different neuromodulatory states and over a wide range of frequencies. First, the existence of gap junctions plays a crucial role in the synchronization of network activity. In particular, the gap junctions between HTC cells [7,
12,17,18] enable them to serve as a “pacemaker” or synchronization “engine” of the circuit that remain synchronized even in the presence of strong random noisy inputs. We showed Fig 10. A unified hypothesis for thalamic oscillatory state generation and transition. During deep
sleep, both the ACh/NE modulation and afferent excitation are very low. TC cells generate intrinsic slow low-threshold bursts (LTBs) that underlieδoscillations. During light sleep with increased ACh/NE modulation and afferent excitation, TC cells are not spontaneously bursting but can produce rebound LTBs that mediate spindle oscillations. During relaxed wakefulness or drowsiness, the ACh/NE modulation is significantly increased and HTC cells fire spontaneous high-threshold bursts (HTBs) which underlie bothαandθ
oscillations depending on afferent excitation. During attention or cognitive processing, TC cells are further depolarized to fire high-frequency tonic spiking that is synchronized by gap junctions and feedback inhibition to generate fastβorγoscillations.
that thalamic oscillations were either impaired or eliminated if the HTC gap junctions were removed, consistent with experimental observation [12,35]. Besides HTC gap junctions, the weaker gap junctions between HTC and RTC cells and the inter-RE gap junctions also contrib-ute to the synchronization of the network. Second, the feedforward IN inhibition and feedback RE inhibition lead to synchronization of RTC cells. Different from HTC cells, there are no gap junctions among RTC neurons [7,17]. Nevertheless, synchronized HTC activity propagates to both IN and RE neurons, which constrain RTC firing via feedforward inhibition. As RTC cells also project excitatory inputs on RE neurons, they receive feedback RE inhibition as well which enhances the synchronization. During low frequency oscillations (δ, spindle andα), we observed that either IN or RE inhibition was sufficient to synchronize RTC activity, while dur-ing fast frequency oscillations (β/γ), simultaneous rhythmic IN and RE inhibition was needed for high level of RTC synchrony due to strong random noisy inputs (S9 Fig). Thus, the pres-ence of both IN and RE inhibition strengthens the synchronization of TC neurons. Third, mul-tiple mechanisms contribute to the generation, synchronization and stability of thalamic oscillations. The specific connectivity of the thalamic circuit allows for the synergy of multiple mechanisms in the generation of synchronized oscillations. For example,δoscillations are syn-chronized by both gap junctions and inhibition (Fig 4). During spindle oscillations, both the feedforward IN and feedback RE inhibition contribute to the rebound bursting of TC cells. In particular, the feedforward HTC!IN!RTC inhibition could also lead to feedback inhibition on HTC cells via the HTC-RTC gap junctions. Similarly, during fastβ/γoscillations, while the HTC gap junctions play a major role, the feedback RE inhibition could also contribute to fast oscillations if the inhibitory strength is sufficiently strong. We hypothesize that the existence of multiple synchronizing mechanisms coupled with the strong intrinsic oscillatory properties of TC cells enables the thalamic network to serve as a pacemaker during thalamocortical oscilla-tions, consistent with experimental observation [56].
ACh/NE modulation and afferent excitation set the thalamic oscillation
state
To further test the hypothesis that generation and transition of distinct thalamic oscillations are functions of both ACh/NE neuromodulation and afferent excitation, we varied the ACh/NE and input levels systematically to identify the prominent oscillatory regimes across the entire parameter space. The oscillation transition map (Fig 8C) confirmed the existence of multiple distinct oscillations under physiological conditions (Fig 2B):δoscillations with low ACh/NE modulation and minimal input (deep sleep); spindle oscillations with medium ACh/NE modu-lation and slight to weak inputs (light sleep);α/θ oscillations with high ACh/NE modulation and weak input (relaxed wakefulness) andγ/βoscillations with high ACh/NE modulation and strong input (arousal and attention). One interesting and surprising finding from the oscillation transition map is that it reveals prominentαoscillations under low ACh/NE modulation and with large afferent input thus extending the original model hypothesis whereαoscillations occur under high ACh/NE modulation and with low afferent input (compareFig 8CwithFig 1B). Note thatαoscillations arising from these two different regions have different physiological implications. Whileαoscillations under high ACh/NE modulation correspond to the state of relaxed wakefulness,αoscillations under low ACh/NE modulation represent a non-physiologi-cal state in deep sleep where the thalamus receives strong afferent drive.
spindle andαoscillations and is mediated by HTBs of HTC cells. Thus, the model predicts the existence ofθ oscillations during the transition from spindle toδoscillations. Also, persistent and coherentθ oscillations mediated by LTBs are definitive signatures of a number of neuro-logical or psychiatric disorders including Parkinson’s disease, major depressive disorder (MDD) and schizophrenia [6,7]. Hence, theθ oscillation region mediated by LTBs could potentially correspond to a pathological state. Second, spontaneous spindle oscillations can be generated under relatively low ACh/NE modulation but with moderate level afferent input. Spindle oscillations can be initiated by a number of mechanisms including spontaneous firing from a more excitable region of the thalamus, spontaneous oscillating TC cells or cortical stim-ulation through excitation of RE cells [57]. In the default simulation (Fig 2B), we used a brief input to RE cells to induce spindle oscillations. Here we showed that spindle oscillations could also be initiated by spontaneous firing of TC cells given that the random background inputs are relatively high, consistent with previous hypotheses [57]. Third, there exist transientθ/α oscillations under medium ACh/NE modulation and with moderate level of afferent input. During the transition from spindle oscillations to persistentθ oscillations under medium level ACh/NE (e.g., 50%), we observed transientθ/αoscillations which lasted for a few hundred mil-liseconds (e.g.,Fig 8E2). Such transientθ/αoscillations were induced by a surge of background inputs, sustained a few cycles through the TC-RE interaction and terminated because of the inactivation of the low-threshold Ca2+current (due to afferent input; returning back the rest-ing state), similar to spontaneous spindle oscillations. Interestrest-ingly, recent experimental stud-ies discovered transient or intermittentα/βevents in the awake mammalian neocortex [58,
59]. Combined experimental and computational evidence showed that such transient oscilla-tions emerged from the integration of synchronous bursts of excitatory synaptic drive target-ing proximal and distal dendrites of pyramidal neurons [59]. Thus, though both the thalamus and neocortex are capable of generating transient rhythms, their underlying mechanisms may be different. Fourth, the effect of afferent input is somewhat equivalent to ACh/NE modula-tion. For example, without afferent input (0 nS), as the ACh/NE modulation increased, the thalamic oscillatory state switched fromδoscillations toθ oscillations and to spindle oscilla-tions and toθ oscillations again (Fig 8C). Similarly, for 0% ACh/NE, as the afferent input increased, the thalamic oscillation switched fromδoscillations toθ oscillations and to spindle oscillations after a brief quiescent state followed byθ oscillations again (Fig 8C). Lastly, fast fre-quencyβorγoscillations in the thalamus can only be generated under high ACh/NE modula-tion. This is because under low and medium ACh/NE modulation, large (random) afferent input desynchronizes the network when the HTBs of HTC cells switch to sparse tonic spiking. This is consistent with the experimental data that fastγoscillations in the thalamus are sup-ported by cholinergic projection from the brainstem [27] and acetylcholine release contributes to gamma oscillations in prefrontal cortex during attention [60].