Kristen Nichole Brugh
A dissertation submitted to the faculty at the University of North Carolina at Chapel Hill in partial fulfillment of the requirements for the degree of Doctor of Philosophy in the Department of
Maternal and Child Health in the Gillings School of Global Public Health.
Chapel Hill 2016
Approved by: Gustavo Angeles Sian Curtis
ii © 2016
iii
Nutrition Security and Child Health Outcomes in Malawi (Under the direction of Gustavo Angeles)
Social cash transfer programs are increasingly employed in sub-Saharan Africa to reduce household vulnerability to extreme poverty, strengthen food and nutrition security, and improve child health. Many of these programs are government-run, and as countries take these programs to scale it is important to understand the range of impacts programs can have as well as how these impacts occur. The main objectives of this dissertation are to determine if the Government of Malawi’s Social Cash Transfer Program (SCTP) improves household food and nutrition security (FNS) and young child health, and to understand the mechanisms through which the program achieves these impacts by analyzing critical relationships along the causal chain. This study uses baseline and 17-month follow-up household panel data from a large-scale evaluation of the SCTP. The evaluation is a cluster-randomized control trial that employs both random selection and random assignment to treatment and delayed-entry control groups. The first paper uses the difference-in-differences approach and specifies Generalized Linear Models to estimate average treatment effects of the program on three components of FNS: current economic vulnerability, diet quantity, and diet quality. Results show protective program impacts during the lean season on diet quantity, but beneficiary households experience little improvement in diet quality or current economic
iv
vi
encouragement and advice throughout my doctoral studies; the successful completion of this
dissertation would not have been possible without their support. Foremost, I would like to thank my advisor, Gustavo Angeles, for his guidance, enthusiasm, and patient dedication during my
dissertation work. I am also indebted to Sudhanshu Handa for accepting me as a member of the Transfer Project team and for helping me extend the marginal cost: marginal benefit calculus beyond the classroom into my professional and personal life. I have been extremely fortunate to work with these passionate and experienced advisors. Their insight, sense of humor, and high expectations have been formative in my development as a researcher, and their mentorship and friendship are two of the things I value most from my time at UNC. I would also like to thank my dissertation committee – Gustavo Angeles, Sian Curtis, Christine Durrance, Sudhanshu Handa, and Kavita Singh Ongechi – for their feedback, which helped me to focus the dissertation narrative to emphasize the applied, policy-relevant components of the research.
I gratefully acknowledge financial support from MEASURE Evaluation, the Transfer Project, the UNC Graduate School, and the Department of Maternal and Child Health during my doctoral studies. I also thank the Transfer Project and the UNICEF Office of Research – Innocenti for allowing me to use the evaluation research for my dissertation and the families who graciously participated in this research for their time and trust.
vii
viii
TABLE OF CONTENTS
LIST OF TABLES ... xiii
LIST OF FIGURES ... xv
LIST OF ABBREVIATIONS ... xvi
CHAPTER 1: INTRODUCTION ... 1
1.1. Dissertation Objectives ... 4
1.2. Conceptual Framework ... 6
CHAPTER 2: IMPACTS OF AN UNCONDITIONAL CASH TRANSFER ON HOUSEHOLD FOOD AND NUTRITION SECURITY IN MALAWI ... 9
2.1. Introduction ... 9
2.2. Background ... 10
2.2.1. Operationalizing Food and Nutrition Security ... 10
2.2.2. Poverty and Food and Nutrition Security ... 11
2.2.3. The Cash Transfer Response ... 12
2.3. The Malawi Context ... 15
2.3.1. Previous Social Protection Programs ... 15
ix
2.4. Program Theory of Change ... 18
2.4.1. Potential Effect Modification and Heterogeneous Program Impacts ... 21
2.4.2. Study Goals and Contribution ... 21
2.5. Methods ... 22
2.5.1. Study Design and Data Collection ... 22
2.5.1.1. Ethics Approval ... 24
2.5.2. Derivation of the Analytical Sample and Attrition Analysis ... 24
2.5.3. Measures ... 25
2.5.3.1. Outcomes of Interest ... 25
2.5.3.2. Intervention ... 27
2.5.3.3. Moderators ... 28
2.5.3.4. Controls ... 28
2.5.4. Empirical Approach ... 29
2.5.4.1. Main Impact Analysis ... 29
2.5.4.2. Heterogeneous Impacts ... 31
2.5.4.3. Transfer Share ... 32
2.6. Results ... 34
x
2.6.2. Main Impact Results ... 36
2.6.3. Heterogeneous Impacts ... 37
2.6.4. Transfer Share ... 38
2.6.5. Extensions ... 39
2.7. Discussion ... 43
2.7.1. Implications for Policy and Practice ... 46
2.7.2. Limitations ... 48
2.8. Conclusions ... 50
2.9. Tables and Figures ... 52
CHAPTER 3: IMPACTS OF AN UNCONDITIONAL CASH TRANSFER ON CHILD HEALTH: A PRODUCTION FUNCTION APPROACH ... 69
3.1. Introduction ... 69
3.2. Background ... 70
3.2.1 Cash Transfer Programs and Child Health ... 71
3.2.2. Understanding How Unconditional Transfers can Affect Health Outcomes ... 76
3.3. Theoretical Framework ... 77
3.4. Methods ... 82
xi
3.4.2. Measures ... 84
3.4.3. Analytical Sample ... 90
3.4.4. Estimation Strategy ... 91
3.4.5. Transfer Share ... 95
3.5. Results ... 97
3.5.1. Descriptive statistics, balance at baseline ... 98
3.5.2. Impacts on health inputs ... 100
3.5.3. Child health outcomes ... 105
3.5.4. Extensions – Household Panel ... 110
3.6. Discussion ... 113
3.6.1. Health Service Inputs and Child Health ... 114
3.6.2. Child Feeding and Health ... 115
3.6.3. Food Security and Child Health ... 115
3.6.4. Heterogeneous Program Impacts ... 117
3.6.5. Implications for Policy and Practice ... 117
3.6.6. Study Limitations ... 118
3.7. Conclusion ... 120
xii
CHAPTER 4: CONCLUSION ... 152
4.1. Summary of Key Findings ... 152
4.2. Dissertation Contributions ... 153
4.3. Programmatic Implications and Suggestions for Future Research ... 155
APPENDIX 1: CHAPTER 2 ATTRITION ANALYSIS ... 158
APPENDIX 2: NOTES ON KEY STUDY VARIABLES ... 172
APPENDIX 3: CHAPTER 2 GLM DIAGNOSTICS ... 176
APPENDIX 4: CHAPTER 2 FULL RESULTS OF MAIN IMPACT ANALYSIS MODELS ... 186
APPENDIX 5: CHAPTER 3 ATTRITION ANALYSIS FOR PANEL OF CHILDREN ... 198
APPENDIX 6: CHAPTER 3 INSTRUMENTAL VARIABLES DIAGNOSTICS ... 210
APPENDIX 7: CHAPTER 3 EXTENSION TABLES ... 215
xiii
Table 2.2. Descriptive Statistics by Wave and Treatment Status ... 53
Table 2.3. Program Impacts on Household FNS, Marginal Effects ... 55
Table 2.4. Heterogeneous Program Impacts by Baseline Poverty Level, Marginal Effects ... 57
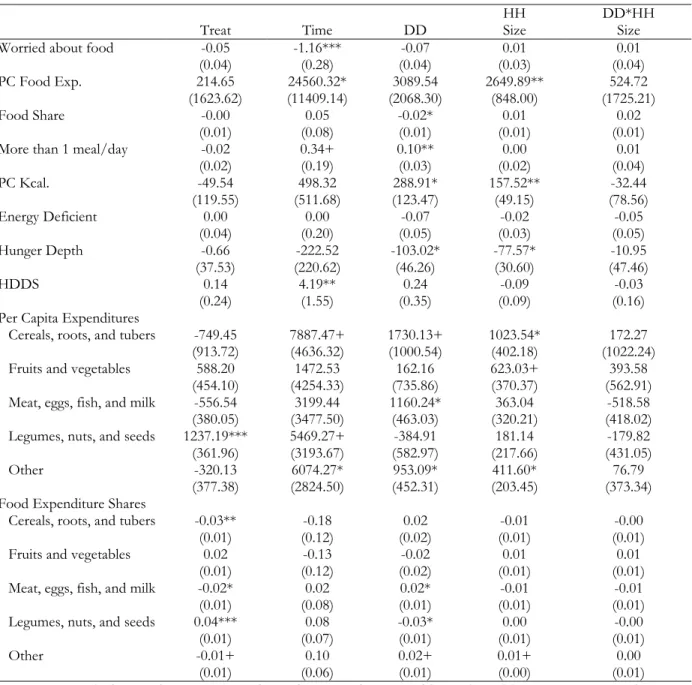
Table 2.5. Heterogeneous Program Impacts by Baseline Household Size, Marginal Effects ... 58
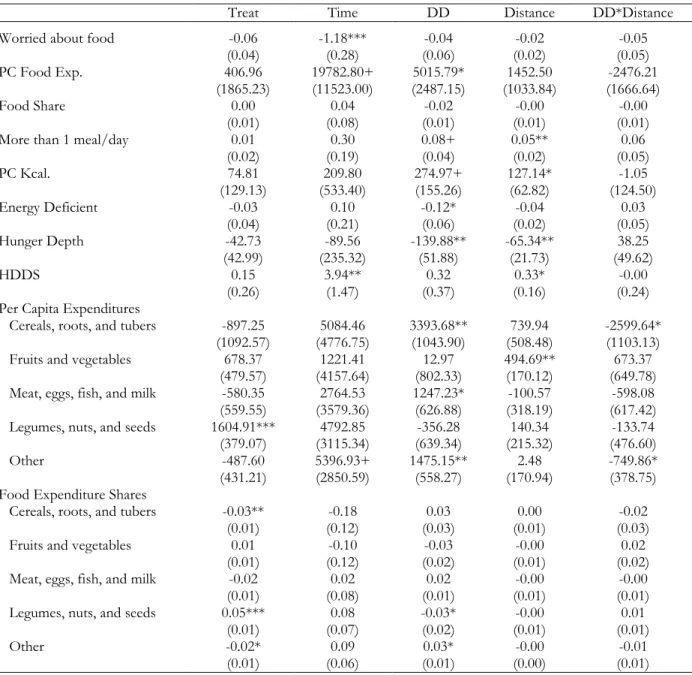
Table 2.6. Heterogeneous Program Impacts by Distance to Food Market, Marginal Effects ... 59
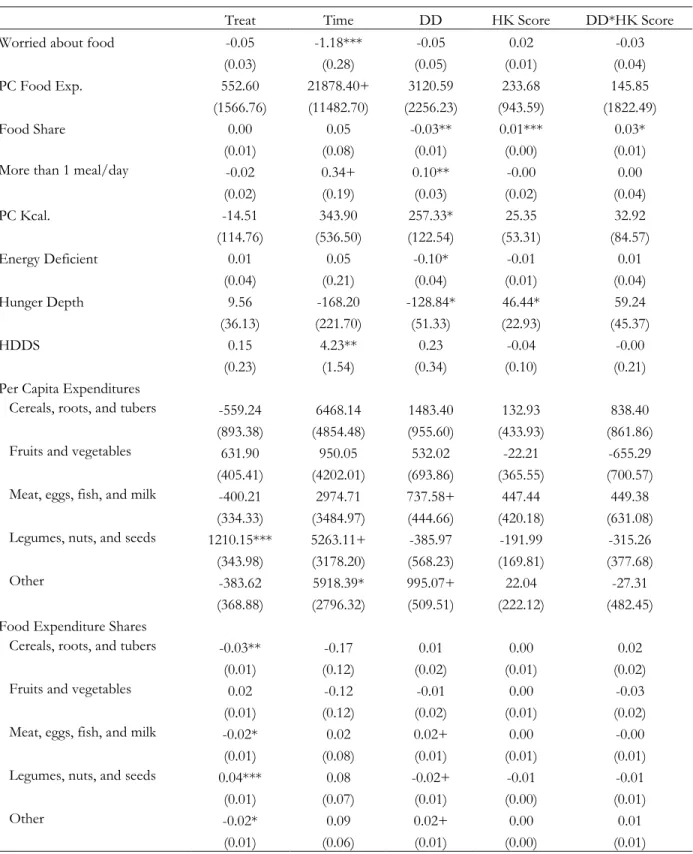
Table 2.7. Heterogeneous Program Impacts by Caregiver Health Knowledge, Marginal Effects ... 60
Table 2.8. Heterogeneous Impacts by Transfer Share Level ... 61
Table 2.9. Main impact results among households with children, Marginal Effects ... 63
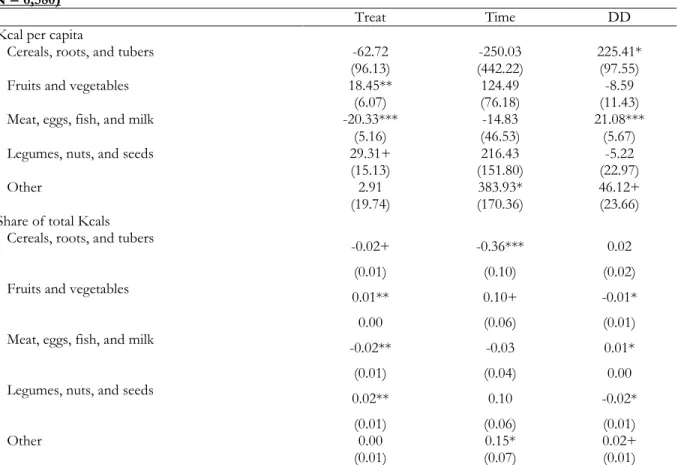
Table 2.10. Program Impacts on Group-Specific Apparent Caloric Availability and Shares, Marginal Effects ... 65
Table 3.1.A. Descriptive Statistics by Wave and Treatment Status - Panel of Children ... 122
Table 3.1.B. Descriptive Statistics by Wave and Treatment Status – Panel of Households ... 125
Table 3.2. Household Demand for Child Health Inputs (1st Stage 2SLS Results) ... 128
Table 3.3.A. Household Production of Child Health (2nd Stage 2SLS Results) - Panel of Children ... 129
Table 3.3.B. Household Production of Child Health (2nd stage 2SLS Results) - Children in Panel Households ... 131
Table 3.4.A. Heterogeneous Impacts on Health Demand - Panel of Children ... 133
Table 3.4.B. Heterogeneous Impacts on Health Demand - Panel of Households ... 134
Table 3.5.A. Heterogeneous Impacts on Health Production - Panel of Children ... 135
Table 3.5.B. Heterogeneous Impacts on Health Production - Children in Panel Households ... 136
Table 3.6.A. Fixed-Effects Estimation - Effects of Health Inputs on Reported Health Status ... 137
Table 3.6.B. Fixed-Effects Estimation - Effects of Health Inputs on Health Improvement ... 138
xiv
Table 3.6.D. Fixed-Effects Estimation - Effects of Health Inputs on Incidence of Diarrhea ... 140
Table 3.6.E. Fixed-Effects Estimation - Effects of Health Inputs on Incidence of Fever ... 141
Table 3.6.F. Fixed-Effects Estimation - Effects of Health Inputs on Incidence of Cough ... 142
Table 3.6.G. Fixed-Effects Estimation - Effects of Health Inputs on Height (cm) ... 143
Table 3.6.H. Fixed-Effects Estimation - Effects of Health Inputs on Weight-for-Age Z-Score .... 144
Table 3.6.I. Fixed-Effects Estimation - Effects of Health Inputs on Height-for-Age Z-Score ... 145
Table 3.6.J. Fixed-Effects Estimation - Effects of Health Inputs on Weight-for-Height Z-Score . 146 Table 3.6.K. Fixed-Effects Estimation - Effects of Health Inputs on Incidence of Stunting ... 147
xv
Figure 2.1. Participant Flow Diagram ... 66
Figure 2.2. Program Impacts on Calories from Cereals, Roots, and Tubers ... 67
Figure 3.1.A. Participant Flow Diagram - Panel of Children ... 150
xvi 2SLS 2-Stage Least Squares
ADMARC Malawi agricultural Development and Marketing Corporation AE-L Adult equivalent assuming light activity levels
AIC Akaike information criterion
AIDS Acquired immunodeficiency syndrome AME Average marginal effect
ATE Average treatment effect BIC Bayesian information criterion CCT Conditional Cash Transfer CGP Zambia Child Grant Program
CSSC Community Social Support Committee
CT-OVC Kenya Cash Transfer for Orphans and Vulnerable Children DD Double-Difference; Difference-in-Differences
ESA Eastern South Africa
FAO Food and Agriculture Organization FE Fixed-Effects
FIVIMS Food Insecurity and Vulnerability Information and Mapping Systems FNS Food and Nutrition Security
GLM Generalized Linear Models GoM Government of Malawi HAZ Height-for-Age
HDDS Household diet diversity score HIV Human immunodeficiency virus
xvii IHS3 Malawi 3rd Integrated Household Survey IPW Inverse probability weight
IRB Institutional Review Board ITT Intention to treat
IV Instrumental Variables Kcal Kilocalories
KM kilometers
MCTG Zambia Multiple Transfer Category Grant program MDG Millennium Development Goals
MWK Malawian Kwacha
NCST National Commission For Science And Technology OLS Ordinary Least Squares
PC Per capita
SCTP Social Cash Transfer Program SDG Sustainable Development Goals SSA Sub-Saharan Africa
TA Traditional Authority TIP Targeted Inputs Program UCT Unconditional Cash Transfer
UNC University of North Carolina at Chapel Hill UNICEF United Nations Children's Fund
USD United States dollars VC Village Cluster WAZ Weight-for-Age
1
CHAPTER 1: INTRODUCTION
Considerable gains in poverty reduction and food and nutrition security (FNS) have been made since the inception of the Millennium Development Goals (MDG) era. The share of people living in extreme poverty in developing countries has decreased from 43 percent in 1990 to 17 percent in 2015,1 and the global prevalence of undernourishment declined by 216 million people (from 19 percent to 11 percent) despite a concurrent 1.9 billion increase in the global population.2 While progress has been made in reducing poverty and hunger in recent decades, substantial problems persist. Globally, nearly one billion people continue to live in extreme poverty (less than US$1.25 per capita per day), 1 and 11 percent of the global population is undernourished (795.6 million), most of whom are in developing regions (779.9 million, 12.9 percent). Nearly two billion people experience “hidden hunger”, or micronutrient deficiency,3,4 and 749 million are estimated to be calorie deficient.1 As most of the world’s regions have experienced declining poverty and
undernutrition rates, sub-Saharan Africa (SSA) has seen little progress. Half of the population in SSA is extremely poor, and just under one in four people is undernourished (220 million). Sub-Saharan Africa has the highest regional prevalence of undernourishment, and the number of undernourished actually increased by 44 million between 1990 and 2015.2
The poor are particularly vulnerable to hunger and food insecurity because they often live just above or at subsistence levels, and even small shocks will move them closer towards
2
cheaper calorie sources, or selling productive assets and taking children out of school to afford food.1
Children are disproportionately represented among the income-poor.6 Over one-third of the global extreme poor are children under age 13, and half of all children in low-income countries live in extreme poverty.7 Children living in poverty are at the highest risk for inadequate nutrition, limited health service access, and poor health outcomes,8 and socioeconomic-based health inequalities among children are worsening.9 Poverty and early child malnutrition are of critical concern because of their mutually reinforcing relationship over the life-course. Nutritional status as young as age two has been demonstrated to influence outcomes later in life. Malnourishment in early childhood has been linked with a reduced cognitive capacity,10,11 lower levels of educational
attainment,8,11,12 and reduced adult economic productivity.8,13 As poverty is both a cause and an outcome of poor human capital development in children with cumulative and long-term effects, country and development actors are beginning to favor social welfare programs that address the root causes of poverty and poor health outcomes.7
Social protection strategies are increasingly being employed to reduce household
3
Conditional cash transfer (CCT) programs are typically targeted towards households with young and school-age children in poor regions. They provide cash and sometimes in-kind transfers, and are usually given directly to the mother or female caregiver. Beneficiary households must commit to undertaking co-responsibilities to continue receiving the transfers, such as sending their children to school, receiving routine health checkups, and attending health and nutrition educational sessions. While cash transfer are demand-oriented interventions, many programs in Latin America concurrently developed the supply environment, helping to ensure that beneficiaries could meet their co-responsibilities and invest transfer money in their children and health by improving
education and health service infrastructure.5 A strong experimental literature exists on the impacts of CCT programs. These evaluations demonstrated short- and long-term positive effects on
consumption, poverty reduction, food security and dietary diversity, and many also led to increased use of preventive and curative health care services.15–17
Unlike their Latin American counterparts, cash transfers in sub-Saharan Africa tend to be unconditional (some programs have ‘soft’ conditions), beneficiary targeting is at the community-level, and targeting is usually linked to geographical or vulnerability-based eligibility criteria. Despite the short time in which they have been operating, several SSA unconditional cash transfer (UCT) programs have achieved positive impacts on consumption, food security, and health.18–21 Beneficiary households typically spend more on food and health from the cash transfer than they spend relative to other increases in income, even when the transfer programs are not directly linked to health or nutrition.22
4
to know the breadth and depth that different targeting schemes and payment mechanisms can achieve. In addition to knowing what these programs can achieve, it is critical to understand how cash transfer programs achieve impacts. Cash transfers are demand-oriented interventions, but there are certain supply-side pre-conditions that are necessary for these programs to achieve impacts, including well-functioning food markets and quality health services.
1.1. Dissertation Objectives
This dissertation focuses on the case of Malawi, a country plagued by persistent poverty, undernutrition, and poor health outcomes for young children. Malawi is one of the poorest countries in the world; in 2013, the Government of Malawi (GoM) reported a per capita Gross National Income of $715 (2011 PPP$), the third lowest out of 187 countries after the Democratic Republic of the Congo and the Central African Republic.23 Poverty is widespread throughout the country as evidenced by high poverty headcount ratios and poverty gaps. In 2010, 51 percent of Malawians were living below the national poverty line, with a poverty gap of 19 percent. At that time, Malawi ranked ninth out of 187 countries for the highest percentage of the population living below the international benchmark of $1.25 per person per day (62 percent), with an associated gap of 26 percent. The percentage of people living below the national poverty line decreased by two percentage points between 2004 and 2010, but the national poverty gap increased by one percentage point;24 thus, while relatively fewer people were living in poverty in 2010 compared to 2004, the poor were getting poorer.
5
very young children also remained low in 2010, with only 19 percent of children ages six to 23 months receiving a minimum acceptable diet.7
The Government of Malawi (GoM), in partnership with UNICEF, began to implement its social cash transfer program as a pilot in Mchinji district in 2006 as an innovation to address these persistent problems of poverty and undernutrition. The Social Cash Transfer Program (SCTP) is an unconditional cash transfer program targeted to ultra-poor labor-constrained households. A short-term impact evaluation of the Mchinji pilot from 2007 – 2008 provided evidence of positive effects of the cash transfer on household food security, curative care seeking, and child education.27 The SCTP has undergone changes in targeting and operations and has experienced significant expansion since 2009, now reaching 18 out of 28 districts in Malawi. By March 2015 the program was
operating at full scale in 10 districts and reached over 100,000 households with plans to enroll over 175,000 households by the end of 2015. Currently, households are eligible for the program if they are ultra-poor and labor-constrained. A household is considered to be ultra-poor if it is unable to meet the most basic urgent needs of members, including procuring food and essential non-food items (e.g., soap and clothing). A labor-constrained household has no ‘fit to work’ members or the ratio of ‘unfit’ to ‘fit’ is greater than three; household members are ‘unfit’ if they are younger than 18, older than 64, or have a chronic illness, disability, or are otherwise unable to work.20
6
The first paper analyzes the impact of the program on three critical components of food and nutrition security: current economic vulnerability, diet quantity, and diet quality. The second paper seeks to understand how a social cash transfer – with no conditionalities on how households must spend their resources or time – can influence household health behavior and child health outcomes. This study analyzes the impact of the SCTP on household demand for child health inputs and the effect of these inputs on child health. There are few studies that investigate the mechanisms through which a positive exogenous income shock influences health, and this study attempts to fill that gap.
1.2. Conceptual Framework
Figure 1.1 depicts a conceptual framework that encompasses the research questions and hypotheses of both dissertation papers. The conceptual model expands Mosley and Chen’s framework28 to include Black et al.’s 2008 framework29 of the relationships among poverty, food insecurity, and other distal and proximate causes of maternal and child nutrition.29 This is mapped onto a simplified version of the FAO’s FIVIMS (Food Insecurity and Vulnerability Information and Mapping Systems)30 to better understand how the local food economy influences SCTP
beneficiaries’ ability to use the cash transfer to improve household FNS.
7
The SCTP enters at the levels of household food and health service access by increasing the household’s purchasing power. Households make decisions about the types of foods to buy, with implications for both quantity (energy intake) and quality (nutrient intake) components of food consumption. FNS only influences child health through the individual’s nutritional status. The child’s health status also influences nutritional status in that the child must be able to absorb
8
Figure 1.0.1. Conceptual Framework
Potential Resources
Social, Economic, and Political Factors
Household Food Access Income poverty Purchasing Power
Food Consumption Energy intake Nutrient intake
Mortality Nutritional Status
Health
Environment Health services Disease environment
Water and sanitation Air quality
Norms Caregiver
Education Health knowledge
Feeding practices Food preparation Future expectations Attitudes toward risk
Preferences
Availability Domestic production
Food stocks Imports and trade
Food aid
Food Economy
Stability Price fluctuations Weather variability Crop/livestock shocks
Access Local markets Transportation
Infrastructure
9
CHAPTER 2: IMPACTS OF AN UNCONDITIONAL CASH TRANSFER ON HOUSEHOLD FOOD AND NUTRITION SECURITY IN MALAWI
2.1. Introduction
Last year marked the conclusion of the Millennium Development Goals (MDGs) timeline and the launch of the 2015-2030 Sustainable Development Goals (SDGs). The SDGs include 17 goals and 169 targets; the first goal is to “end poverty in all its forms everywhere”, and the second goal aims to “end hunger, achieve food security and improved nutrition and promote sustainable agriculture.” 31 While progress has been made in reducing poverty and hunger in recent decades, substantial problems persist. Globally, nearly one billion people continue to live in extreme poverty (less than US$1.25 per capita per day), 1 and 795.6 million are undernourished.2
10
2.2. Background
Considerable gains in poverty reduction and FNS have been made since the inception of the MDG era. The share of people living in extreme poverty in developing countries has decreased from 43 percent in 1990 to 17 percent in 2015,1 and the global prevalence of undernourishment declined by 216 million people (from 19 percent to 11 percent) despite a concurrent 1.9 billion increase in the global population.2 Yet almost one billion people still live below US$1.25 per day. Most of the extreme poor live in rural areas, and the rural poor are more likely than other rural households to rely on agriculture for livelihoods.1 Currently, 11 percent of the global population is undernourished (795.6 million), and the majority of the undernourished live in developing regions (779.9 million, 12.9 percent). Nearly two billion people experience “hidden hunger”, or micronutrient deficiency,3,4 and 749 million are estimated to be calorie deficient.1 As most of the world’s regions have
experienced declining poverty and undernutrition rates, sub-Saharan Africa has seen little progress. Half of the population in sub-Saharan Africa is extremely poor, and just under one in four people is undernourished (220 million). Sub-Saharan Africa has the highest regional prevalence of
undernourishment, and the number of undernourished actually increased by 44 million between 1990 and 2015.2
2.2.1. Operationalizing Food and Nutrition Security
11
Smith defined nutrition security as “… a nutritionally adequate diet and the food consumed is biologically utilized such that adequate performance is maintained in growth, resisting or recovering from disease, pregnancy, lactation, and physical work.”34 The combined term “food and nutrition security” (FNS) is now the common language used by prominent international agencies, including the United Nations High Level Task Force on Global Food Security, FAO, UNICEF, and the International Food Policy Research Institute (IFPRI).32
Given the complexity and multidimensionality of the concept, a range of indicators are typically employed to characterize FNS.32,35,36 Food security indicators reflect diet quantity, whereas nutrition security indicators tend to describe diet quality. Examples of diet quantity indicators include the number of meals eaten per day and household daily food energy available per capita. Diet quality, in addition to quantity, is increasingly recognized as a major constraint for the poor. Quality metrics include household diet diversity of the major food groups and the percent of household food energy derived from staple foods. The percent of total household expenditures on food represents a measure of current economic vulnerability to food insecurity. 2,35,37,38
2.2.2. Poverty and Food and Nutrition Security
The poor are particularly vulnerable to hunger and food insecurity because they often live just above or at subsistence levels, and even small shocks will move them closer towards
12
such as floods or droughts that can cause harvest failure.41 Vulnerability can increase over time if these households face repeated or multiple shocks. Inflation, high food prices, and price volatility are also significant threats to FNS.
When confronted with difficulties in purchasing food, poor households result to coping strategies which can be harmful and further exacerbate the cycle of poverty. These adverse coping strategies often include reducing diet quantity or compromising diet quality by switching towards cheaper calorie sources, or selling productive assets and taking children out of school to buy food.1 A key function of social safety nets is to prevent poor households from resorting to these
detrimental coping mechanisms. 2.2.3. The Cash Transfer Response
Social protection strategies are increasingly being employed to reduce household
vulnerability to extreme poverty and improve FNS. The prominence of social safety net programs in government welfare strategies grew largely in response to the negatively reinforcing relationship between poverty and low levels of human capital accumulation. Social safety net programs are those “… programs comprising of non-contributory transfers in cash or in-kind, designated to provide regular and predictable support to poor and vulnerable people.”14 As of 2015, every country in the world has at least one social assistance program; 130 countries are currently providing unconditional cash transfers and 63 countries are providing conditional cash transfers that include a focus in promoting FNS.2
2.2.3.1. Cash Transfers in Latin America and the Caribbean
In late 1997, the government of Mexico launched PROGRESA (formerly Oportunidades, now
Prospera), a conditional cash transfer (CCT) to alleviate immediate and short-term consumption
13
around the world – began implementing national CCTs to improve poverty, food insecurity, and help households protect themselves against risks and shocks. CCTs are typically targeted towards households with young and school-age children in poor regions. They provide cash and sometimes in-kind transfers. Transfers are usually given directly to the mother or caretaker, and beneficiary households must commit to undertaking co-responsibilities to receive the transfers (e.g., keeping their children in school, attending preventive care visits, etc.).5 While cash transfers are demand-oriented interventions, many programs in Latin America concurrently developed the supply environment, helping to ensure that beneficiaries could meet their co-responsibilities and invest transfer money in their children and health by improving education and health service infrastructure.
The positive impacts of the CCT schemes in Latin America and the Caribbean are well-documented in large part because many of the programs were accompanied by experimental impact evaluations. These first generation evaluations demonstrated short- and long-term positive effects on consumption, poverty reduction, food security and dietary diversity, and many also led to increased use of preventive and curative health care services.15
PROGRESA was found to have a positive impact on consumption and food expenditures;
on average, CCT households spent 60 to 70 percent of the transfer on food and consumed 7.1 percent more calories compared to control households.11,42,43 Households receiving Nicaragua’s Red
de Protección Social increased annual per capita food expenditures and diet diversity, and during a food
14
2.2.3.2. Cash Transfer Programs in Africa
Social protection programs, particularly cash transfers, are rapidly becoming a cornerstone of African development programs and government policies. The African Union adopted the Social Policy Framework for Africa in 2008, which promotes the codification of social protection coverage into national development agendas.5 In 2010, unconditional cash transfer programs were operating in about half of the countries on the African continent. As of 2015, 40 out of 48 African countries are implementing some form of unconditional cash transfer (UCT) as a component of social safety net programming.14 Unlike their Latin American counterparts, cash transfers in sub-Saharan Africa tend to be unconditional (some programs have ‘soft’ conditions), beneficiary targeting is at the community-level, and targeting is usually linked to geographical or vulnerability-based eligibility criteria.
Despite the short time in which they have been operating, several SSA UCT programs have achieved positive impacts on consumption, food security, and health. A 24-month impact evaluation of Zambia’s Child Grant Program (CGP) – which is one of the largest governmental social
protection programs in the country – attributed improved household consumption, food security, and diet diversity to the program. The study found that three-fourths of the increase in consumption among beneficiary households was for food, and households were substituting away from inferior foods towards protein.46 Similar results were found in a 24-month evaluation of the Zambia Multiple Transfer Category Grant program (MCTG), which also found program positive impacts on a
15
expenditures, although food expenditure impacts were not significant after controlling for fixed-effects.50
2.3. The Malawi Context
Poverty and undernutrition are widespread throughout Malawi as evidenced by high poverty headcount ratios, wide poverty gaps, and a large prevalence of undernutrition. In 2010, 62 percent lived below the international benchmark of $1.25 per day, with an associated gap of 26 percent. The percentage of people living below the national poverty line decreased between 2004 and 2010, but the national poverty gap increased; 24 thus, while relatively fewer people are living in poverty, the poor are getting poorer. From 1990-1992, 33 percent of the population was undernourished (4.3 million people), compared to 21 percent (3.6 million) in 2014-2015.2
Food security problems among the poor in Malawi can largely be attributed to high lean season food prices, especially for maize, which is a dominant food staple. 51 Most Malawians earn their livelihood via agriculture; over 85 percent of the population resides in a rural area, and 89 percent of the labor force works on smallholder farms or commercial estates.39 The HIV/AIDS epidemic in Malawi has also been a key driver of poverty and associated food insecurity. A high prevalence of HIV/AIDS increased household vulnerability and reduced coping capacities,
particularly after the death of a household head or main income earner. Although Malawi still has a generalized HIV epidemic, the prevalence is declining. Among people 15-49 years of age, the prevalence has decreased from 16 percent in 1999 to 11 percent in 2010.52
2.3.1. Previous Social Protection Programs
16
launched the Starter Pack program, which gave 2.8 million farmers a package containing fertilizer and maize and legume seeds. The program was found to significantly reduce the food gap.53 The Starter Pack program was scaled down and rebranded as the Targeted Inputs Program (TIP) in 2000. Later, in 2005, the GoM launched the Farm Input Subsidy Program, which helped vulnerable smallholders to access improved fertilizer and hybrid seeds with the aim of improving household food security.5
Several small-scale cash transfer programs were introduced in 2005/2006. Oxfam
implemented an unconditional cash transfer of US$26/month to 6,000 households in one district for five months as a complimentary intervention to humanitarian food aid following extreme weather events that reduced the national maize harvest by 25 percent. Households receiving the program were reported to have spent 80-85 percent of the transfer on food.54 The Dowa Emergency Cash Transfer Project adjusted cash transfer payments monthly based on local food prices to allow households to maintain purchasing power during a localized drought in 2006.55 In 2005-2006, Concern Worldwide provided a “food plus cash” package, basing transfer amounts on household size and adjusting the cash component monthly in accordance with changes in local prices. An evaluation of the program found that, in addition to food, the cash was also used to meet other non-food needs, including the purchase of productive assets. Lastly, the Malawi Cash and Food for Livelihoods Pilot provided a mixed food and cash transfer program to 11,000 households in southern Malawi from October 2008 to May 2009. Households were randomly assigned to receive cash, food, or a mixed cash/food transfer in exchange for working in the construction of
17 2.3.2. The Malawi Social Cash Transfer Program
The Government of Malawi’s Social Cash Transfer Program (SCTP) is an unconditional cash transfer program targeted to ultra-poor, labor-constrained households. Key objectives of the program include reducing poverty and hunger and increasing school enrollment rates. The program is administered by the Malawi Ministry of Gender, Children, and Social Welfare with additional oversight provided by the Ministry of Economic Planning and Development and technical support from UNICEF Malawi.20
The program was first implemented in 2006 as a pilot in Mchinji district. The 2007-2008 impact evaluation of the Malawi SCT Pilot Scheme provided evidence of positive results of the pilot project on household food security, curative care seeking, and education.20,27 A 2008 prospective, longitudinal qualitative study found that – prior to the implementation of the Mchinji SCT pilot program – respondents reported lacking food and basic necessities and being destitute and frequently sick. The majority of respondents reported improved nutrition and food security and being able to provide adequate food for children after receiving the cash transfer.56 Results from the quantitative impact evaluation demonstrated that beneficiary households consumed twice as many food groups and were more likely to eat higher quality foods compared to control households.57
The SCTP has undergone changes in targeting and operations and has experienced
18
greater than three; household members are ‘unfit’ if they are younger than 18 or older than 64, or if they are age 18 to 64 but have a chronic illness, disability, or are otherwise unable to work.
A community-based approach is used to select beneficiary households. Community
members are appointed to Community Social Support Committees (CSSC). Each CSSC compiles a list of households that meet the eligibility criteria, and after further screening the list is condensed to include a target coverage rate of the poorest 10 percent of households in each village cluster (VC). Oversight is provided by the District Commissioner’s Office and the District Social Welfare Office, which implements a proxy means test to impose the ultra-poor eligibility condition.20
The cash transfer amount varies by household size and the number of household members enrolled in primary and secondary school. Prior to May 2015, a single-person household received a monthly cash benefit of Mk 1,000, a two-person household received Mk 1,500, a three-member household received Mk 1,950, and households with four or more members received Mk 2,400. The household receives an additional Mk 300 for each member age 21 years and younger enrolled in primary school and Mk 600 for members age 30 and younger enrolled in secondary school. Transfer amounts were increased starting in May 2015, after midline data collection was complete.20
2.4. Program Theory of Change
19
households in the poorest quintile actually showed expenditure elasticities for staples foods such as cereals, maize, and cassava of greater than unity.59 Because poor households have higher expenditure elasticity for food and a higher marginal utility for calories, they are predicted to choose a diet which maximizes caloric content given their budget constraints. As staple foods are the least expensive source of calories, poor households tend to spend most of their food budget on cereals and tubers. When a poor household’s budget is increased, after meeting a critical caloric quantity threshold, purchases can be expected to shift towards more expensive foods with improved caloric quality such as fruit, vegetables, and mean.35
Unconditional cash transfer programs can promote food and nutrition security by expanding the household’s budget to improve both the quantity and quality of calories consumed.5 The
regularity and predictability of the cash transfer payment can help families to meet immediate consumption needs, and then begin investing in their children’s human capital development, access credit, and save. The exogenous inflow of cash can also bridge household consumption shortages and protect household assets from being liquidated at distress prices in order to prevent hunger, which is particularly important as poor households have difficulty replacing assets lost during a food crisis.60
20
transfer rather than save it or use it to pay down debt. Therefore, the first round of SCTP impacts is expected to be on household consumption, particularly for basic items such as food.61 Over time, once households have been able to meet their basic needs, additional monthly transfers can induce households to switch to higher quality foods.
Household demand for food follows Engel’s Law, according to which as income
(consumption expenditure) increases, the household decreases its budget share of food. Household demand for staple foods follows Bennett’s Law, which reflects the average household’s desire for diet diversity. As income increases, the households reduces the budget share of starchy staple foods, substituting away first from low quality towards finer grains, and then away from
grains/carbohydrates toward fruits, vegetables, dairy, and especially meat.36 From these two theories, we expect the SCTP to induce households to increase consumption, but reduce their food share, and for households to decrease the proportion of food expenditures directed toward starchy staples and increase the proportion spent on other food groups such as fruits, vegetables, and meat. These hypotheses can be tested using indicators for household expenditures on food, the household’s food share, food group shares, a diet diversity indicator, caloric quantity, and the proportion of calories the household obtains from staple foods.
21
2.4.1. Potential Effect Modification and Heterogeneous Program Impacts
Given that certain community, household, and caregiver characteristics have been shown to exert differential effects on household consumption and FNS, there are multiple reasons why we can expect heterogeneous impacts of the Malawi SCTP. The local supply environment is essential to the success of cash transfers in promoting food and nutrition security. If the poor cannot access markets or if they face volatile prices and high inflation, direct food and other in-kind transfers may be more effective than cash programs.1 Hoddinott and Skoufias found that PROGRESA’s impact on increased food expenditures reflected increased diet quality instead of increased caloric
consumption, and attributed this to the nutrition education component of the programs conditions.63
The impacts of the SCTP on household welfare may differ by the transfer level itself. A recent World Bank review of global cash transfer programs reported that the relatively low levels of transfers provided by social safety nets are generally insufficient to allow the poor to escape poverty. On average, the transfers are 23 percent of poor households’ consumption level, but the Bank estimates that the average level of consumption among poor households globally is 34.8 percent below the international $1.24/day poverty line.14 Because the direct and indirect impacts of the SCTP depend upon the purchasing power of the transfer, and given that the Malawi program is not indexed with inflation (i.e., the real value of the transfer is decreasing over time), it is important to assess the level of program impacts that can be expected from current transfer levels.
2.4.2. Study Goals and Contribution
22
and benefit revisions since the Mchinji pilot and currently has common targeting and benefit designs similar to other cash transfer programs in SSA, which is important for the external validity of our results. We examine program impacts on three critical FNS components – current economic vulnerability, diet quantity, and diet quality. While previous studies have demonstrated impacts on consumption expenditures, diet diversity scores, and household self-assessment of hunger,
information on impacts on caloric availability is lacking in the SSA context. Thus, this study fills an important gap by examining program impacts on both expenditures and apparent caloric availability among study households.
2.5. Methods
2.5.1. Study Design and Data Collection
This study uses baseline and midline follow-up data from the Impact Evaluation of the Malawi SCTP in Mangochi and Salima districts, which is being conducted on a larger scale than the 2007-2008 Mchinji Pilot Scheme. Some of the key evaluation questions are whether the SCTP improves consumption, reduces food insecurity, and increases diet diversity among beneficiary households.
The impact evaluation uses a mixed methods, longitudinal, experimental study design. The quantitative component is based on a difference-in-differences experimental design and uses both random selection of study locations (at the traditional authority and village cluster levels) and random assignment of village clusters into treatment and control groups.
23
households to be interviewed at baseline was slightly different between the two districts. Mangochi VCs typically had large numbers of selected households, so eligible households were randomly selected for interview. Salima VCs had smaller numbers of selected eligible households, and so all eligible households were interviewed. A total of 1,756 households were interviewed in Mangochi and 1,775 households were interviewed in Salima, for a total baseline sample size of 3,531 SCTP-eligible households. Baseline interviews were conducted between late June and early September 2013. All study households are in rural areas.
Random assignment was conducted at the VC level after the baseline survey was completed. Half of the VCs in each TA were randomly assigned to the treatment group, which was to receive the program immediately, and the other half to a delayed-entry control group. A total of 14 VCs were in the treatment group (1,678 households) and the remaining 15 VCs were in the control group (1,853 households). Randomization was determined to have successfully created equivalent groups at baseline: treatment and control group mean characteristics across a range of program impacts were balanced. Sampling weights were calculated and adjusted to reproduce the total number of eligible households at the TA level, as well as the total number of households at the district level.
24
treatment households). No evidence of differential or overall attrition was detected among panel households at the midline follow-up, indicating that balance was preserved between treatment and control groups and sample representativeness was maintained.20
2.5.1.1. Ethics Approval
Study protocols, survey instruments, and consent procedures were approved by the
University of North Carolina at Chapel Hill Internal Review Board (UNC IRB Study No. 14-1933) and Malawi’s National Commission for Science and Technology, National Committee for Research in Social Sciences and Humanities (Malawi NCST Study No. RTT/2/20).
2.5.2. Derivation of the Analytical Sample and Attrition Analysis
Figure 2.1 depicts the derivation of the analytical sample used for this study. Of the 3,369 panel households interviewed, 79 were excluded from analysis due to missing data on outcome variables. The occurrence of missing data did not systematically differ between treatment and control households. The final sample included in this study includes 1,561 households from treatment communities and 1,729 household from control communities for a total of 6,580 observations across baseline and midline waves. Approximately 98 percent of panel households (3,290 households) and 93 percent of baseline households were retained for analysis in this study.
25
of the study may be compromised due to sample selection bias if participants non-randomly leave the study, thus reducing the original representativeness of the sample.
We examined differential attrition by comparing the average baseline characteristics of treatment and control households remaining in the analytical sample, and general attrition was examined by comparing the baseline characteristics of the analytical sample with households that attrited. We determined that differential attrition was not a problem in our sample, but did find some evidence of general attrition which could threaten the generalizability of the impact estimates. We checked to see if Inverse Probability Weights (IPW) could be a solution but ultimately decided that, given the absence of both differential and general attrition in the full household panel,64 the low rate of missing data (2.3 percent), and the risk of misspecification of the IPW model, we would assume that general attrition in the analytical sample was negligible and thus did not make any adjustments to the baseline sampling weights. Appendix 1 provides an in-depth explanation of the attrition analysis.
2.5.3. Measures
2.5.3.1. Outcomes of Interest
The outcomes of interest are at the household-level and are grouped by FNS component. Appendix 2 provides details for key study variables.
Indicators for current economic vulnerability to food and nutrition insecurity include a binary indicator equal to one if households reported worrying that there would not be enough food in the past seven days, the household’s annualized real per capita expenditures on food, and the household’s food share (the proportion of total household expenditures devoted to food). The evaluation survey instrument included the full Malawi Third Integrated Household Survey (IHS3) consumption expenditure module, so food expenditures and the household consumption aggregate were
26
poverty analysis in Malawi 2010-2013.65 Baseline nominal consumption was adjusted for spatial price differences, and midline nominal consumption was adjusted for both spatial and temporal cost-of-living differences using the Malawi National Statistical Office’s rural consumer price index to deflate midline prices and the spatial price index to reweight local prices to the national level. As such, all prices are reported in real August 2013 Malawian kwacha (MWK); the exchange rate in August 2013 was US$ 1 to MWK 330.20
27
The final FNS component we investigate is diet quality. We report the household’s diet diversity score (HDDS), the proportion of household daily food energy derived from staples
(cereals, grains, roots, tubers, and plantains), real annualized per capita expenditures on food groups, and household food group shares. We use the 12 food groupings recommended by the FAO 68 to derive the HDDS, and include foods produced at home, received as gifts, and purchased but consumed at home. The HDDS ranges from one to 12, and the 12 groups include: (1) cereals, (2) white tubers and roots, (3) vegetables, including Vitamin A rich orange tubers, (4) fruits, (5) meat, (6) eggs, (7) fish and other seafood, (8) legumes, nuts, and seeds, (9) milk and milk products, (10) oils and fats, (11) sweets, and (12) spices, condiments, and beverages, including alcohol. When reporting food group expenditures and shares, we combined HDDS groups with average shares of less than five percent in either wave. This resulted in five groups: the first combines HDDS groups (1) and (2), the second combines groups (3) and (4), the third group combines groups (5-7) and (9), the fourth groups is group (8), and the fifth group combines HDDS groups (10-12).
2.5.3.2. Intervention
The exposure of interest is whether the household receives the Malawi SCTP and is
represented as a binary indicator equal to one for beneficiary households and zero for delayed-entry control households.
28
categorical variable equal to one if the transfer share is greater than 30 percent, equal to two if the share is between 20 and 30 percent, equal to three if the share is between 15-20 percent, and equal to four if the share is less than or equal to 15 percent.
We conduct an intention to treat (ITT) impact analysis as we use predicted transfer levels rather than actual transfer amounts from program data; because all eligible households offered treatment took it up, the ITT can be considered equal to the average treatment effect (ATE).
2.5.3.3. Moderators
We examine the presence of heterogeneous program impacts on household FNS based on baseline household consumption, whether the household had more than four members at baseline (the cap for additional non-schooling per-person cash transfer increases), distance from the nearest food market, and the caregiver’s health knowledge. The first impact effect moderator is a binary indicator equal to one if the household was among the poorest 50 percent of beneficiary households at baseline. The second moderator is a binary indictor equal to one if the household had four or fewer members at baseline. The third moderator equals 1 if the household is within 1.5km of a food market, the median reported distance of households from the nearest food market. The last
moderator is a binary indicator equal to one if the household scored in the top third of the health knowledge score (refer to Appendix 2 for details). We include health knowledge as a potential treatment effect moderator because households that have knowledge about nutritious foods may be motivated to use the cash transfer differently than households that do not; for example, households with high health knowledge may be more likely to purchase smaller quantities of diverse foods compared to households that may use the transfer to increase cereal quantities.
2.5.3.4. Controls
29
livestock pests/disease, and unusually high costs of agricultural inputs, and whether the household experienced unusually high prices for food. The models also control for baseline values of the four moderator variables, as well as household baseline characteristics, including the natural log of household size, the number of household members in five age groups (0-5, 6-11, 12-17, 18-64, and 65 and older), the household dependency ratio, whether there were any single or double child orphans residing in the household, and characteristics of the household head including sex, age, marital status, schooling, chronic illness, and disability. Lastly, we also control for whether the household had accessed credit in the 12 months prior to the baseline survey, whether they had received cash, food, labor, or agricultural inputs from friends, family, or neighbors, and whether they had participated in food or cash programs or maternal and child nutrition programs in the 12
months before the baseline interview.
Although community-level prices for some items decreased between baseline and the midline follow-up, there is no evidence that the differences in prices over time is attributable to the SCTP, and there is no significant differential price inflation across treatment and control locations.20 2.5.4. Empirical Approach
Calculation of descriptive statistics and bivariate analyses were undertaken to check that the balance between treatment and comparison groups was maintained in the analytical sample for the variables of interest. We report t-tests for continuous outcomes and Pearson design-based F statistics for categorical variables. Means and significance tests control for clustering at the VC level69 and use baseline sample weights.
2.5.4.1. Main Impact Analysis
Our empirical strategy employs the difference-in-differences (DD) approach to examine the overall mean impact of the Malawi SCTP on household FNS outcomes. The DD estimator
30
changes over the same time period in the control group. The DD approach removes any time-invariant unobserved heterogeneity from both the treatment and control groups, and thus is able to account for both observed and time-invariant unobserved differences between treatment and control groups at baseline and for general time trends. The two key assumptions of the DD approach are the ‘parallel trends assumption’ – that the outcomes of the treatment group would follow the same trajectory as those actually experienced by the control group in the absence of the SCTP, and that there is no systematic time-varying unobserved difference between treatment and control groups. Although pre-baseline data are not available, the balance observed between treatment and control groups on a wide variety of household and individual factors provides convincing evidence that no pre-treatment systematic differences existed between beneficiary and delayed-entry households.
We pool the balanced household panel, and use the generalized linear model (GLM) framework to estimate the program impact; the basic estimating equation is given in Equation (1):
𝑌𝑗𝑘𝑡 = 𝑔(𝛽0+ 𝛽1𝑇𝑅𝐸𝐴𝑇𝑘+ 𝛽2𝑇𝐼𝑀𝐸𝑡+ 𝛽3(𝑇𝑅𝐸𝐴𝑇𝑘∗ 𝑇𝐼𝑀𝐸𝑡) + 𝛽4𝑋𝑗𝑘𝑡) + 𝜀𝑗𝑘𝑡 (1)
In this framework, the inverse function of g( ∙ ) is the linearizing link function. 𝑌𝑗𝑘𝑡 is the FNS outcome of interest for household j in VC k at time t. Baseline differences between treatment and control groups are given by 𝛽1 and the change in the outcome over time among the control group is
given by 𝛽2 (general time trends in the outcome). The DD estimator of program impact is given by
31
We use the GLM framework rather than ordinary least squares or basic maximum likelihood estimation because of the ease with which we can switch between models, as well as to avoid having to log-transform expenditure and Kcal outcome variables and then solve the subsequent
re-transformation problem. The GLM family and link functions selected to model each outcome are listed in Table 2.1. Family and link decisions were made based on which models had the lowest deviance, AIC, and BIC values (Appendix 3). Two-part models are used for continuous outcomes with substantial bunching at zero in order to calculate the overall average differential effect of the SCTP, rather than the program impact conditional on positive values of the dependent variable. A binary choice model is used in the first part to estimate the probability that the outcome will be greater than zero, and in the second part we specify a continuous GLM to model the distribution of the dependent variable conditional on positive outcome values. The user-written Stata program TWOPM 70 was used to estimate the models and calculate average marginal effects; the program automatically adjusts standard errors to account for both the first and second parts of the model. We calculate and report average marginal effects (AMEs) for each model for ease of interpretation and to facilitate making comparisons across models.71,72 The relative impact and effect size are also calculated for the main models of interest; the relative impact represents the program impact as a percentage of the mean baseline value among controls, and the standardized effect size is equal to the program impact divided by the standard deviation of the control group’s baseline values.
All models use baseline sample weights and standard errors are adjusted for clustering at the level of randomization – the VC. Stata 14 was used for all analyses.
2.5.4.2. Heterogeneous Impacts
32
index. Equation (1) is extended to include a triple-difference estimator that gives the differential program impact for those households that have non-zero values for the moderating variable of interest. The heterogeneous impact model is specified as:
𝑌𝑗𝑘𝑡= 𝑔 (
𝛽0+ 𝛽1𝑇𝑅𝐸𝐴𝑇𝑘+ 𝛽2𝑇𝐼𝑀𝐸𝑡+ 𝛽3(𝑇𝑅𝐸𝐴𝑇𝑘∗ 𝑇𝐼𝑀𝐸𝑡) + 𝛽4𝑋𝑗𝑘𝑡+ 𝛽5𝑀𝑂𝐷𝑗𝑘
+ 𝛽6(𝑇𝑅𝐸𝐴𝑇𝑘∗ 𝑀𝑂𝐷𝑗𝑘) + 𝛽7(𝑇𝐼𝑀𝐸𝑡∗ 𝑀𝑂𝐷𝑗𝑘) + 𝛽8(𝑇𝑅𝐸𝐴𝑇𝑘∗ 𝑇𝐼𝑀𝐸𝑡∗ 𝑀𝑂𝐷𝑗𝑘)
) + 𝜀𝑗𝑘𝑡 (2)
𝑀𝑂𝐷𝑗𝑘 represents the effect modifier, and 𝛽8 gives the differential impact of the program by
moderator status.
2.5.4.3. Transfer Share
A final fundamental issue is the value of the transfer, which is critically important for the extent of program impacts that can be expected. The cash transfer must constitute a large enough portion of the target population’s pre-program consumption in order to generate impacts.
Experience from cash transfer programs around the world, including several major African
programs, suggests that transfers should deliver at least 20 percent of pre-program consumption as a ‘rule of thumb’.14,20
We model the transfer share each household in the evaluation sample is likely to receive in three different ways. First, we model the transfer share as a continuous percentage of the
household’s annual consumption. Equation (1) is modified by adding the continuous treatment share variable TXSHRk.
𝑌𝑗𝑘𝑡= 𝑔 (
𝛼0+ 𝛼1𝑇𝑅𝐸𝐴𝑇𝑘+ 𝛼2𝑇𝐼𝑀𝐸𝑡+ 𝛼3𝑇𝑋𝑆𝐻𝑅𝑗𝑘+ 𝛼4(𝑇𝑅𝐸𝐴𝑇𝑘∗ 𝑇𝐼𝑀𝐸𝑡) + 𝛼5(𝑇𝑅𝐸𝐴𝑇𝑘∗ 𝑇𝑋𝑆𝐻𝑅𝑗𝑘)
+ 𝛼6(𝑇𝐼𝑀𝐸𝑡∗ 𝑇𝑋𝑆𝐻𝑅𝑗𝑘) + 𝛼7(𝑇𝑅𝐸𝐴𝑇𝑘∗ 𝑇𝐼𝑀𝐸𝑡∗ 𝑇𝑋𝑆𝐻𝑅𝑗𝑘) + 𝛼8𝑋𝑗𝑘𝑡
33
In Equation (3), 𝛼7 gives the marginal program impact of an increase in the transfer share among beneficiary households; the average program impact among beneficiary households is equal to 𝛼4+ 𝛼7.
We then model the transfer share as a dichotomous indicator of whether the share is greater than or equal to 20 percent of baseline consumption. In order to better compare treatment
households with control households having similar expected transfer shares, we replace the treatment dummy and the transfer share variable in Equation (3) with three program indicators:
TTXSHRHjk is equal to one for beneficiary households with an expected transfer share greater than
or equal to 20 percent and is equal to zero otherwise; TTXSHRLjk is equal to one for beneficiary
households with expected transfer levels below 20 percent; and CTXSHRHjk is equal to one for
control households with high expected transfer shares and equal to zero otherwise. The impact of the SCTP among beneficiary households receiving a high transfer share, relative to control
households with expected high shares, is given in Equation (3) by 𝛼5− 𝛼7, and the program impact
on beneficiary households receiving low transfer shares relative to comparison households with expected low shares is given by 𝛼6.
𝑌𝑗𝑘𝑡= 𝑔 (
𝛼0+ 𝛼1𝑇𝐼𝑀𝐸𝑡+ 𝛼2𝑇𝑇𝑋𝑆𝐻𝑅𝐻𝑗𝑘+ 𝛼3𝑇𝑇𝑋𝑆𝐻𝑅𝐿𝑗𝑘+ 𝛼4𝐶𝑇𝑋𝑆𝐻𝑅𝐻𝑗𝑘+ 𝛼5(𝑇𝐼𝑀𝐸𝑡∗ 𝑇𝑇𝑋𝑆𝐻𝑅𝐻𝑗𝑘)
+ 𝛼6(𝑇𝐼𝑀𝐸𝑡∗ 𝑇𝑇𝑋𝑆𝐻𝑅𝐿𝑗𝑘) + 𝛼7(𝑇𝐼𝑀𝐸𝑡∗ 𝐶𝑇𝑋𝑆𝐻𝑅𝐻𝑗𝑘) +𝜀𝑗𝑘𝑡 ) (4)
Lastly, equation (4) is extended to model the transfer share as a categorical variable. There are now seven program dummies: TTXSHR1jk, TTXSHR2jk, TTXSHR3jk, and TTXSHR4jk
correspond to beneficiary households with transfer shares greater than 30 percent, between 20 and 30 percent, between 15 and 20 percent, and less than 15 percent of baseline consumption,
34
transfer shares greater than 30 percent, between 20 and 30 percent, between 15 and 20 percent. Equation (4) presents this specification; the impact of the program among beneficiary households with the highest shares, relative to similar control households, is given by 𝛼9− 𝛼13, the impact among beneficiary households with shares between (20,30] percent compared to control households with expected shares between (20,30] is equal to 𝛼10− 𝛼14, the impact for treatment households
with shares between (15,20] percent compared to similar control households is 𝛼11− 𝛼15, and 𝛼12
is the impact of the SCTP among beneficiary households with low transfer shares compared to control households with low expected shares.
𝑌𝑗𝑘𝑡= 𝑔
(
𝛼0+ 𝛼1𝑇𝐼𝑀𝐸𝑡+ 𝛼2𝑇𝑇𝑋𝑆𝐻𝑅1𝑗𝑘+ 𝛼3𝑇𝑇𝑋𝑆𝐻𝑅2𝑗𝑘+ 𝛼4𝑇𝑇𝑋𝑆𝐻𝑅3𝑗𝑘+ 𝛼5𝑇𝑇𝑋𝑆𝐻𝑅4𝑗𝑘+ 𝛼6𝐶𝑇𝑋𝑆𝐻𝑅1𝑗𝑘
+𝛼7𝐶𝑇𝑋𝑆𝐻𝑅2𝑗𝑘+ 𝛼8𝐶𝑇𝑋𝑆𝐻𝑅3𝑗𝑘+ 𝛼9(𝑇𝐼𝑀𝐸𝑡∗ 𝑇𝑇𝑋𝑆𝐻𝑅1𝑗𝑘) + 𝛼10(𝑇𝐼𝑀𝐸𝑡∗ 𝑇𝑇𝑋𝑆𝐻𝑅2𝑗𝑘)
+𝛼11(𝑇𝐼𝑀𝐸𝑡∗ 𝑇𝑇𝑋𝑆𝐻𝑅3𝑗𝑘) + 𝛼12(𝑇𝐼𝑀𝐸𝑡∗ 𝑇𝑇𝑋𝑆𝐻𝑅4𝑗𝑘) + 𝛼13(𝑇𝐼𝑀𝐸𝑡∗ 𝐶𝑇𝑋𝑆𝐻𝑅1𝑗𝑘)
+𝛼14(𝑇𝐼𝑀𝐸𝑡∗ 𝐶𝑇𝑋𝑆𝐻𝑅2𝑗𝑘) + 𝛼15(𝑇𝐼𝑀𝐸𝑡∗ 𝐶𝑇𝑋𝑆𝐻𝑅3𝑗𝑘) +𝜀𝑗𝑘𝑡 )
(5)
It is important to note that the transfer share equations are defined for all study households, not just beneficiaries. The significance of linear combinations of coefficients was calculated using the LINCOM post-estimation command in Stata 14.
2.6. Results
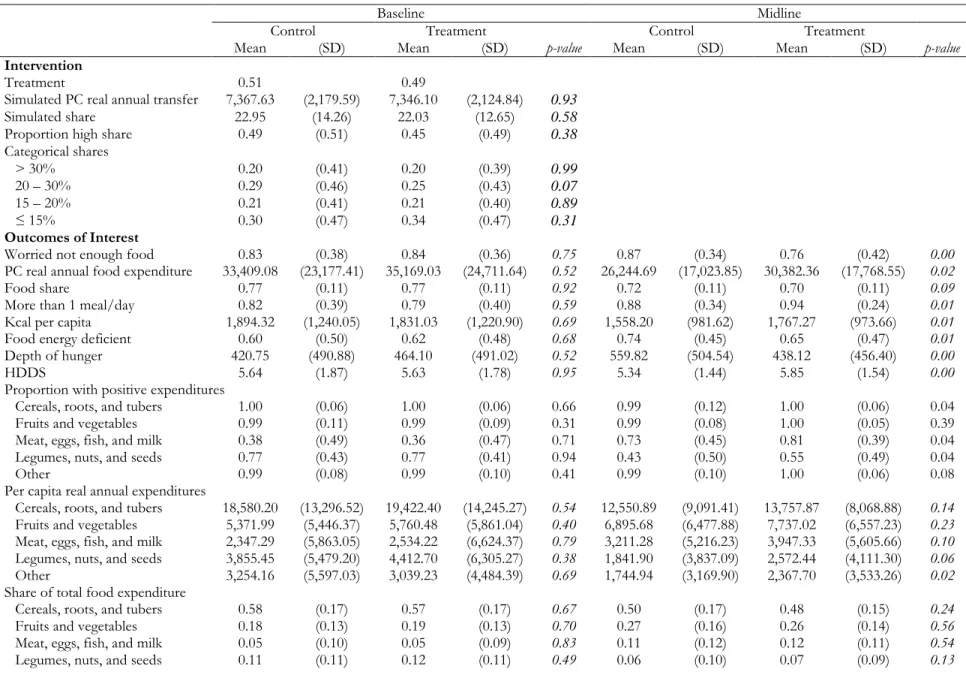
2.6.1. Descriptive Statistics
35
Of the 3,290 households that met the sample criteria, over 80 percent reported worrying that they would not have enough food during the past week at baseline; at the midline follow-up the percentage of control households worrying about food increased by four percentage points, comparted to an eight percentage point decrease among program households. Approximately 80 percent of study households were consuming more than one meal per day at baseline, and at midline this percentage increased to 88 percent of control households and 94 percent among treatment households. Due to seasonality, daily per capita apparent calorie availability declined over time for all households, coinciding with a general increase in the proportion of households that were food-energy deficient. Control households experienced an increase in hunger depth, while the average calorie gap decreased among treatment households. The mean HDDS remained stable over time, with households consuming between five to six different food groups on average. Total
consumption and food consumption declined between baseline and follow-up. On average, households decreased spending on cereals, roots, and tubers, as well as ‘other’ food groups such as oils, fats, spices, etc., while increasing consumption of fruits and vegetables and meat, eggs, fish, and dairy products. Households devoted 77 percent of their total expenditures to food at baseline, the majority of which went to staple foods.
36
household member was supporting nearly three children or elderly members, and nearly 40 percent of all households were caring for at least one orphan. Heads of households tended to be older illiterate women with no schooling, many of whom were widowed and chronically ill. Most households were not using credit at baseline, but did report receiving cash, food, and other consumables from non-household members, and fewer than 20 percent of households were participating in food or cash social safety net programs.
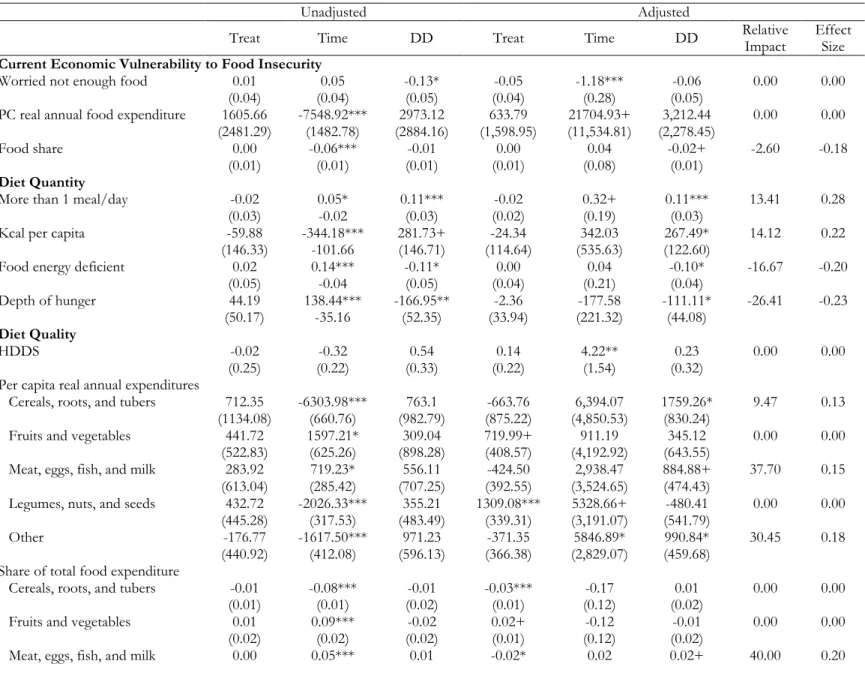
2.6.2. Main Impact Results
At the time of midline data collection households had received between five and six bi-monthly payments and so had been in the program for approximately one year; as such, results should be interpreted as one year impacts.
Table 2.3 presents the main program impact results estimated from Equation (1). The first three columns present marginal effect from an unadjusted model controlling only for time,
treatment, and the difference-in-differences dummy variables. The remaining columns are estimated from models that adjust for the full vector of control variables in addition to the DD specification.
We did not find strong impacts of the SCTP on households’ current economic vulnerability to food insecurity. Beneficiary households reduced their food share by two percentage points (p =
0.10), and while not statistically significant, program impacts on the probability of worrying about
having enough to eat and on total food spending were in the expected direction.
37
mean caloric deficit was 111.11 Kcal lower among the treatment group compared to the mean hunger gap in control households (p = 0.05).
There is weak evidence that the program had an impact on diet quality. The DD estimate is positive but not significant for the household diet diversity score. The program significantly
increased spending on three food groups: cereals, meat, and other, although program impacts on meat expenditures and the meat food share were only marginally significant (p = 0.10).
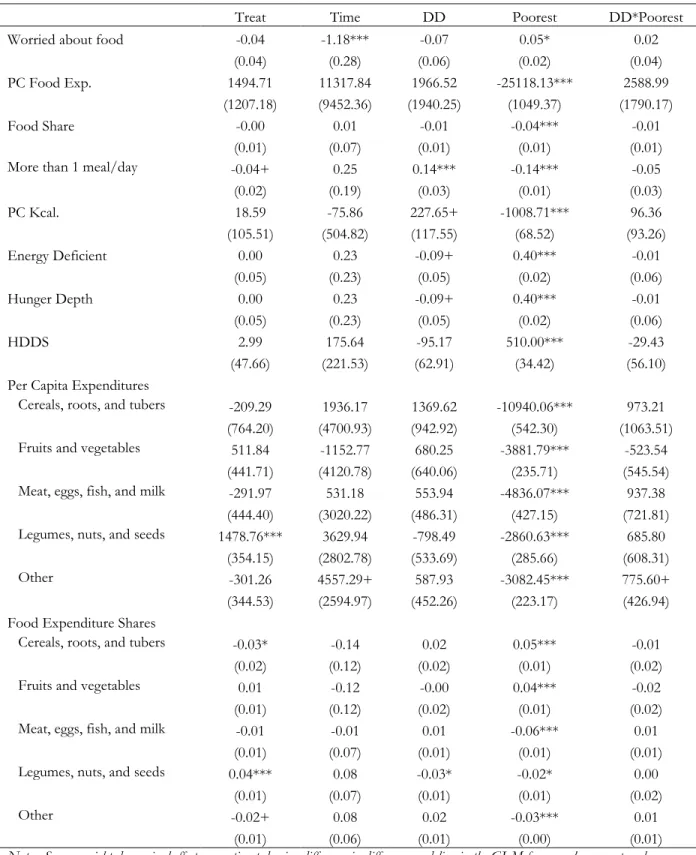
Full results for the adjusted models are presented in Appendix 4. Although all study households are poor, households from the bottom half of the baseline consumption distribution fared worse than those from the top on every FNS outcome. The poorest households were five percentage points more likely to worry about not having enough food (p = 0.01), were 10 percentage points less likely to eat multiple meals per day (p = 0.001), and were 24 percentage points more likely to be food energy deficient (p = 0.001). The poorest households also had lower total food
expenditures, reduced caloric availability, and a larger hunger gap, and consumed on an average of one fewer food groups. Households experiencing unusually high prices for food also fared worse than those households that did not suffer food shocks. They spent less on food, had lower apparent caloric consumption, and were more likely to be food-energy deficient with a larger depth of hunger. Households experiencing a food shock at midline were 15 percentage points more likely to worry about not having enough food (p = 0.001).
2.6.3. Heterogeneous Impacts