BRAND MESSAGES ON TWITTER: PREDICTING DIFFUSION WITH TEXTUAL CHARACTERISTICS
Chris J. Vargo
A dissertation submitted to the faculty at the University of North Carolina at Chapel Hill in partial fulfillment of the requirements for the degree of Doctor of Philosophy in the School of
Journalism and Mass Communication.
Chapel Hill 2014
ABSTRACT
Chris J. Vargo: Brand Messages On Twitter: Predicting Diffusion With Textual Characteristics
(Under the direction of Joe Bob Hester)
ACKNOWLEDGEMENTS
There are several people that have made this dissertation possible outside of my family and friends. First, I thank Dr. Joe Bob Hester. Without his intelligence, diligence and
PREFACE
TABLE OF CONTENTS
LIST OF TABLES ... xi
LIST OF FIGURES ... xii
Chapter 1: Literature Review ... 1
The Origin of Brands on Social Media ... 1
Brand Behavior and Goals on Social Media ... 6
Virality ... 8
Viral Marketing is Not Viral ... 10
Influential Followers vs. a Ton of Followers: Which is Better? ... 12
Brand Differences by Type ... 16
Brand Differences by Connection Type ... 17
Message Content and Virality ... 19
Emotion ... 21
Emotions and Advertising ... 22
Emotion as a Measured Characteristic of Text ... 25
Emotion as a Measured Characteristic of Text: Arousal ... 28
Defining Concreteness ... 32
Concreteness and Advertising ... 36
Other Characteristics of a Social Media Message ... 43
Summary of Literature Review ... 46
Chapter 2: Method ... 48
Selection of the Brands ... 48
Variables ... 49
Retrieving Tweets from Twitter ... 50
Human Reliability Check: Sentiment, Arousal and Concreteness ... 53
Computer Automated Measure of Arousal ... 55
Computer Automated Measure of Concreteness ... 57
Establishing Reliability for Computer Coded Variables ... 57
Creating Interactions for Concreteness ... 60
Preparation for Regression ... 60
Chapter 3: Results ... 61
RQ1: Retweet and Favorite Counts ... 61
RQ2: Number of Followers ... 61
RQ3: Differences by Brand ... 62
RQ4: Following Counts ... 64
RQ5: Sentiment ... 65
RQ6: Arousal ... 65
RQ7: Concreteness ... 66
RQ8: Favorites Predicting Retweets ... 69
RQ11: Images ... 70
RQ12: “All in” predictive model ... 70
Chapter 4: Conclusion ... 73
How Viral are Brand Messages? ... 73
Follower Counts ... 74
Differences by Brand Type ... 74
Sentiment ... 75
Arousal ... 76
Concreteness ... 77
Other Characteristics of the Brand ... 78
Images ... 79
The Difference between Favorites and Retweets ... 79
Overall Conclusion ... 80
Chapter 5: Discussion & Limitations ... 81
Arousal for Retweeting, Sentiment for Favoriting ... 81
Concreteness ... 81
More Linguistic Properties ... 83
Expanding Brand Types ... 83
The True Power of Images ... 84
Training Content Analysts ... 85
Injection and Selection of Tweets with Characteristics ... 85
APPENDIX 1: PYTHON SCRIPT FOR DATA COLLECTION ... 87
APPENDIX 2: SUMMARY OF TWEETS COLLECTED ... 89
APPENDIX 3: STUDENT RELIABILITY INSTRUCTIONS & SAMPLE SURVEY ... 90
APPENDIX 4: STUDENT-TO-STUDENT AGREEMENTS AND ALPHAS ... 97
APPENDIX 5: PYTHON SCRIPT THAT CALCULATES SCORES FOR AROUSAL .... 98
APPENDIX 6: THE TOP 25 MOST RETWEETED TWEETS FROM BRANDS ... 101
APPENDIX 7: THE 25 MOST FAVORITED BRAND TWEETS ... 103
LIST OF TABLES
Table 1 – Twitter Demographics ... 3
Table 2 – Brands Included in Study ... 48
Table 3 – Twitter Handles for Brands in Study ... 49
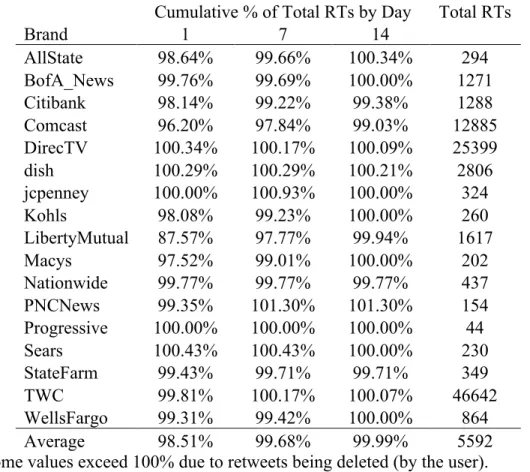
Table 4 – Daily Retweet Percentages ... 51
Table 5 – Tweet Metadata ... 52
Table 6 – Retweet Means by Brand Type ... 63
Table 7 – Favorite Count by Brand Type ... 64
Table 8 – 2x2 ANOVA (Image x Concreteness) Comparison of Retweet Means ... 67
Table 9 – 2x2 ANOVA (Image x Concreteness) Comparison of favorite Means ... 67
Table 10 – 2x2 ANOVA (Hashtag x Concreteness) Comparison of Retweet Means ... 68
Table 11 – 2x2 ANOVA (Hashtag x Concreteness) Comparison of Favorite Means ... 68
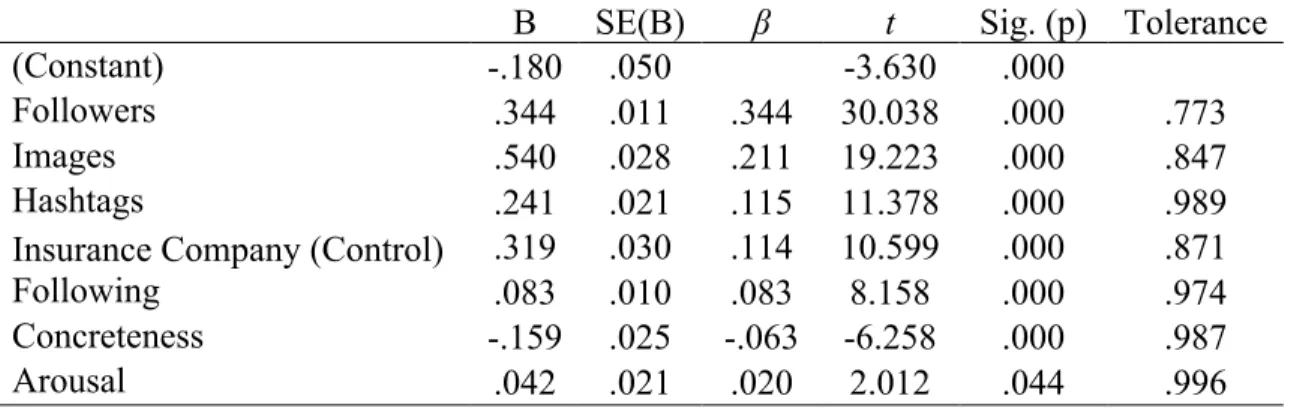
Table 12 – Summary of Multiple Linear Regression Analysis for Retweet Count ... 71
LIST OF FIGURES
Chapter 1: Literature Review
The Origin of Brands on Social Media
Almost every popular consumer brand now has a social media presence (Brandwatch, 2013). Still, the history of brands’ activity on social media is relatively new. Facebook was perhaps the first social networking service adopted by brands (Borhani, 2012). In 2006, when Facebook decided to open profiles to anyone 13 and older, brands began to create profiles on the service (Borhani, 2012). Initially, brands signed up for the same account as consumers. They had access to the same user interface. Brands could “friend” people, post messages and respond to friends. Some argue that major businesses did not seriously pay attention to Facebook until 2007 when the “group page” functionality was added (Richmond, 2007). This separated brand
receive information. While Facebook continues to evolve, these basic functionalities have been present for almost six years.
Following Facebook in 2006, Twitter gained popularity as a micro-blogging service. In a world of many social media services, Twitter differentiates itself in two ways: messages are public and brief. The majority of information created by users is open for all to see (Vieweg, 2010). This is different from Facebook, on which the majority of the content is perceived to be private (e.g. person-to-person) or semi-private (e.g. person to a contained network of people) (Kwak et al., 2010). Twitter has placed an emphasis on being a public medium by calling itself “…a platform for you to influence what’s being talked about around the world…” (About Us, 2010). Users of Twitter follow other users, but relationships are often not reciprocal. Few users gather many followers, while many users gather a few (Vargo, 2013a). Users follow a mix of sources ranging from news services to celebrities. Like Facebook, messages from those users are curated into a person’s news feed. Those messages (i.e. “tweets”) are posts or status updates. The term is as much a play on the size of the message as it is on the audible similarity to Twitter. A tweet can be a combination of any 140 characters. The origin of the character limit can be traced to Twitter’s origin as a text messaging service, but it is now embraced as a distinctive
characteristic of the service.
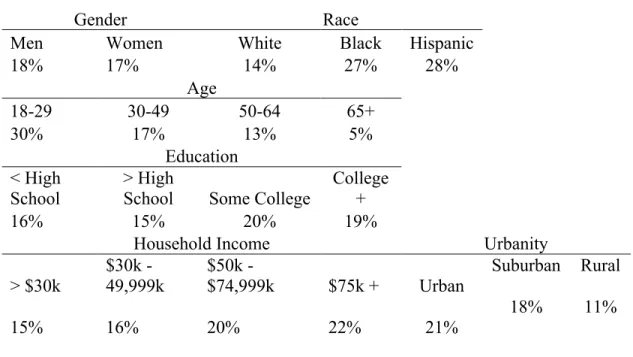
Table 1 – Twitter Demographics
Gender Race
Men Women White Black Hispanic
18% 17% 14% 27% 28%
Age
18-29 30-49 50-64 65+
30% 17% 13% 5%
Education < High
School > High School Some College College +
16% 15% 20% 19%
Household Income Urbanity
> $30k $30k - 49,999k $50k - $74,999k $75k + Urban Suburban Rural
15% 16% 20% 22% 21%
18% 11%
Source: Pew Research Center's Internet & American Life Project Spring Tracking Survey, April 17 - May 19, 2013. N = 1,895 adult internet users 18+.
survived competition in the marketplace of ideas. Dawkins provides examples in his book that include chain letters and rumors (1976).
In a content analysis of Twitter, Catone finds that memes do exist on Twitter. His definition of memes however, varies slightly (2008). First, he recognizes that not everything posted to Twitter is intended to be a meme. Users post status updates of everyday occurrences (i.e. what a user ate for lunch or delays experienced at an airport). Second, there are short-term memes, which he defines as temporal events that are of interest to a larger audience. Conversations can last from a few minutes to a few hours. For example, a television show will have some buzz before, during and for a short time after the show airs. The final type of discussion widely observed on Twitter refers to long-term memes. Long-term memes are topics of interest that people talk about for days, weeks or even months. Catone observes politics and new video games as examples of longer-term discussions happening on the service (2008).
Across all three types, chatter involves the everyday occurrences and interests of users. Consumers interact with brands daily. It is no surprise, then, that users engage in brand
conversations on Twitter. In a 2012 study, a projected 39 percent of all Americans tweeted about a brand (Borhani). Moreover, 29 percent follow a brand on Twitter. Coupled with the finding that people of all demographics are found to have user profiles, Twitter is a viable space to engage with consumers.
Facebook until the user “likes” the brand’s page. The increased interactivity and visibility that Twitter affords has sparked the interest of brands. 97 percent of major brands have active Twitter accounts as of 2013. Brandwatch’s survey found that while 25 percent of brands’ accounts only broadcasted messages, 69 percent of accounts broadcasted and engaged with consumers. The survey also found that more brands engaged in two-way communication on Twitter than on Facebook. Brands are beginning to interact so much that 66 percent of brands on Twitter created new accounts in the past year. The primary motive for the new accounts is to keep interactions (e.g. customer service and support) separate from accounts that primarily broadcast messages. Brands are also sending more tweets than ever before; 45 percent of brands tweet 10 to 49 messages per week.
Over time the service has introduced brand friendly features. Advertisement options now exist on Twitter. Brands can pay Twitter to gain exposure with non-followers. Brands can inject messages into a user’s timeline; they may also opt for a sponsored spot in the user
recommendation panel. Brands are, in turn, suggested to targeted users. In the trends panel, topics can be sponsored. Recent multimedia improvements allow brands to display a wider array of content in tweets. Images can now be displayed inline below the text of a tweet. Users no longer need to “activate” (e.g. click or tap) a tweet to see photos included with tweets. When a tweet is activated, video and other multimedia content can be embedded (e.g. slideshows and graphics).
that includes Twitter. Only 66 percent of social media teams reside in marketing, corporate communications and public relations departments (Solis & Li, 2013).
Brand Behavior and Goals on Social Media
Dedicated social media staffs exist inside all types of business units, including: human relations, product development, advertising, customer experience, information technology, executive, legal and marketing research teams. Social media are used to support many different aspects of a brand. In a study of brands on Twitter, Borhani found several use cases (2012). (1) Brands now monitor the conversations of consumers. By analyzing mentions of their brands, they can listen and learn. Digging further into social data, brands can look at users by
demographic, by the moods they evoke or even the words they mention. (2) Brands gain customers and stakeholders via Twitter. (3) Brands broadcast marketing materials, such as coupons and promotions. (4) Brands use Twitter to broadcast public relations messages, such as important news. (5) Twitter can be used to engage in public conversations with employees about a brand. (6) Personal connections are made with users through engaging with them in everyday chatter. (7) Customer service is rendered and issues are solved via Twitter.
Yan argues all of these behaviors should abide by nine rules of social media engagement (2011). These rules help to effectively build a brand on Twitter. (1) All communication directly with consumers must foster a sense of membership or citizenship with the brand. (2) Messages should stick to the core values of the brand. (3) Messaging should encourage the audience to engage in a dialogue. (4) Listening to that dialogue should help the organization find a
build positive brand associations. (8) Interactions must also boost the perceived quality of the brand and not devalue it. (9) Finally, broadcasted (i.e. non-customer service) messages should build greater awareness of the brand by targeting audiences that it has not yet reached.
These rules pertain to brand management (2, 4, 5, 6, 7, 8) and brand engagement (1, 3, 7, 9). This dissertation focuses on a particular aspect of brand engagement. When consumers respond to messages broadcasted from a brand, this engagement is public (Montalvo, 2011). As such, others see it. This dissertation is specifically interested in cases where consumers share and pay attention to brand messages on Twitter with friends (i.e. by “retweeting” or “favoriting” them). When consumers share these messages, the content spreads. Solis and Li found that the most widely shared goal of social media strategists was to market their content as widely as possible to consumers (2013).
The key difference between a retweet and a favorite is the intentional sharing function that comes with retweeting. When a user performs a retweet, that message is rebroadcasted. This sharing function allows new users, ones following the person who just performed the retweet, to see that tweet in their timelines. When this interaction occurs for a brand, its organic reach grows. The more retweets a brand generates for a message, the more people see it, at no cost to the brand.
Twitter has also blurred the lines between favoriting and retweeting with the advent of the “Discover tab.” “The Discover tab surfaces the best content from around Twitter and is personalized for you” (Using the Discover Tab, 2014). As such, it curates tweets that have been favorited by the users that a user follows. It displays those favorites to that user inside of the Discover tab. In this instance, a favorite is similar to a retweet. Finally, the complete list of favorites for any user can been seen by visiting that user’s profile. This function does not exist for retweets. When the favorite interaction occurs for brands, their organic reach also grows. While it may not be as straightforwardly quantifiable as a retweet, the more retweets brands garner for a message, the more people see the message at no cost to the brand. Retweets and favorites are two separate types of interactions. While their functions are similar, it is conceivable that there would be scenarios when certain tweets would have more of one than another. This dissertation will attempt to predict both.
How can consumers be encouraged to engage with marketing content and share it with their social networks? This question has no simple answer. Many scholars have realized that the most successful marketing campaigns were ones that went “viral” (Gladwell, 2002). Rarely do viral marketing campaigns go viral (Goel, Watts & Goldstein, 2012). There are times when a marketing campaign spreads through social networks. People can spread the word like wildfire. This observation has piqued interest in marketers and scholars alike.
Virality
was first used to describe the widespread diffusion of a piece of information. This meaning aligns with early uses of the word from the 18th century, during which it was used to describe prolific growth (Wilkes, 1825). In communication, sociology and many other disciplines, virality is talked about in a diffusion sense (Watts & Dodds, 2007; Goel, Watts & Goldstein, 2012). Here, information, advertisements or products are the “virus” that is spread. The patterns of how information is dispersed in networks of people are analyzed.
In the marketing and advertising fields, Phelps et al. pin the origin of the word virality and defined it as the rapid spread of a marketing tactic through a network of highly connected people (2004). When writing a short column for Boardwatch Magazine, Knight linked marketing with virality (1997). The new term viral marketing was born. The article was enamored with how quickly the Internet could enable new products and services to gain popularity (2004).
Companies could manipulate “the network effect” of the Internet and reach millions of people that were connected. The article cited the first example of viral marketing as Hotmail, the widely used email service. Knight claimed that by putting a footer on every email that invited others to sign up, Hotmail was able to manipulate the network of millions of people who were connected. The result was 50 million signups. “This [viral marketing tactic] spreads organically like a virus as people use the medium to communicate with friends” (Knight, 1999, p. 50).
One key similarity between Dichter’s first writings on WOM and the viral marketing literature is the way in which diffusion has been portrayed. Many people pass on a message. Because many people are connected to many more people, that message spreads across a population of people. This is a core principal in the WOM literature and in this dissertation. As Goel, Watts and Goldstein notice, a large initial cascade is rarely enough for something to be truly viral (2013). Instead, it must pass from person to person. As a result, the amount of times a message is passed on can be a good measure of how wide that message spreads across a network. Viral Marketing is Not Viral
The term virality implies contagious. Imagine the flu; it can spread like wildfire. Each person infects a large percent of people with whom they come in contact. Two years ago, Chris’ father-in-law had the flu. He gave it to his entire family. Chris’ wife gave it to him. And then, Chris gave it to his entire family. This flu was truly viral. Information is not shared like the flu on social media (Goel, Watts & Goldstein, 2013; Hofman, 2013; Watts & Dodds, 2007; Berger, 2012). The majority of content posted online does not spread like wildfire, but some things do become wildly popular. When content is somehow special, does it spread like the flu?
occurrence when a message was passed on for many generations, those multi-generational shares did not account for a large percentage of the times the content was shared. This phenomenon was also observed on the social bookmarking service Digg. Stories that spread mainly through a submitter’s social neighborhood proved not to be very popular (Lerman & Galstyan, 2008). This phenomenon was observed for even the “top users” of Digg (i.e. the users with the most
followers). While these users did tend to get the most amount of “up votes,” their social networks were not enough to make content spread widely across the network.
Returning to the flu analogy, when Chris’ father-in-law shared the flu, Chris got the flu, but not directly from him. The flu was passed from Chris’ father-in-law, to his mother-in-law, to his wife and finally to him. Many scholars have shown that multigenerational sharing of
information rarely occurs on online social networks (Anderson et al., 2013; Hofman, 2013; Watts & Dodds, 2007). Newer research suggests that this is even true of Twitter accounts with many followers (Anderson et al., 2013). If the flu were like what these scholars have observed on social media, you may expect that Chris’s father-in-law would have passed the flu on to one or two people, and the spread would have stopped there.
For this dissertation, it is then expected that messages (i.e. tweets) from brands will have low infectivity. Popular brands will likely have many followers, and therefore, many people listening to their messages (Vargo, 2013a). Still, few will pass them on to others (i.e. by Retweeting those messages).
RQ1a: How frequently are brand messages shared on Twitter?
Influential Followers vs. a Ton of Followers: Which is Better?
Regardless of the general level of infectivity on Twitter, brands want to maximize their propensity for their messages to be shared. As brands grow fan bases on Twitter, academic research stands at odds on how best to accumulate followers with this goal of infectivity in mind. Should a brand accumulate the largest follower count possible on Twitter to maximize message dissemination? Or, should a brand care about attracting influential opinion leaders first and foremost?
The most popular theory in the communications discipline that discusses this process is two-step flow. Many theories have been connected to two-step flow. It came in the early era of mass communication theory, at a time when the mass media had previously been thought to have an all-powerful effect. This effect was thought to exist on all types of decision-making. The mass media was thought to control our opinions on everything from news to consumer behaviors (Weimann, 1994). From this view, two-step flow emerged as one of the leading new models that explained how consumers were influenced (Weimann, 1994; Katz and Lazarsfeld 1955;
Lazarsfeld, Berelson, and Gaudet 1968). The theory explained how the media and a select group of influential people worked in a network of communication to influence the masses.
provides evidence that opinion leaders drive the diffusion of innovations. He shows that, in some cases, the success of a new product may hinge on whether influential people adopt the product early in the adoption process.
The two-step flow argument reappeared in popular nonfiction with Gladwell’s The Tipping Point (2002). Gladwell vividly describes a group of people as similar to Paul Revere for their ability to disseminate information quickly and efficiently. He claims that these people have a “set of social gifts” that separates them from everyday people. In using terminology such as “influentials,” “connectors,” “mavens” and “salesmen” these people have the ability of
influencing tons of people around them. Borrowing from the book title, these people can provide a certain advantage that tips the scale of public opinion. Gladwell provides examples of people throughout history who had exceptionally large social networks. When they chose to spread an idea, product or even a restaurant recommendation, their influence was exceptional. Gladwell argues that just one influential can start a momentous cascade of WOM. Just a few of these people combined can provide enough of a social cascade to spread an idea to full adoption in a community. Since Gladwell coined the phrase influentials, a renewed interest in targeting those that tend to influence many has resurfaced. In a review of influentials research, Roch concludes, “in business and marketing, the idea that a small group of influential opinion leaders may accelerate or block the adoption of a product is central to a large number of studies” (2005).
the power of a few influential individuals (2002). Instead, he depicts diffusion as a grassroots effort. For something to catch on, many people talk to their few friends. They talk to them because whatever they encountered or observed is something great. Because they have ample time in conversations, they are likely to tell their friends. Many talking to many start the largest social cascades. Berger argues while each individual may only influence a small amount of others, these numbers add up when ideas are “contagious.”
Watts and Dodds modeled the patterns of cascades (2007). They define cascades as the process whereby something, typically information or knowledge, is successively passed on to others. Cascades vary in how widely they are spread (i.e. the amount of diffusion they receive). Watts and Dodds argue that cascades are more complicated than understood by the opinion leader research. They refute the idea that influentials are vital to the formation of public opinion (2007). The researchers supply evidence in the form of computerized social networks. In
simulated models, Watts and Dodds built a network of 10,000 individuals. Each individual was given an influence threshold (i.e. a tolerance level that must be satisfied before that individual would pass along a message). The researchers tested the “influentials hypothesis by setting different levels of connectedness for certain actors in the network. Some were central to the network and well connected. Others were isolated in the network and had few connections. Inspired from Gladwell’s The Tipping Point, a small percent of the total actors had many
connections, and the rest had relatively few. After the networks were configured, one person was picked at random as a starting point. Then, based on the acceptance thresholds, people either did or did not pass on the message. If they did pass on the information, the people they were
different ways the researchers found that the largest cascades began with average actors. Under most of the social conditions that the researchers considered, they found that large cascades were not started by influentials. Instead, the drivers of widespread diffusion were easily influenced individuals. The researchers note that, under the majority of all scenarios, influentials were only modestly more important than average individuals.
Hofman has also shown that the largest social cascades do not occur when a single person introduces content, but when many people introduce content (2013). Hofman, too, observed the viral diffusion method on Twitter. He shows that for a viral video, typically each person that introduces the content garners a few additional adoptions. While some adoptions are greater than others, no one adoption can attribute for a large amount of diffusion (2013). Quercia et al. too found that the largest cascades came from users with a large amount of followers (2011). They, therefore, suggested that marketers target a large number of potential influencers, thereby capturing average effects.
It is for these cases, that this dissertation will adopt the Watts and Dodds observation that a large audience drives virality and that diffusion can be most reliably caused by masses of easily influenced people (2007). As such, this dissertation expects that brands with more followers will reach more people.
RQ2a: What effect will the number of followers have on the average number of shares (i.e. retweets) that brand’s tweets receive?
With all of the literature on influentials and opinion leaders, it is hard to completely downplay the existence of some social order of influence. In all reality, as many researchers have noted, when dealing with macro-level judgments, one scenario cannot always be correct
(Anderson et al., 2013). In predictive models dealing with large data, large amounts of predictive errors occur. Moreover, there are certainly times when the influentials have been shown to result in large social cascades of diffusion (Watts & Dodds, 2007; Anderson et al., 2013). Still,
knowing the effect that follower counts have on diffusion will put into prospective its importance as a social media metric of influence. Cha et al. warn that this statistic is often overhyped, which they explain in their paper entitled the “Million Follower Fallacy” (2010). The researchers found that users with large amounts of followers were not consistently influential. The most followed users were observed as being particularly unsuccessful at spawning large amounts of retweets. Instead, the authors suggest that retweets are driven by the content value of a tweet.
Brand Differences by Type
(Amblee & Bui, 2008). Some categories had more reviews than others. This dissertation will survey many different types of brands. Taking these findings, the expectation is that the amount of WOM generated will vary by brand type.
RQ3a: On average, do certain types of brands tend to have messages shared (i.e. retweets) more than other types?
RQ3b: On average, do certain types of brands tend to have messages favorited more than other types?
Brand Differences by Connection Type
In WOM networks, information travels through people who are connected through social ties (Dichter, 1966). Those ties can be friendships, professional relationships or through an Internet service, such as following a user on Twitter. Any possible social setting in which people interact can be thought of as a network (Rosen, 2009). Brands are connected to users on Twitter. The most common scenario for popular brands is to have a uni-directional tie with their
consumers (Vargo, 2013a). Consumers follow brands. Some brands on Twitter form a closer bond with their customers by returning the favor (i.e. following them back on Twitter). This conscious choice by the brand may seem innocuous. However, networks with lots of reciprocity are often more balanced, stable and harmonious (Prell, 2011). When dealing with marketing, WOM theory has also shown that relationships do matter in networks.
researchers contacted each of the current students. Each was asked how he or she had been referred to the teacher. If a student named a person as the referrer, that person was contacted. This process was repeated until the path was traced back to the teacher, or the path could not be traced further (e.g. the person was non-responsive). The networks were traced and a final list of 118 people was constructed. Next, a letter was mailed to each participant, each with a list all the other 117 actors in the network. The subjects were asked to look through the list and identify whom they knew and how well they knew them. Strong friendships, or strong ties, were more influential and most often traced the flow of referral. Close friends successfully referred close friends. Weak ties, however, seemed to bridge different subgroups of people.
differences influence the amount of eWOM generated. The research suggests that brands that seek more mutual ties with consumers will generate more eWOM.
RQ4a: Will the number of users a brand follows predict the number of shares (i.e. retweets) its messages receive?
RQ4b: Will the number of users a brand follows predict the number of favorites its messages receive?
Message Content and Virality
Guerini, Stapparava and Ozbal echo the fact that consumers have resistances to spreading information (2011). They suggest another reason for why content may catch on in a network of people. “Virality is a phenomenon strictly connected to the nature of the content being spread, rather than to the influencers who spread it” (p. 506). They suggest that analysis of influencers accounts for how content spreads, not why content spreads. This argument can be restated as: the probability of influencing people is controlled by the content. The nature in which the content spreads is a result of the network and its influentials.
There is tremendous variation in the WOM literature surveyed here. Even the term
Rosen makes the promising observation that products that evoke strong emotional reactions also have more WOM (2009). He provides examples of emotions: fear, surprise, excitement and delight. These emotions make consumers talk about products to their friends. He finds that these emotional reactions occur when a product exceeds a consumer’s expectations, or when a company has created a product so good that the consumer has an amazing experience. While helpful to develop a hypothesis that emotional content is talked about more, Rosen does not test it. This dissertation looks to provide solid ground on which such a claim might stand. It will test message characteristics that could possibly bolster diffusion (i.e. sharing) of messages across eWOM networks. Berger sums this thinking up best by saying,
“We all have friends who are better joke tellers than we are. Whenever they tell a joke, the room bursts out laughing. But jokes also vary. Some jokes are so funny that it doesn’t matter who tells them. Everyone laughs even if the person telling that joke isn’t all that funny. Contagious content is like that – so inherently viral that it spreads regardless of who is doing the talking. (Berger, 2012, p. 14)”
& Mayzlin, 2009). The question still remains, can brands and products reach out to consumers directly and generate eWOM effectively? RQ1 will test this question.
Yes, WOM can explain how messages from brands spread. As discussed, it can often too explain why. But these theories tend to ignore the properties of the messages that get passed on. Certainly, some messages are more likely to be spread than others. Shifting to the content of the message, there properties of a message that can be quantified and observed. Goel, Watts and Goldstein have shown that some of the most shared content on Twitter come from unsuspecting places (2013). The strongest networks do not always drive the most diffusion. On Twitter, messages are simple 140 character messages, supplemented with multimedia or a hyperlink to a story. Are there characteristics of the message that might increase the diffusion? The following is an introduction to scholarship that addresses the characteristics of textual messages, and how those characteristics influence the diffusion of these messages.
Emotion
Understanding how emotion is processed in the human brain helps us appreciate how deeply the human brain is affected by emotion. Human brains process emotion before facts (Zajonc, 1980). As counter-intuitive as that may sound, evidence shows that before the human brain can apply any sort of reasoning or interpretation to stimulus, it reacts with emotion. This means that when presented with an emotional advertisement, a human’s initial reaction has little to do with predispositions that person may have to that product (Wood, 2012). In fact, only after the emotional reaction can an individual begin to think rationally. There are obvious limitations to this finding. Not everyone cries at a funeral, and not everyone smiles at a baby. Outward expressions of emotion come after an internal emotional reaction, after the brain has time to apply reasoning and cognitive resistance. Still, scholars have provided evidence that the brain is wired with an emotional circuit that activates before the brain has time to cognitively process that information (Bagozzi, Gopinath & Nyer, 1999). After humans have time to think, a second emotional circuit is activated with cognition, and that process can correct or alter an initial emotional reaction (LeDoux, 1998). Have you ever seen someone start to laugh at a joke and then stop after finding it to be in bad taste? This is a good example of both emotional circuits working in opposition.
Emotions and Advertising
Moreover, newer scholarship has shown that emotional reactions can make advertising more effective (Wood, 2012).
But how specifically is an advertisement charged with emotion? Consumers are skeptical to any type of marketing content, such as advertisements and marketing material (Dichter, 1966). Consumers apply all types of cognitive resistances to advertisements (Rizvi, Sami & Gull, 2012). Emotion actually precedes these types of cognitive resistances. Consumers may very well be able to apply all types of reasoning to whatever informational content is inside of an advertisement. Emotional content, however, may be immune to skepticism.
In a test of this hypothesis, advertising scholars set out to see if skeptical consumers would react differently to informational and emotional advertising (Obermiller, Spangenberg & MacLachlan, 2005). Those that tested as highly skeptical to advertising tended to like, rely on and attend to informational advertising less when compared to the emotional counterparts
(Wood, 2012). It has been suggested by some scholars that the number of consumers skeptical of advertising has grown in the recent decades (Rizvi, Sami & Gull, 2012).
Additional evidence shows that in advertising, emotional reactions can be better predictors of effectiveness than commonly used evaluation metrics, such as surveys (Wood, 2012). Wood argues that measuring the gut reaction subjects have to advertisements is extremely important, and that measurement is currently missing in the way most major advertising
the advertising stimuli, thus measuring System 2 responses. The researchers measured facial reactions to advertisements. While maybe not precognitive, the researchers argued that initial facial reactions were closer to “System 1” in nature (Zajonc, 1980). The results showed that simple emotional response is more predictive of effective advertising than the widely used measures of persuasion, brand linkage and even message delivery.
Researchers have pinned emotional response as a key characteristic of successful advertising campaigns. The challenge, then, for advertisers has been to (1) monitor or evaluate the amount of emotion evoked from advertisements and (2) measure the effects (i.e. WOM, ad evaluation, attitude toward the ad, or even purchase behavior). The emotion itself that is the most effective persuader for advertising is very much up for debate.
There are several books and a rather large body of literature on emotion as it pertains to advertising and emotion (Agres, Edell & Bubitsky, 1990; Heath, 2012). The body of
psychological studies on emotion goes even deeper, and encompasses entire journals, such as
The Journal of Emotion. These experiments are usually conducted in controlled settings where participants are subjected to advertisements and their results are recorded. These studies focus on human reaction (Bagozzi, Gopinath & Nyer, 1999). This dissertation focuses on the message characteristics of micro-blogging messages. The content is the key variable, not participant responses. There is little doubt that the aforementioned studies have proven to be extremely helpful. For practitioners, it is important to look at what emotions yield positive results, and to copy test advertisements in order to get the strongest emotional response. This dissertation will study the same phenomenon in reverse. The following studies have taken this approach and measured emotional content of advertisements using empirical methods.
Emotion as a Measured Characteristic of Text
Textual characteristics need to be agreed upon, and have concrete definitions for how and when they exist in order to be part of a valid content analysis (Riffe, Lacy & Fico, 2005). When dealing with emotion and content analysis of characteristics, the body of work on emotion is much narrower. Digging deeper to textual characteristics, three key areas exist: specific emotions, sentiment and arousal. For this dissertation, I have chosen to focus on the latter two, given the lack of empirical research on specific emotions. Little is known about how specific emotions are manifested in text and the subsequent behaviors those emotions evoke when they exist. The effects of arousal, sentiment and text are better understood. Alternatively, by
Perhaps the most common way that emotion has been measured in content analysis is in terms of sentiment valence. Most commonly measured in scales ranging from positive to negative, sentiment is usually a measurement of how positive or negative a combination of words is, expressed through words with associated sentiment scores (Barrett & Russell, 1998). Studies from several disciplines have concluded different things in terms of sentiment and what it tells us about how consumers will interact with content.
Berger and Milkman looked at sentiment valence and the virality of news stories on the New York Times website (2011). They found stories with positive sentiment tended to be shared more than negative ones. Hansen et al. (2012) challenged Berger and Milkman’s results and hypothesized that news content was more likely to be retweeted on Twitter if negative. For non-news tweets, they relied on the self-enhancement literature, which suggests that people share positive information about themselves. They found that, for news stories, negative sentiment predicted the amount a tweet was rebroadcasted, while for non-news content, positive sentiment drove the diffusion.
By adding the dimension of “generation,” Angelis et al. (2012) arrive at a similar
conclusion. They posited that people are more likely to generate positive stories that contain their personal experiences. However, those same people are likely to gossip about others’ negative experiences. Again, an explanation is found in self-enhancement theory, which suggests that people engage in public behaviors that project them in a positive image.
are willing to pass along bad news, even when it is exaggeratedly bad (1996). Conversely, people are inclined to transmit exaggeratedly good news in emotionally positive domains.
When content takes the form of a folk story or urban legend, the more negative the story, the greater chance that story will be passed on (Donavan, Mowen, and Chakraborty, 1999). Researchers manipulated a fictional urban legend regarding a kangaroo wearing a Gucci jacket. They found that when the overall sentiment for the story was negative, subjects were more likely to pass on the story to their friends than when compared to a positive manipulation of the same story.
Similarly, Kamins, Folkes and Perner (1997) tested whether consumers were more likely to spread rumors with positive as opposed to negative outcomes. While consumers self-reported that they would be more likely to spread negative rumors, a field test found this to be only partially true. Personal relevance was a mediator to whether a consumer would pass on negative information. Consumers tended to share positive personal stories but not negative ones. If the subject of the rumor was perceived to be about a rival, negative stories were more likely to be spread. When rumors were about people with no connection to the consumer, neither positive nor negative stories were more likely to be shared.
This finding is echoed by Dang-Xuan et al. (2013) who looked at messages broadcast by influential Twitter users in the parliamentary elections in Germany. The higher the level of emotion, in either a positive or negative direction, the more often content was retweeted. While it is likely that the actual Twitter users who rebroadcast the messages had connections to the
The general consensus of the literature surveyed here suggests that emotionally charged messages tend to be more viral. Both in positive and negative valence, sentiment seems to evoke interest.
RQ5a: Will brand messages with positive valence be shared (i.e. retweeted) more than messages with neutral or negative sentiment?
RQ5b: Will brand messages with positive valence be favorited more than messages with neutral or negative sentiment?
Emotion as a Measured Characteristic of Text: Arousal
The theory of arousal stems from Berlyne’s research in 1960. He defined arousal as how “wide awake” and “ready to react” someone was. He found that while extreme levels of arousal discouraged learning, moderate to high levels fostered learning. Other scholars have broadened arousal to mean how stimulated, or excited, one is (Health, 2012).
Kroeber-Riel (1979) expanded Berlyne’s research and further tested arousal. In what he calls “phasic activation,” he finds that people can be activated by advertising copy and
illustration. His research demonstrates that arousal occurs first in the reticular activation system of the brain, which is located near the stem. From there, it travels and awakens many other cortical units, readying them for action. These cortical units are capable of behaviors like information processing. By activating them, the likelihood that a behavior will occur increases. Kroeber-Riel refutes Berlyne’s assertion that too much activation can thwart information
processing by differentiating two types of activation: tonic activation, a longer lasting effect, and phasic activation, a temporal effect. He finds that a high degree of tonic activation can indeed result in cognitive decline. However, he provides evidence that advertisements do not provide tonic activation. Instead, his research shows that advertisements, given their temporal nature, are more likely to arouse in the phasic sense. Kroeber-Riel posits that, for advertising, the higher the amount of phasic activation, the higher amount of information processing. His research
supported this hypothesis in an experimental setting. Higher activation levels led to higher recall values. He concludes, “Advertisements that fail to arouse will have no effect, as the information conveyed by the advertisement will not be processed efficiently” (p. 546).
to tap emotions that are common across individuals. In a series of experiments, they compared their emotional selection hypothesis with an informational selection hypothesis. The premise was that people would be more likely to pass along information that was plausible, useful and
practical. Their alternative hypothesis predicted that people would value stories that produced favorable emotional reactions. According to this entertainment hypothesis, stories would succeed when they were able to evoke a strong emotion because these stories were better crafted and more entertaining. The authors found evidence of their emotional selection hypothesis and demonstrated that people were more willing to pass along memes with higher levels of emotion; however, their research was limited to the emotion of disgust and did not explore why emotional selection occurs.
The interaction of emotion and arousal can yield powerful effects. For fear-laden
advertisements, Agres, Edell, and Bubitsky (1990) found that the greater the amount of arousal, the more intense the response is for that advertisement. Arousal was the second most influential factor on attitude toward the ad, brand attitude and behavioral intent.
Gorn, Pham, and Sin manipulated the moods of participants and then showed them either positive or negative advertisements (2012). When ads were ambiguous in tone, the manipulated mood colored judgments of advertisements that were not particularly positive or negative. When ads had a positive or negative tone, those tones largely prevailed. In a second study, mood and arousal levels were manipulated separately. In the arousal condition, the valence of
Similarly, Sanbonmatsu and Kardes show that arousal can mediate the amount of persuasion yielded from advertisements (1988). In manipulating arousal by having people exercise, those who were in arousing (i.e. activated, awake) states were more likely to find advertising to be persuasive.
Berger and Milkman (2011) demonstrated that news stories evoke different levels of arousal. That arousal can be a predictor of the number of times a news story is shared (Berger, 2011). The researchers suspected that highly arousing emotions of both positive and negative valence would drive the propensity in which New York Times articles would be shared. The researchers looked at arousing emotions: awe, anger and anxiety. These emotions were compared to sadness, a deactivating emotion. Control variables were used for how featured, practical, interesting and surprising the content was. The most dominating factor in the regression analysis was whether the content included at least one arousing emotion. The researchers recreated these findings via a laboratory experiment, where arousal levels were induced by asking participants in the activation group to exercise. Participants who were activated were willing to share stories with friends more than participants who were not activated. Similarly, Peters, Kashima and Clark used survey responses to show that students were more likely to share social anecdotes about other students that contained interest, surprise, disgust and happiness (2009). Anecdotes that did not contain arousing emotions garnered little interest from the students, and they were not likely to pass them on to others. This study lacked control variables for the content. Possible mediating variables, such as how funny or interesting the students found the anecdotes to be, were not investigated.
several studies that suggest arousal motivates behavior. Arousal appears to evoke stronger responses to advertisements (Gorn, Pham & Sin, 2012; Agres, Edell & Bubitsky, 1990; Kroeber-Riel, 1979). It also makes people more likely to share memes and recommend content to people (Berger & Milkman, 2011; Peters, Kashima & Clark, 2009; Heath, Bell, Sternberg, 2001). These studies suggest that positive arousal will boost the likelihood that brand messages will be shared more on Twitter.
RQ6a: Will brand messages with positive arousal be shared (i.e. retweeted) more than messages with neutral or negative sentiment?
RQ6b: Will brand messages with positive arousal be favorited more than messages with neutral or negative sentiment?
Defining Concreteness
Percy’s focus appears to be on nouns. Heath and Heath similarly define concrete information as the degree in which a sensorial experience is evoked (2007). Other scholars support this view (Macklin, Bruvold & Shea, 1985; Rioux, Regan & Schmitt, 1990; Percy, 1982). Heath and Heath open the possibility to adjectives by providing the example of “V8” as a concrete term and “high-performance” as abstract. Both appear to be adjectives of the word “engine.” Vague and ambiguous terms are abstract. For instance “big data” is abstract and “Hadoop” is concrete. Heath and Heath suggest that the inclusion of “buzz words” or grandiose words can make a piece of text more abstract (2007).
Many alternative definitions exist for concrete and abstract. Imaging ability, or how many images a word can bring to mind, is an early definition of concrete (Lambert, 1955; Paivio, 1963; Sadoski, Goetz & Fritz, 1993; Rossiter & Percy, 1978). Consider the difference in the terms “food” and “steak dinner.” While both could describe the same thing, steak dinner may evoke more visual imagery. A third definition approximates to how explicit a message is explained (Dickson, 1982; Krishnan, Biswas & Netemeyer, 2006). In this case, abstractness means
ambiguity. The advertising slogan “sale today” would be abstract, in which “20% off today only” is concrete. Regardless of definition, the concreteness has been conceived as an inherit
characteristic of any given piece of text. The abstractness and concreteness measurements have usually been measured on a scale ranging from one (very abstract) to seven (very concrete).
The measurement of concreteness did differ in the seminal article. Lambert had participants recall as many words out loud as they could for a given word (1955). Here, he noticed that concrete nouns elicited more responses. The stimuli were assembled from the most frequently used English and French words. All of the words had no apparent “emotional
the word was “touchable” or “manipulable.” English concrete nouns included words “garden,” “house,” “food” and “child,” whereas abstract words included “peace,” “honor,” “thought” and “idea.” Across both languages, concrete words produced more associations.
This finding, while basic and perhaps incomplete in methodological rigor, sparked the interest of other psychologists. They tested more effects that concrete words might have on participants. Paivio investigated adjective-noun word pairings and the effect on learning (1963). His hypothesis was that nouns act as “conceptual pegs” on which adjectives can be hung. He argued that conceptual pegs provide “codes of learning.” Given Lambert’s findings on
associations and concreteness, he surmised that the best codes would be those that have the most associations, and therefore, would be the most concrete. The more associations a word had, the easier it would be to remember. Paivio paired adjectives with concrete nouns. Abstract nouns were left in isolation. The concrete nouns referred to “specific things or events” while abstract nouns were “more general” (e.g. technical-advertisement vs. discourse). Higher levels of recall were observed for the adjective concrete pairings when compared to the abstract nouns. In 1965, Paivio replicated the study using concrete and abstract nouns with no adjectives (e.g. coffee and soul). Again, concrete words had greater recall. He found that concrete nouns evoked higher amounts of imagery, were more meaningful and were more familiar than abstract nouns. Several studies have gone on to show that concrete words are more positively associated with
comprehension (Begg and Paivio, 1969; Paivio, 1971; Sheehan, 1970).
phrases that evoked “mental imagery.” Wharton asked participants to identify phrases that evoked, “clearer, stronger, pictures” in their minds. When reading the concrete phrases in textbook passages, college freshmen scored significantly higher on comprehension. He also found that 24 percent more of the students considered the concrete treatments interesting.
In another study that used historical narratives, Sadoski et al. investigated the effects of concreteness on familiarity, comprehensibility, interestingness and recall (1993a). The narratives were paragraphs drawn from textbooks and historical articles that dealt with historical figures. Concrete text was more interesting and more comprehensible than abstract text.
In an extended analysis of the sentence data from the previous study, Sadoski et al. constructed a path model to test the causal assumptions regarding the effects of concreteness on interestingness (1993b). Concreteness had strong effects on interestingness. Sadoski used schema theory to explain the results, which asserts that high interest material is better understood. The assumption here is that concrete words are generally more familiar to readers, and this familiarity creates a more elaborate schema with which to identify. Given the well-proven link between concrete language, comprehension and familiarity, he posits that concreteness also bolsters interestingness.
between concrete language and mental imagery evoked interest and affective engagement. The researchers note that it is “this link that makes the content seem to come to life” (p. 87).
Concreteness and Advertising
Advertising and marketing disciplines alike have also addressed abstractness and concreteness as defined by dual-coding theory. Here the general premise across the literature is that concreteness is a property of an advertising message that can bolster attitudes and
persuasion. Interestingly, the hypothesized influence of concreteness is positive, and scholars have not identified situations where abstractness may be more influential. Unlike the Elaboration Likelihood Model where specific scenarios are illustrated given when to use either peripheral or central cues, concreteness is always assumed to be superior to abstractness (Petty, Cacioppo & Schumann, 1983)).
Several definitions of concreteness exist in the advertising domain. The definitions, while not at complete odds with each other, do vary. Rossiter and Percy put forth the hypothesis: the more images an advertisement evoked in a subject, the greater the consumer response (1978). In what they called “visual imaging ability,” advertising copy was manipulated to be “superlative and explicit.” The authors chose a household consumer product, beer. They then altered advertisements. Advertising copy for one concrete condition read, “winner of 5 out of 5 taste tests in the U.S. against all major American beers and leading imports.” Whereas an abstract condition read, “Bavaria’s finest beer.” The concrete treatment generated almost twice the favorable attitude toward the new brand of beer.
influential. The inspiration of the investigation came from the abundance of public health and safety initiatives that used statistics in campaigns (e.g. quitting smoking, inoculating children, reducing highway driving speeds and conserving energy). Other scholars have shown that these campaigns used “abstract statistical information” and were also very ineffective (Nisbett et al., 1976). Generic statistics were compared to concrete statistics, which provided “anecdotal information that describes a particular event or object in detail” (p. 398). This type of
information was dubbed “concrete case-history product information.” Conditions were created in which very basic written arguments were incorporated into advertisements using statistics. In comparison, more detailed arguments were created that described a specific event in great detail. Participants scored better on recall for the concrete conditions. Additionally, participants
identified the concrete advertisements as more vivid in their memories.
In yet another divergent definition, when focusing on advertising cues that dealt with the price of products, Krishnan, Biswas and Netemeyer found that the concreteness of the price cue mediated the effectiveness of the advertisement (2006). Short text claims, such as “A $100 value” were not as effective as “Last Week $200, Now $100.” The authors argued by adding context to the price, the cues were made concrete. The researchers define concreteness as “the degree of detail and specificity about the price comparison being made” (p. 95). Concrete price cues were more effective than the abstract versions. A similar view of concreteness was adopted by Feldman, Bearden and Hardesty when they defined concreteness as the “degree of detail and specificity about objects, actions, outcomes and situational context” (p. 124, 2006). The
Macklin, Brovold and Shea equate concrete advertisements to ones that thoroughly describe the features and benefits of a product or service (1985). They concede that this is easier to do for a product that has many features to describe, such as a computer or a camera. They adopt the “availability-valence” hypothesis. In this scenario, increased amounts of cognitive elaboration boost persuasion. Cognitive elaboration is activated when messaging is concretely structured. When consumers cognitively elaborate, multiple related pathways are engaged. The concept “associative pathways” implies that a particular concept, when concretely elaborated, is connected to many other pathways in the human brain. Those pathways can be stimulated simultaneously. When these pathways are stimulated, a person can access information with less effort. This can ultimately lead to increased persuasion.
Ci’s doctoral dissertation offers perhaps the most exhaustive study of abstractness and concreteness on advertising copy (2008). He adopts a second definition of the abstractness-concreteness continuum as it pertains to advertising copy: generality vs. specificity. Here, unlike the seminal articles that defined concreteness as the extent to which visual imagery was evoked (e.g. Lambert, 1955), a noun is considered concrete when it refers to a specific concept. A noun is abstract if it has sub-concepts below it. The more sub-categories an object includes, the more abstract the object becomes. Consider the Ferrari 330 GTC. It is likely that the reader will picture a slick sports car. Alternatively, the term sports car has many sub-categories and is, in turn, more abstract. In Ci’s view, specific concepts with no sub-concepts are concrete, while general
From Concreteness to Interest to Virality
The research surveyed here on concreteness and abstractness spans from education to advertising. Even inside of the advertising discipline, a wide range of effects have been studied and observed, from attitudes to purchase intentions (e.g. Dickson 1982; Fernandez and Rosen 2000; MacKenzie 1986; Percy 1982). Concreteness appears to have even more effects.
In perhaps the most in-depth analysis of concrete text, Rubin attempted to dissect the reasons why oral traditions (i.e. stories, epics, songs and poems) were remembered and then passed on to others (1995). The oral traditions, while all spoken by nature, involved very specific, detailed bits of information that have been successfully passed down thousands of generations. Stories included rhymes such as Eenie Meenie. Rubin outlined constraints of the traditions that allowed the rhyme to be transmitted almost flawlessly. Taking psychological understandings of how the brain functions and theories regarding how memories are created and recalled, Rubin attempts to explain why some stories get shared more than others. He identifies three characteristics of stories that control how they are remembered and recalled: sound patterns, meaning or story structure and imagery.
less scrutiny and are usually more persuasive and attitude changing as a result. All of these effects could be linked to increased virality and are ripe for investigation.
Rubin, in his study of oral traditions, does identify concrete material as more likely to be passed on, but he does so indirectly by mentioning concreteness in the context of a successful oral tradition. No formal experiment was conducted to test the linkage of the two concepts.
Heath and Heath posit that information that is concrete is easier to understand (2007). This assertion is widely supported by education literature (Wharton, 1980; Sadoski, 1993a; Sadoski, 1993b). Using a term borrowed from Gladwell’s The Tipping Point, Heath and Heath argue that, because abstraction makes an idea harder to comprehend, “sticky” ideas are usually concrete. Indeed, Rubin’s investigation shows that concrete ideas are more memorable (1995). Rubin shows how oral traditions travel from person to person and generation to generation, and argues that concrete elements are more likely to survive transmission because they are easier to understand and remember.
But even if concrete ideas tend to “stick” in the environment more than abstract ones, little discussion has been generated about the sharing of concrete information. After all, this dissertation is dedicated to the virality of brand messages. Sure, more memorable tweets may be the ones that are shared the most, but the link is not explicit. Memorability and recall aside, the increased interest that concrete messages generate may empirically link concrete messages to viral messages and test the assumptions of Rubin (1995).
Mechanical Turk) agreed were interesting were found inside of tweets that were shared more often. Moreover, several variables failed to explain how viral content became. In particular, the positivity of the sentiment associated with the content did not predict virality. Turkers were also asked how likely they would be to recommend the content they read to friends, imagining if they had encountered the content on their own Twitter feed. Interestingly, Turkers did not accurately predict actual shares.
It has been shown that concrete information is more interesting than abstract information (Wharton, 1980; Sadoski, 1993a; Sadoski, 1993b; Goetz & Rodriguez, 2000). Interest has also been thought of as a state of arousal (see the previously discussed in the arousal section of this paper) (Peters, Kashima & Clark, 2009). This effect can actually result in immediate behavioral change. Interest is a positively arousing emotion that can cause excitement (Berger, 2012). It is because of this arousing state that several scholars have linked interesting content to more viral content. Berger and Iyengar (2012) and Berger and Schwartz (2011) argue that if a message or product is interesting, it will have more online WOM. For a full review of the arousal literature, see the arousal chapter of this dissertation.
Instead, through their observation, they have noticed that these conversations tend to be rather similar (e.g. regarding the weather or a sporting event that occurred for a local team). Berger noticed that while it is entirely possible to have these everyday exchanges via publicly facing social media services, like Twitter, they largely don’t occur. While it has been noted that people do tend to share everyday activities, they rarely do so and expect others to respond directly to those messages as if having an everyday conversation. Instead, when engaging with others via public social media services, there is an inherit expectation for those conversations to be interesting. In comparison to off-the-cuff conversations, people expect these messages to be worthy of sharing and worthy of being seen by others. Berger and Milkman’s have provided some early work that supports this notion for online conversations (2011).
Furthermore, interestingness and curiosity have been linked together, often with interest as a dependent measure of curiosity (Loewenstein, 1994). Especially in tweet form,
microblogging content is terse. Assuming that people are at least somewhat curious when
browsing through their Twitter feeds, it is entirely possible that curiosity may explain the drive to seek interesting information. Knowing that people seek out interesting information can further explain its popularity and intrigue, as others may be curious in the same way.
For these reasons, this dissertation will ask: if concrete text tends to be more interesting, and more interesting information tends to be shared and sought after online, will concrete information be shared more?
RQ7b: Will concrete brand messages be shared (i.e. favorited) more than abstractly worded messages?
Other Characteristics of a Social Media Message
Departing from psychology and advertising disciplines, computer science scholars have given the most focused attention to the virality of social media messages. These studies
investigate more explicit characteristics of messages that exist on social networking services. The aim for these studies is prediction. A typical computer science question in this area of literature is: Given a set of properties for a message on a social networking service, what combination might explain how popular a message gets? Unlike the psychological concepts examined earlier (e.g. concreteness and emotion), these features are more quantitative in nature and are usually byproducts of the message itself (e.g. does a tweet contain a URL or the number of people who commented on a tweet). These properties are also called “metadata.” Computer scientists have studied the metadata of messages on various social networking and social media services with the hopes of establishing predictive models. The majority of these studies gather data from services where data access is easily accessible. The literature is not exhaustive across all social networking services due the issues with data collection that exist on some services, such as Facebook (Vargo, 2013b).
story generated (Jamali & Rangwala, 2009). The researchers created a predictive model and were able to, in some cases, predict the popularity of Digg posts using the number of positively
valenced comments a given post received. Dubbed as buzz and appreciation variables, this finding is echoed by Guerini, Strapparava and Ozbal (2011). On Twitter, this is most similar to favoriting a tweet. Therefore, it could be that the more favorites a given tweet receives, the more retweets it may obtain.
RQ8: Will the number of favorites a brand message receives predict the number of times it is shared (i.e. retweeted)?
In perhaps the most exhaustive analysis of metadata that is readily retrievable via the Twitter API, Suh et al. looked at the metadata associated with tweets and whether any of those variables could predict the number of times a tweet would be retweeted (2010). Dependent variables included the number of URLs and the number of hashtags. To build a predictive model, first a random set of 10,000 tweets was selected. Interestingly, of these tweets only 219 had been retweeted more than 20 times, suggesting that the overall number of tweets retweeted many times was quite low. Then the researchers continued with an extremely large set of 74 million tweets to test the model. URLs and hashtags had strong positive relationships with the likelihood a tweet would be rebroadcasted.
RQ9b: Will brand messages with URLs be favorited more than messages without a URL?
RQ10a: Will brand messages with hashtags be shared (i.e. retweeted) more than messages without a hashtag?
RQ10b: Will brand messages with hashtags be shared favorited more than messages without a hashtag?
At the time of this dissertation, 300 million users are active on Google+ (Gundotra, 2013). The site acts as a social layer for Google services and allows users to share content with other registered users. While it does not limit the size of posts like Twitter, it is still considered a service in which friends share short messages. Researchers have shown that a post is three times as likely to have a high number of shares if that post has an image (Guerini, Staiano, &
RQ11a: Will brand messages with an image be shared (i.e. retweeted) more than messages without an image?
RQ11b: Will brand messages with an image be favorited more than messages without an image?
Summary of Literature Review
This dissertation has summarized large bodies of work from several different disciplines: psychology, marketing, computer science, communication, education and sociology. Each field contributes a piece to the immensely large puzzle that is virality. This dissertation chose to sum up the characteristics of messages that enhance diffusion. There are many other theories that might further explain the motivations that people have in sharing content with each other. Moreover, the understanding of the content that is being shared across these social networks appears to be in its infancy. Still, this dissertation has exposed several large areas of social science that have not explicitly been tested with social networking services such as Twitter. This is especially true when it comes to brand messages. The entire bulk of advertising literature discussed here deals with traditional advertisements as stimuli. While a small amount of research shows brands can generate WOM, no studies were found to show that process as it originates from brand messages online, nevertheless how brand messages are spread on Twitter.
dream. It is also very telling of what kinds of content society values. These opportunities to test existing social science theory alongside the potential rewards that lie in solving even a tiny piece of this gigantic puzzle warrant this investigation.
RQ12a: To what extent can the independent variables identified in this study be used to predict the number of retweets for brand messages on Twitter?