Dragana Cvijanović, Amil Dasgupta and Konstantinos E.
Zachariadis
Ties that bind: how business connections
affect mutual fund activism
Article (Accepted version)
(Refereed)
Original citation:
Cvijanović, Dragana, Dasgupta, Amil and Zachariadis, Konstantinos (2016) Ties that bind: how business connections affect mutual fund activism. The Journal of Finance, 71 (6). pp. 2933-2966. ISSN 0022-1082
DOI: http://dx.doi.org/10.1111/jofi.12425
© 2016 American Finance Association
This version available at: http://eprints.lse.ac.uk/65929/
Available in LSE Research Online: April 2016
LSE has developed LSE Research Online so that users may access research output of the School. Copyright © and Moral Rights for the papers on this site are retained by the individual authors and/or other copyright owners. Users may download and/or print one copy of any article(s) in LSE Research Online to facilitate their private study or for non-commercial research. You may not engage in further distribution of the material or use it for any profit-making activities or any commercial gain. You may freely distribute the URL (http://eprints.lse.ac.uk) of the LSE Research Online website.
Ties that Bind:
How Business Connections A
↵
ect
Mutual Fund Activism
DRAGANA CVIJANOVI ´
C, AMIL DASGUPTA, and
KONSTANTINOS E. ZACHARIADIS
⇤Journal of Finance
forthcoming
ABSTRACTWe investigate whether business ties with portfolio firms influence mutual funds’ proxy
voting using a comprehensive data set spanning 2003 to 2011. In contrast to prior
lit-erature, we find that business ties significantly influence pro-management voting at
the level of individual pairs of fund families and firms after controlling for ISS
recom-mendations and holdings. The association is significant only for shareholder-sponsored
proposals and stronger for those that pass or fail by relatively narrow margins. Our
findings are consistent with a demand-driven model of biased voting in which company
managers use existing business ties with funds to influence how they vote.
⇤Cvijanovi´c is at the Kenan-Flagler Business School, University of North Carolina at Chapel Hill.
Das-gupta is at the London School of Economics and affiliated with the CEPR and ECGI. Zachariadis is at the London School of Economics. We are grateful to the Editor, Kenneth Singleton, and two anonymous refer-ees for insightful input. We thank Miloˇs Boˇzovi´c, Vicente Cu˜nat, Daniel Ferreira, Nick Gantchev, Christian Julliard, Dong Lou, Gregor Matvos, Adair Morse, Abhiroop Mukherjee, Daniel Paravisini, Michael Roberts, Breno Schmidt, Geo↵Tate, Moqi Xu, Jonathan Zinman, and audiences at the Belgrade Young Economists Conference, LSE, NBER Summer Institute 2014 Law and Economics Workshop, NC State, University of Lugano, and Western Finance Association 2014 for helpful comments. Cvijanovi´c thanks the Rollie and Mary Windley Tillman Endowment Fund and the Wells Fargo Center for Corporate Finance at UNC Chapel Hill for financial support. Dasgupta and Zachariadis thank the Paul Woolley Centre and the Department of Finance at the LSE for financial support. Dasgupta thanks the Cambridge Endowment for Research in Finance and the Faculty of Economics at Cambridge University for their hospitality. We have read the
Mutual funds are of great importance to both retail investors and corporations. They are the main investment vehicle for retail investors, not least via their role in managing pension portfolios through 401(K) plans. They are also highly relevant to corporate governance as they collectively own 24% of U.S. corporate equity1 and large fund families hold blocks of
10% or more in dozens of large U.S. corporations (Davis and Yoo (2003)). Since the passage of shareholder proposals raises firm value (Cu˜nat, Gine, and Guadalupe (2012)), if mutual funds vote their proxies in a manner that enhances the value of portfolio firms,2 they would
not only play a beneficial role in corporate governance, but also enrich their vast base of retail clients. The proxy voting behavior of mutual funds is thus of considerable importance. However, mutual funds often have lucrative business relationships with portfolio firms arising from the management of the same 401(K) plans that enhance their importance to retail investors. On average, earnings from 401(K)-related business equal 14% of the revenues that mutual fund families earn from their equity funds, and such income can represent as much as 25% of fund family revenues (Davis and Kim (2007)). Since the choice of fiduciaries for 401(K) plans lies in the hands of firm executives who may be opposed to shareholder activism, there has been widespread suspicion that mutual funds may vote their proxies in a conflicted manner. For example, according to the SEC:3
“...in some situations the interests of a mutual fund’s shareholders may con-flict with those of its investment adviser with respect to proxy voting. This may occur, for example, when a fund’s adviser also manages... the retirement plan assets of a company whose securities are held by the fund. In these situations, a fund’s adviser may have an incentive to support management recommendations to further its business interests.”
Com-panies Act, which requires mutual funds to annually disclose their votes cast for proposals arising in portfolio companies. As a result, it is now possible to investigate the extent to which business ties with portfolio firms a↵ect mutual fund proxy voting. We examine this relationship over the 2003 to 2011 period.
We show that mutual funds’ voting is significantly influenced by their business ties with portfolio firms. Since we control for unobserved heterogeneity using a rich set of fixed ef-fects, our result holds for given pairs of fund families and firms, even at the level of individual proposals, and after controlling for Institutional Shareholder Services’ (ISS) recommenda-tions and holdings. Our finding stands in sharp contrast to prior literature (Davis and Kim (2007), Ashraf, Jayaraman, and Ryan (2012)) which finds that business ties with portfolio firms do not influence voting after controlling for fund family heterogeneity. We discuss the connection to these papers in greater detail below.
engagement between managers and shareholders (Gantchev (2013), McCahery, Sautner, and Starks (2016)). Managers receive information on the anticipated support for each proposal. If a proposal is formally introduced, they have the option to try to influence the voting of institutional blockholders. Managers are best able to influence those institutions with which they have ongoing business relationships, but exerting influence is costly because it requires e↵ort and credible threats of future punishment. Accordingly, managers exert influence only when doing so is worth paying this cost. The model predicts that managers influence voting more frequently for shareholder proposals than for management proposals, thus providing an explanation for the empirical finding above: the flexibility and control that managers have over self-sponsored proposals raises the bar for paying the cost of exerting influence.
Our model also sheds further light on the relationship between proxy voting and business ties. It predicts that managers are more likely to influence voting, ex ante, for shareholder proposals that pass or fail narrowly (i.e., that are contested), ex post. Since managers receive information on anticipated support, the fact that these proposals pass or fail narrowly ex post implies that managers can predict ex ante that these proposals are “in play.” It is for precisely these proposals that it is worth paying the cost of exerting influence. We empirically examine the incremental e↵ect of business ties on proxy voting on shareholder proposals that pass or fail by relatively narrow margins and find strong support for the model’s prediction. The e↵ect is also economically relevant: in our most saturated specification, we find that a shift from no business ties to some business ties leads to an increase in pro-management voting of over 12% for proposals that pass or fail by less than 20%.
the same may not be true for contested proposals. Further, the passage of a proposal is likely to enhance the market value of the firm on the day of the vote precisely when the proposal is contested, because in such cases the voting outcome may not be fully anticipated by the market (Core, Guay, and Rusticus (2006)). Thus, it is for contested proposals that the trade-o↵ between value enhancement and business ties is salient: by voting for the proposal, the fund-family may be instrumental in raising firm (and, in turn, portfolio) value but displease management and be exposed to a reduction in business ties. The fact that we find an incremental e↵ect of proposal contestedness on biased voting suggests that mutual fund families choose business ties over portfolio value when it matters.
within sponsor-provider relationships—in our view, both causal directions imply qualitatively similar negative economic consequences.
As noted above, our results stand in sharp contrast to prior literature. Davis and Kim (2007) use the first available year of data on mutual fund proxy votes (June 2003 to July 2004) and find that, for a given proposal, fund voting is not influenced by business ties although fund families with higher levels of business ties support management to a greater extent in all portfolio firms irrespective of business ties. Their analysis is restricted to six shareholder proposals, selected on the basis of the Bebchuk, Cohen, and Ferrell (2009) entrenchment index and the frequency of occurrence in their data set. In a recent study, Ashraf, Jayaraman, and Ryan (2012) use data on executive compensation proposals between January 2004 and June 2006 and confirm the findings of Davis and Kim (2007). In particular, they find that business ties do not influence voting at the level of individual proposals after controlling for fund family heterogeneity. The contrast between our conclusion and that of these earlier papers should be viewed in the context of several di↵erences. First, we work with a much larger data set, combining over a nine-year period four databases containing (i) the votes cast by each mutual fund on each proposal of each portfolio firm, (ii) voting outcomes, (iii) business relationships between firms and funds, and (iv) fund family holdings. Second, while prior literature focuses on particular proposals, we consider a wide swathe of proposals.4 Finally, the richness of our data set allows us to aggressively control for
unobserved heterogeneity using a variety of fixed e↵ects, which is not feasible in prior work due to data limitations.
company are more likely to support company-sponsored proposals. Other papers examining business ties and proxy voting include Cremers and Romano (2011), who consider the e↵ect of mandatory disclosure on mutual fund voting, and Rothberg and Lilien (2006). Our findings also complement papers that show how business ties a↵ect aspects of mutual fund behavior other than proxy voting. For instance, Cohen and Schmidt (2009) show that trustee fund families overweight holdings of sponsor firms and do not sell in response to negative shocks, while Duan, Hotchkiss, and Jiao (2011) argue that business ties provide information to mutual funds and influence their trading profits in related stocks. Our paper also bears a connection to Matvos and Ostrovsky (2010), who analyze strategic considerations in mutual fund voting abstracting from business ties. At the most general level, our paper relates to the role of blockholders in corporate governance (see Edmans (2013) for a survey) and the emerging literature on how the incentives of institutional blockholders a↵ect governance (e.g., Dasgupta and Piacentino (2015)).
The remainder of the paper is organized as follows. Section I describes the data and sample construction while Section II o↵ers a first look at business ties and voting. Section III presents a model that is the basis for further hypothesis development. Sections IV and V test the model’s main hypotheses. In Section VI we consider the possibility of management friendliness without business ties while Section VII discusses causality versus correlation. Section VIII concludes.
I.
Data
cast by mutual funds on all proposals for every Russell 3000 company from 2003 to 2011. Mutual funds are required to submit N-PX forms annually by August 31. The reported votes cover the period from July 1 of the previous year to June 30 of the current year. For each proposal, funds report the firm, the meeting date, a short description of the proposal (e.g., declassify the board of directors, reduce supermajority voting requirement, etc.), the sponsor of the proposal (management or shareholder), management’s recommendation, the ISS recommendation, and the fund’s vote. We supplement our voting data with ISS Voting Results, which includes the votes cast in favor, the shareholder base for the voting result, and the voting result for each proposal.
We hand-collect data on 401(k) retirement plans sponsored by publicly traded firms from Forms 5500 filed with the Department of Labor (DOL). These data provide us with detailed information on any business relationship between a firm and a fund pertaining to the firm’s pension plan (e.g., investment advisor, trustee, investment manager, etc). Any firm that sponsors an employee benefit plan that qualifies under ERISA Sections 104 or 4065 must file Form 5500 with the DOL. Benefits provided by a firm’s plan include pension and welfare benefits.5
Finally, we merge the mutual fund voting data from ISS Voting Analytics/Voting Results with the Form 5500 data and mutual fund family holdings data obtained from SEC Form 13F filings. Due to the lack of a unique common mutual fund (or family) identifier across the three databases, we merge the three data sets using a combination of a name-matching algorithm and proprietary fund family identifiers. In our final data set we aggregate votes at the fund family level and drop any individual fund level information, thus keeping only
contains 1,131,240 votes cast by individual funds which results in 171,473 aggregated votes cast by the 29 largest fund families that voted in 17,618 proposals at the shareholder meetings of 3,121 firms from 2003 to 2011. In Panel B, we can see that of the sample proposals, 79% are sponsored by management and the rest are sponsored by shareholders.6 Panel C
shows that the proportion of funds within the average family that vote with management’s recommendation on the average proposal in our sample is 77.12%. The corresponding median is 100% implying that most funds in a fund family vote in unison. Around 94% of our observations on the proportion of funds voting with management on a given proposal are either zero or a hundred.
Table I, Panel D reports compensation statistics. The DOL’s Form 5500 has several components. While all firms sponsoring ERISA-qualifying employee benefit plans file Form 5500 Schedule A, they also file Schedules C or D if their plans have 100 or more participants in which the service provider was paid from the plan’s assets and fees exceed $5,000. Schedule C reports both direct and indirect compensation, which are defined as plan service provider salary and fees, respectively. Schedule D reports plan assets under management. We define total compensation received by fund families for services rendered in relation to 401(k) plans as the sum of direct and indirect compensation and 0.5% of assets under management.7
thus derive from firm⇥family⇥year triples characterized by small or nonexistent business ties. Panel E of Table I reports that the average (median) dollar amount of fund family holdings in portfolio firms is $101.07 million ($11.5 million). In Panel F, we find that the average (median) fraction of equity fund revenue for fund families attributable to pensions-related
compensation is 13.94% (4.17%). Table
II here Table II summarizes the nature of business relationships between fund families and firms
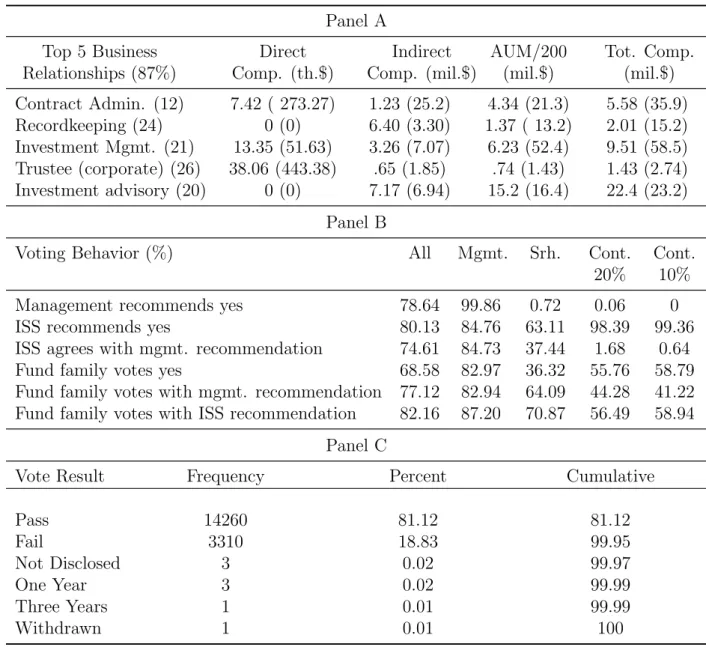
in Panel A, management and ISS recommendations as well as fund voting choices in Panel B, and voting results in Panel C. The five most common types of business relationship are contract administrator (average total compensation $5.58 million), record keeping ($2.01 million), investment management ($9.51 million), and trustee and investment advisory ($22.4 million).
Panel B shows that management recommends in favor of 78.64% of all proposals, 99.86% of management-sponsored proposals (“withholding” in the remaining 0.14%), and 0.72% of shareholder-sponsored proposals. ISS recommends in favor of 80.13% of all proposals, 84.76% of management proposals, and 63.11% of shareholder proposals. The ISS recommendation coincides with management’s in 74.61% of all proposals, 84.73% of management proposals, and 37.44% of shareholder proposals. Fund families vote with management’s recommenda-tion in 77.12% of all proposals, 82.94% of management proposals, and 64.09% of shareholder proposals, while they vote with the ISS recommendation in 82.16% of all proposals, 87.20% of management proposals, and 70.87% of shareholder proposals.
is also useful to attach two further descriptors to proposals.
First, each proposal can be described according to the nature of (ex ante) sponsorship or (ex post) support as belonging to some category. There are two categories by sponsorship: management proposals and shareholder proposals. In Section V and thereafter, we further refine the space of categories to include labels related to ex post support (contested or uncontested).
Second, each proposal can be characterized in terms of its function, which we refer to as the proposal’s type. The ISS provides a list of 257 proposal types by function (e.g., “Approve/Amend Executive Incentive Bonus (M0535)” or “Declassify the Board of Directors (S0201)”). We refer to the ISS functional classification for each proposal as its “Proposal Type ISS,” and label it in our formal analysis byzISS. Unlike proposals, which are indexed
by firm and time, proposal categories and types are not firm and time specific. To illustrate, consider the following example. Proposalp= 6471494 in the firm Hilton Hotels Corporation, which was voted on at a meeeting held on May 26, 2005 (i.e., t= 2005), has proposal type ISS zISS = S0212 (i.e., “Require a Majority Vote for the Election of Directors”) and, as a
II.
Business Ties and Proxy Voting: A First Look
We begin our empirical analysis as follows. For each fund familyf voting in a shareholder meeting of portfolio firm ion proposal pat time t, we estimate the following specification:
VoteswithManagementf,i,p,t= ↵+ 1BusinessTiesMeasuref,i,t+
+ 2LogHoldingsf,i,t+ 3ISSRecommendationi,p,t+
+ i⇥µf +
8 > > > > < > > > > :
·
⇡zISS
⇡p
| {z }
Fixed E↵ects Terms
+"f,i,p,t.
(1a) (1b) (1c)
Our main dependent variable is the proportion of mutual funds j belonging to fund family
f that voted in line with management’s recommendation on proposal p put forward at the date t shareholder meeting of the fund family’s portfolio firm i. This variable is defined as
VoteswithManagementf,i,p,t=
PJ
j=1 FundvotewithManagementj,f,i,p,t
J ⇥100,
where FundvotewithManagementj,f,i,p,t = 1 if fund j from family f votes in line with the management recommendation on proposal p at the shareholder meeting of portfolio firm i
at timet and J is the total number of funds per family f voting on that proposal.
Throughout our analysis we use two key measures of business ties. The first is LogTotal
one if total compensation is positive and zero otherwise.
We control for two potentially important e↵ects. Cohen and Schmidt (2009) establish that there is a positive correlation between the compensation received by mutual fund families and their stock holdings in portfolio firms. To control for the size of mutual fund family holdings in their portfolio firms and for the positive relationship between total compensation received and the size of fund family holdings, we include the (natural) logarithm of holdings in our regression,LogHoldingsf,i,t. Our other control,ISSRecommendationi,p,t, is a dummy variable
that takes the value of one if the voting recommendation of ISS is in favor of management. Matvos and Ostrovsky (2010) show that including the ISS recommendation may control for a potentially important part of a mutual fund’s information about the quality and type of the proposal being voted on.
The richness of our panel data allows us to control for unobserved heterogeneity along firm, fund family, and time dimensions using a variety of fixed e↵ects. All three of our specifications have firm⇥family ( i⇥µf) fixed e↵ects. Specification (1a) has no additional
fixed e↵ects, so that 1 measures the e↵ect of business ties for a given firm⇥family pair on
voting across all proposals. Specification (1b) adds Proposal Type ISS fixed e↵ects (⇡zISS),
so that 1 measures the e↵ect of business ties for a given firm⇥family pair on voting across
proposals of the same Proposal Type ISS (e.g., S0212).10 Specification (1c) instead adds
proposal fixed e↵ects, so that 1 measures the e↵ect of business ties for a given firm⇥family
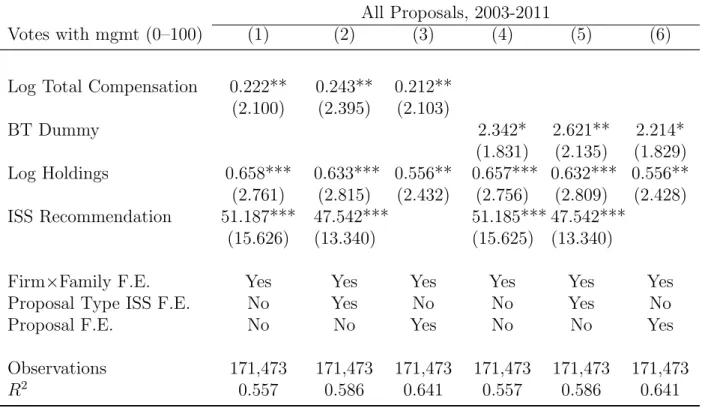
columns 3 and 6, produces a coefficient of 0.212 significant at the 5% level for the continuous measure of business ties and a coefficient of 2.214 significant at the 10% level for the discrete measure. Further, the coefficient onLogHoldingsf,i,tis positive and significant in each specifi-cation, suggesting a positive relationship between the size of fund family holdings and voting, that is due in part to the positive association between holdings and compensation (Cohen and Schmidt (2009)). As expected, the coefficient on ISSRecommendationi,p,t is positive and
significant as this is one of the main determinants of how fund families vote. However, our results show that business ties a↵ect voting above and beyond that recommendation.11
The results of Davis and Kim (2007) and Ashraf, Jayaraman, and Ryan (2012) suggest that, controlling for heterogeneity across fund families, mutual fund proxy voting does not
depend on business ties. This finding is in sharp contrast to our results since all our specifi-cations include—at a minimum—fund family fixed e↵ects. Hence, the issue is of a di↵erent nature than previously believed. To facilitate comparison, we replicate our analysis for the proposals used by Davis and Kim (2007) and Ashraf, Jayaraman, and Ryan (2012). This
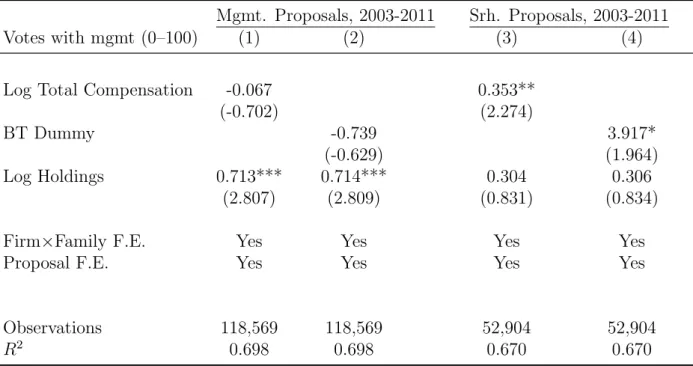
material can be found in Internet Appendix Section I.A. Table IV here Our results so far mask some significant heterogeneity. At the broadest level, proposals may be sponsored either by insiders (management) or by outsiders (shareholders), generating two mutually exclusive and exhaustive categories. When we split our analysis into these two categories, we find stark di↵erences between the two. The results are reported in Table IV. For shareholder proposals, in our most saturated specification, namely, Specification (1c), the coefficient for the continuous measure is 0.353 (significant at the 5% level) and that for the discrete measure is 3.917 (significant at the 10% level). The corresponding coefficients for management proposals are -0.067 ( insignificant) and -0.739 (insignificant).12 What drives
we develop a simple model to examine this question. We then use the model to develop hypotheses for further empirical investigation.13
While our dependent variable is not binary, its realized distribution is bimodal. Thus, for completeness, we reestimate the main specifications above using conditional logit models. This analysis is reported in Internet Appendix Table IA.II and demonstrates the robustness of our key findings.14
III.
Shareholder and Management Proposals: Theory
Proposals for corporate change may a↵ect the payo↵s of both management and share-holders. To focus on actions taken by management to influence voting, we index proposals by their incremental e↵ect on management payo↵s.15 In particular, we index proposals by
the variable v, which is distributed on [ V, V] via a continuous CDF H with associated pdf
h that (for simplicity) is symmetric around zero. Proposals may be sponsored by managers or shareholders. Management-sponsored proposals are characterized by v > 0. Motivated by standard agency models of corporate governance (e.g., Holmstrom and Tirole (1997)) we assume that shareholder-sponsored proposals are characterized by v <0.16
Once a proposal has been formulated, managers are able estimate its anticipated support among shareholders by canvassing them (Listokin (2008)). We model the anticipated support for a proposal by the random variable SA 2 [0,1], with CDF G and associated pdf g. The
variable SA is the proportion of voting shares, normalized by the required shareholder base
for that proposal, that are expected to support the proposal. Since this initial information is noisy, the realized support is given by SR = SA+✏, where ✏ is distributed on [ , ]
according to some symmetric unimodal densityf with f( ) =f( ) = 0.17 The parameter
>0 measures canvassing noise.18 We assume that < 1
inaccurate. We then have that, without loss of generality, any proposal is (i) a “sure thing,” that is, SA 12, (ii) a “lost cause,” that is, SA+ < 12, or (iii) “contestable,” that
is, SA < 12 SA+ . To avoid a plethora of qualitatively similar cases, we make the
following assumption.
Assumption 1: Contestable proposals are characterized by SA= 12.
Intuitively, Assumption 1 implies that managers treat all contestable proposals in the same way.19 While this simplifies our analysis, it does not change the qualitative results.
Once a formal proposal has been introduced, managers may exert influence on block-holders with whom they have business connections to vote in line with the management recommendation. Business connections foster familiarity and thus provide a basis for credi-ble communication between managers and institutional blockholders, enabling managers to meaningfully threaten to punish (or promise to reward) blockholders in the future. We there-fore model the emergence of pro-management voting as a management-driven process. In Sections VI and VII we present evidence consistent with this view. The exertion of influence changes the voting of blockholders with business ties in favor of the management recommen-dation and results in a change in the distribution of the realized support. Managers can influence for (⇢= 1) or against (⇢= 1), generating (transformed) realized support:
b
SR=SA+b✏,
where
8 > < > :
b✏ is distributed on [0, ] according to densityfb if ⇢= 1
b
✏ is distributed on [ ,0] according to density fb if ⇢= 1
,
shifts support in favor of management in a first-order stochastic dominance sense. Influence is costly for management because it requires e↵ort and credible threats of future punishment. The cost, kp(SA), may depend on anticipated support.20 We assume that kp(SA) > 0 for
all SA. Thus, kp 12 > 0 represents the cost of exerting influence on contestable proposals.
Finally, management loses face when a vote goes against its recommendation, in which case it su↵ers cost kd, some (unmodeled) reputational loss from defeat.
Management-sponsored proposals: For management proposals, we denote the noise pa-rameter by M. Managers have latitude on self-sponsored proposals. Upon learning SAthey
can decide whether to present or withdraw the proposal. Even if they choose to present the proposal, they can modify it such that it is more palatable to investors. Modification is costly, however, particularly for proposals that are highly opposed and lucrative to manage-ment (i.e., extract the highest rents). We assume that it is impossible to recast lost causes (which can never be made to “look good” to shareholders) and that the cost of recasting a contestable proposal into a sure thing is proportionate to the rents that management extracts via the proposal, that is, a contestable proposal with value v can be recast at cost mv for
m2(0,1/2) into a sure thing that pays managers (1 m)v.
Lemma1: Managers exert positive influence (⇢= 1) if and only if the proposal is contestable and v > kp(12)
m .
compensation proposals and thus of direct value to managers.
Shareholder sponsored proposals: We envisage a two-stage process in the formation of a shareholder proposal. In the first stage, a shareholder may propose some change. Managers can then accept and implement the shareholder’s suggestion (in which case a shareholder proposal is unnecessary) or reject it, in which case the shareholder brings the proposal for-ward. Thus the introduction of a shareholder proposal is usually a consequence of a failure of “behind the scenes” activism as documented by Karpo↵ (2001), Gantchev (2013), and McC-ahery, Sautner, and Starks (2016) among others. In our sample, management recommends in favor of only 0.72% of shareholder proposals (see Table II, Panel B). Given a shareholder pro-posal, managers obtain information on anticipated support. The noise in predicting support is given by S 2 ⇥ M,1
2 . It is natural to assume that support is (weakly) less predictable
for shareholder proposals than for management proposals.21 Further, unlike self-sponsored
proposals, managers do not have the option to withdraw or modify the proposal—their only choice is whether to exert influence to avoid defeat.
Lemma 2: Managers exert negative influence (⇢ = 1) if and only if the proposal is con-testable and v < 2kp(12) kd .
Exerting influence is only worthwhile for contestable proposals and then only if the cost to management of the proposal passing is high. Lemmas 1 and 2 jointly imply the following result.
Proposition 1: Managers choose to exert influence with higher probability for shareholder proposals than for management proposals.
influence is management’s only tool once a proposal is introduced. The bar for exerting influence is lower. Further, when support for shareholder proposals is less predictable than for management proposals ( S M), the former are more likely to be contestable than the
latter. These ingredients (withdrawal, modification, and relative predictability) are mutually reinforcing, butindividually sufficient for Proposition 1: even if management proposals were not modifiable, shareholder proposals could be withdrawn, or prediction errors were equal, the qualitative result would hold.
Under our management-driven model of influence, business ties influence the proxy vot-ing of blockholders with business ties only when management chooses to exert influence. Proposition 1 implies that the frequency with which blockholders with business ties vote pro-management is higher among shareholder proposals than among management proposals, ceteris paribus.22 The model therefore delivers the following hypothesis, which also provides
a foundation for our findings in Section II.
Hypothesis 1: The association between business ties and proxy voting should be stronger for shareholder proposals than for management proposals.
While our initial findings in Section II are consistent with this hypothesis, we provide a more robust and direct examination of this hypothesis in Section IV.
Hypothesis 2: The association between business ties on proxy voting should be strongest for shareholder proposals that pass or fail by relatively small margins.
In Section V, we extend the methodology of Section IV to examine this hypothesis.23
IV.
Shareholder and Management Proposals:
Empirics
To test Hypothesis 1 directly, we use di↵erence-in-di↵erence (d-i-d) specifications:
VoteswithManagementf,i,p,t= ↵+ 1BusinessTiesMeasuref,i,t+ 2LogHoldingsf,i,t+
+ 3BusinessTiesMeasuref,i,t⇥Shareholderi,p,t+
+ 4Shareholderi,p,t+ 5ISSRecommendationi,p,t+
+ i⇥µf ⇥ t+
8 > > > > < > > > > :
·
⇡zISS
⇡p
| {z }
Fixed E↵ects Terms
+"f,i,p,t.
(2a) (2b) (2c)
Our main independent variable is now the interaction between our business ties measures and the dummy variableShareholderi,p,t, which is equal to one if proposalpat firmiat time
t is sponsored by a shareholder and zero if it is sponsored by management. The estimate of
3 provides us with the di↵erential e↵ect of business ties on voting between shareholder and
us to focus directly on voting in a given firm⇥family pair in a given year. This is not feasible in our original model (specifications (1a) to (1c)) because our explanatory variables there (BusinessTiesMeasuref,i,t) are defined within the firm⇥family⇥year space.24 We use the
same proposal fixed e↵ects as in Section II. The interpretation of the 3s in (2a) to (2c)
is therefore similar to the 1s in (1a) to (1c) except that we now compare across proposal
categories. For example, in specification (2c), 3 measures the di↵erence in the e↵ect of
business ties between shareholder and management proposals for a given firm⇥family⇥year triple (e.g., Vanguard with holdings in Hilton Hotels Corporation in 2005) on voting over a
particular proposal (e.g., 6471494). Table V here The results are reported in Table V. The estimate of 3 is positive and significant at the
1% level across all specifications and for both measures of business ties, providing robust evidence in favor of Hypothesis 1. The coefficient onBusinessTiesMeasuref,i,tis dropped due
to collinearity with our firm⇥family⇥year fixed e↵ects and hence is not reported. The coef-ficient on LogHoldingsf,i,t is also insignificant, due to the fact that LogHoldingsf,i,t is highly
collinear with our fixed e↵ects.25 Again, the coefficient on ISSRecommendation is positive
V.
Contested Shareholder Proposals
To test Hypothesis 2, we first identify proposals that pass or fail by small margins. The ISS Voting Results database provides us with the votes cast in favor of shareholder proposals and the corresponding shareholder base for determining the outcome (e.g., shares outstanding, votes cast, votes cast minus absentees). Using this information, we calculate at the individual proposal level whether the votes in favor of that proposal were within 50±x% of the corresponding base, forx={10,20}.27 If this is the case we call the proposal contested
at the x% level, e↵ectively augmenting our set of proposal categories by two new entries, which we refer to as “contested 10%” and “contested 20%.”
Prior literature has analysed contested 10% proposals (Listokin (2008)) as well as con-tested 5% and concon-tested 2% proposals (Cu˜nat, Gine, and Guadalupe (2012)). Our con-testedness levels overlap with this literature, but also broaden them. Tight bandwidths of contestedness are essential for Cu˜nat, Gine, and Guadalupe (2012) given their regression discontinuity approach. Our focus is di↵erent: to test Hypothesis 2, we only need to identify proposals that may appear contestable ex ante to management and thus on which managers may exert e↵ort to influence institutional shareholders. The relevant set of ex post contested proposals therefore relies on the size of the prediction noise parameters M, S . If one or
both of these is not too small, somewhat higher bandwidths are justified.
fund families are ambivalent (44.28% for contested 20% and 41.22% for contested 10%). Not reported in the table is that the failure rate is 71% for contested 20% proposals and 66% for
contested 10% proposals. Tables
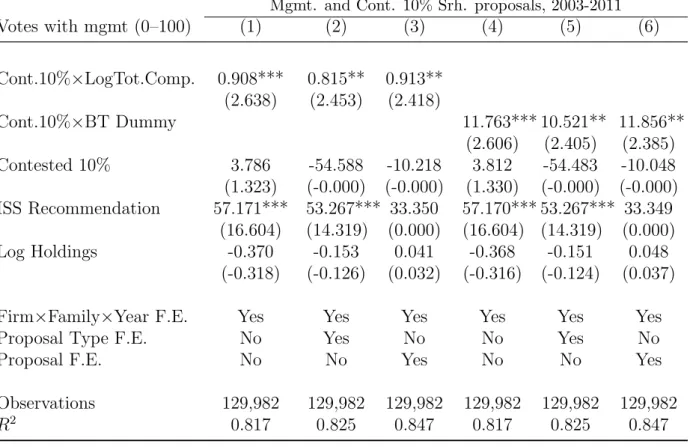
VI– VII here Using the methodology of Section IV, we test Hypothesis 2 via an approach similar to that in (2a) to (2c) in which our main dependent variable is now the interaction between our measure of business ties and a dummy variable that is equal to one if proposalp at firm
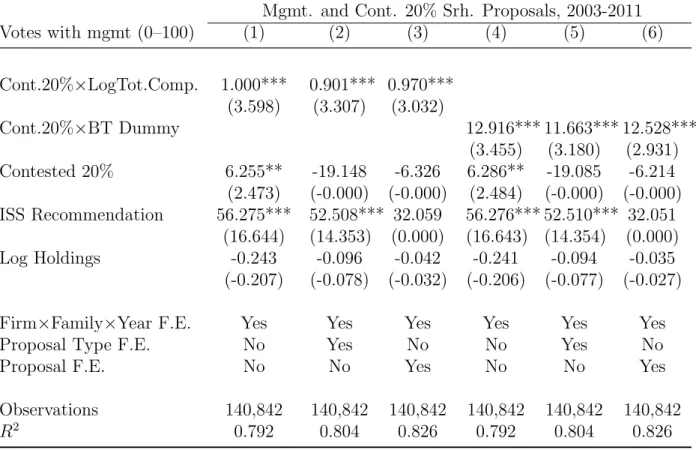
i at time t is a contested proposal in the relevant category and zero if it is sponsored by management. The results are reported in Table VI for contested 20% proposals and in Table VII for contested 10%. The e↵ects are positive and significant at the 1% level in all tables and across all specifications. In specification (2c), reported in columns 3 and 6, for contested 20% proposals, the coefficient for the continuous measure is 0.970 and that for the discrete measure is 12.528. The latter number indicates that a move from no business ties to some business ties leads to an increase (relative to management proposals) in pro-management voting of over 12% for proposals that pass or fail by less than 20%. Recalling that the unconditional support for management in contested 20% proposals is 44.28%, it is plausible that a change of this magnitude can a↵ect the final voting outcome.
zero if it is not. This approach significantly reduces our sample size, but nevertheless we obtain significant results for contested 20% proposals. The results are reported in Internet Appendix Table IV.28
Analyzing contested proposals allows us to focus on the conflict of interest confronting mutual fund managers in the context of business ties and proxy voting. For a given fund family, the probability of being pivotal in voting is higher for proposals that do not pass or fail by a wide margin. Thus, for contested proposals, fund families may be aware that they can influence the outcome. Further, the passage of a shareholder proposal can enhance the value of a firm on the day of the vote, and in turn the value of the mutual fund’s portfolio, only when the voting outcome is not fully anticipated by the market (Core, Guay, and Rusticus (2006)). Proposals that are contested 10% or 20% may be less likely to deliver outcomes fully anticipated by the market. In sum, it is for contested proposals that the trade-o↵
between value enhancement and business compensation is likely to be salient for the mutual fund manager: voting to pass the proposal (against management’s wishes) is relatively likely to enhance portfolio value (and thus benefit fund investors), but may also lead to a loss of favor with company managers (and thus hurt the fund family’s future profits). The fact that we find an incremental e↵ect of contestedness on biased voting suggests that mutual fund families choose business ties over portfolio value when it matters.
(10%) proposals, management uniformly recommended voting against, and funds voted in favor of roughly half of these proposals. This analysis also helps to sharpen the interpretation of our results. While we believe a natural interpretation of the association between business ties and pro-management voting is a “quid pro quo” between company executives and fund managers, an alternative interpretation may be that such ties provide enhanced information transfer between companies and funds, leading toimproved voting. However, management’s uniform opposition to contested proposals, combined with the fact that contested proposals are—on average—value enhancing (Cu˜nat, Gine, and Guadalupe (2012)), implies that any potential information imparted via business ties is not necessarily in the best interest of shareholders.29
VI.
Management Friendliness Without Business Ties?
In our conceptual framework and in motivating and interpreting the empirical analysis that followed, we focus on the management origins of biased proxy voting: managers in need of proxy voting support attempt to influence institutional investors to vote according to management’s recommendation. In this context, the natural candidates to influence are institutional investors with which the firm has nontrivial business ties since the existence of such relationships enhances the potential for communication and creates opportunities to threaten credible punishment. But could the desirability of revenues from future business ties lead funds without business ties to vote in a more pro-management manner? In other words, is pro-management voting principally demand-driven (induced by management in need of voting support), supply-driven (generated by fund families voluntarily o↵ering their
services), or both? Table
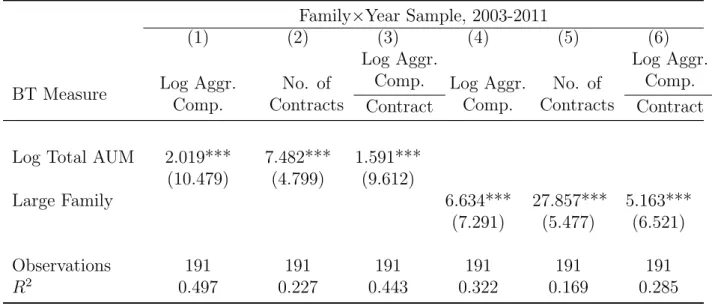
biased voting is to use their size. Business ties are principally awarded to the largest fund families. In Table VIII we document the association between a fund family’s size and the total amount of business ties it receives. We use two measures of fund size: a continuous mea-sure, LogTotalAUMf,t = LogPiHoldingsf,i,t, and a discrete measure, LargeFamilyf, which is set to one for an above-median-size family (according to PtLogTotalAUMf,t) and zero otherwise. For the total amount of business ties we use the logarithm of aggregate total com-pensation a fund family receives across all firms per year, LogAggregateCompensationf,t =
LogPiTotalCompensationf,i,t, the total number of business contracts a fund family has per
year, NumberofContractsf,t, and the logarithm of aggregate total compensation per con-tract and year, LogAggregateCompensationf,t
NumberofContractsf,t . Across all definitions, there is a strong association
conjecture, we run:
VoteswithManagementf,i,p,t= ↵+ 1BTDummyf,i,t+ 2LogHoldingsf,i,t+
+ 3Shareholderi,p,t+ 4LargeFamilyf+
+ 5Shareholderi,p,t⇥BTDummyf,i,t+
+ 6BTDummyf,i,t⇥LargeFamilyf+
+ 7Shareholderi,p.t⇥LargeFamilyf+
+ 8Shareholderi,p,t⇥BTDummyf,i,t⇥LargeFamilyf+
+ 9ISSRecommendationi,p,t+
+ i⇥µf ⇥ t+
8 > > > > < > > > > :
·
⇡zISS
⇡p
| {z }
Fixed E↵ects Terms
+"f,i,p,t.
(3a) (3b) (3c)
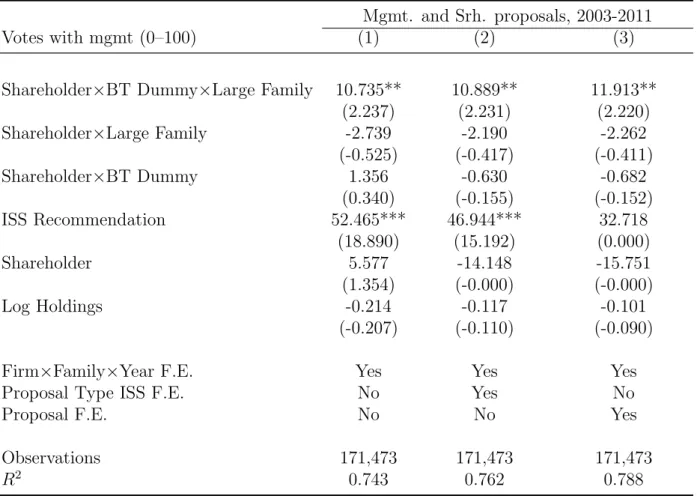
This is similar to (2a) to (2c) in Section IV for the discrete business ties measure but we add an extra di↵erence with respect to the size of the fund family. Fixed e↵ects are exactly as in (2a) to (2c). The results are presented in Table IX.
The coefficient on the interaction between shareholder proposals, the presence of business ties, and above-median fund family size (Shareholderi,p,t ⇥BTDummyf,i,t⇥LargeFamilyf)
V.30
This evidence is consistent with the association between size and business ties docu-mented in Table VIII: if large fund families are more likely to be pro-management than small funds when they are endowed with business ties, corporations would find it in their interest to award business ties to large families. The evidence is also consistent with the demand-driven process for biased proxy voting built into our conceptual framework: if a corporation has business ties with multiple fund families, then assuming that larger families have higher holdings, managers are more likely to lean on the largest families to vote with the management recommendation. Finally, this evidence is also consistent with smaller families perceiving a lower level of benefit from signalling management friendliness, along the lines discussed above: if they are unlikely to get future business ties (from other corporations) anyway, it is less worthwhile for them to vote pro-management on a given proposal.31
A di↵erent way to examine the possibility of supply-driven pro-management voting is to compare the management friendliness of large and small fund families that do not have business ties, captured by the coefficient on the Shareholderi,p.t ⇥LargeFamilyf term. A
positive and significant value for this coefficient would suggest that large fund families vote more pro-management even without business ties in comparison to small families because they are more likely to obtain business ties as future rewards. We find no statistically significant support for this hypothesis.
Our findings are consistent with the primacy of a demand-driven process for pro-management voting. This, in turn, suggests that there is something special about incumbency that makes it feasible to support biased voting. One possible explanation is simple: a fund family that
know how many other funds (including the incumbent holders of business ties) are doing the same. Thus, the rewards for management friendliness are quite uncertain. For an incumbent fund family, however, the risks are more to the downside: displeasing managers leaves it directly exposed to punishment. Indeed, management can directly and immediately punish
only incumbent funds. The issue of demand-driven versus supply-driven pro-management voting is related to the issue of correlation versus causality, which we discuss next.
VII.
Correlation versus Causality
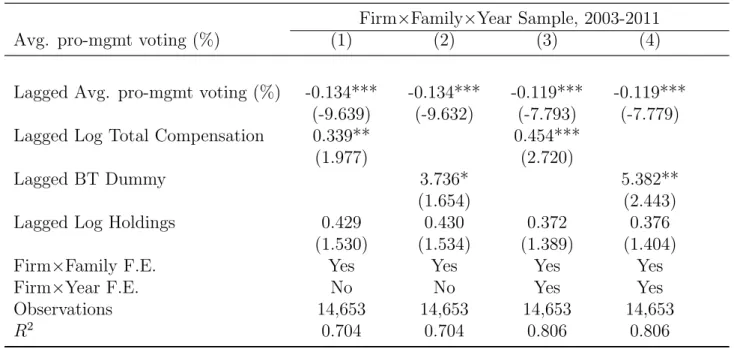
In Sections II, IV, and V, we document a significant association between pro-management voting and business ties. The degree of saturation provided by our specifications leaves little room for omitted variables. However, while we present suggestive evidence in Section VI consistent with a demand-driven process for biased proxy voting, it is clear that our regressions cannot formally separate whether business ties cause pro-management voting (i.e., fund families are averse to losing the rents derived from business ties with plan sponsors and thus vote with management) or pro-management voting causes business ties (i.e., firm executives reward funds that vote with management with increased business ties). At the broadest level, we are agnostic about the precise direction of causality: in our view, both
manifestations have qualitatively similar negative economic consequences. Figures 1–2 here One way to informally capture the direction of causality is encapsulated in Figures 1 and 2. The figures show a sharp increase in pro-management voting by plan providers in the year following the establishment of business ties (Figure 1) and a measurable decline in the
we define a measure of “management friendliness” for fund families as follows:
AverageproManagementVotingf,i,t=
PP(i,t)
p=1 VoteswithManagementf,i,p,t
P(i, t) ,
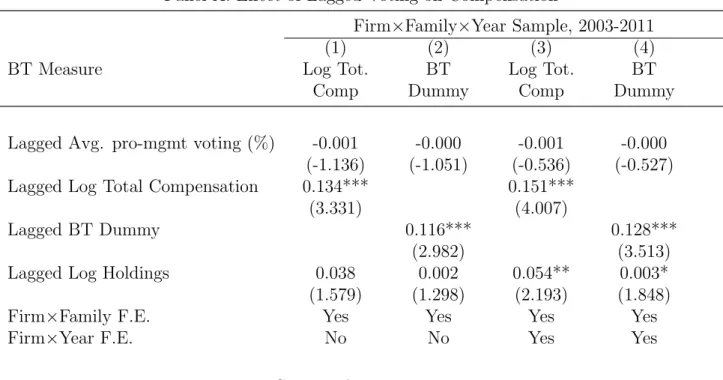
where P(i, t) is the total number of shareholder proposals that fund family f votes on at time t in firm i.32 We then estimate the following specification:
BusinessTiesMeasuref,i,t = ↵+ 1AverageproManagementVotingf,i,t 1
+ 2BusinessTiesMeasuref,i,t 1+ 3LogHoldingsf,i,t 1
+ Fixed E↵ects Terms +"f,i,t,
whereBusinessTiesMeasuref,i,tcan be either the continuousLogTotalCompensationf,i,tor the
discreteBTDummyf,i,t. Since all these variables are in the firm⇥family⇥year dimension, we now collapse our data in this dimension. We use firm⇥family fixed e↵ects to exploit only the heteregoneity in the time dimension as in our graphs. Further, we include the lagged version of the dependent variable as a control variable, together with the lagged version of our main independent variable, thus generating a (pseudo) Granger causality test.33 The results are in Table X, Panel A. Across all specifications, the coefficient of interest 1 is very
Using the same sample and the same fixed e↵ects, we next run:
AverageproManagementVotingf,i,t= ↵+ 1AverageproManagementVotingf,i,t 1+
+ 2BusinessTiesMeasuref,i,t 1+
+ 3LogHoldingsf,i,t 1+
+ Fixed E↵ects Terms +"f,i,t.
The results are reported in Table X, Panel B. The coefficient of interest 2is now positive and
significant, suggesting that lagged business ties are associated with higher pro-management voting.34
While we reiterate that without some exogenous event, the direction of causality cannot be well identified, these results are consistent with business ties leading management friend-liness, and not vice versa. They are also consistent with the demand-driven story envisaged in our conceptual framework and supported by the suggestive evidence in Section VI.35
VIII.
Conclusion
The relevance of mutual funds to retail investors via their role in managing retirement accounts and to corporate governance via their role as blockholders in many major corpo-rations makes their proxy voting an issue of significant importance. However, mutual funds also have business relationships with the firms in which they are blockholders. In this paper we examine the extent to which these business ties influence the proxy voting behavior of mutual funds.
contrast to prior literature and hold for arbitrary pairs of fund families and firms, even at the level of individual proposals, and after controlling for ISS recommendations and holdings. The association is insignificant for management proposals and significant for shareholder proposals. We explain this heterogeneity by developing a simple model of management influence over proxy voting that predicts that, as a result of the higher degree of control enjoyed by managers over self-sponsored proposals, business ties are likely to be less relevant for proxy voting on management proposals than for shareholder proposals. The model also predicts that the association between business ties and proxy voting will be more pronounced for proposals that pass or fail by a relatively narrow margin. These two key predictions are supported by an empirical examination via multiple di↵erence-in-di↵erence specifications that robustly control for unobserved heterogeneity by including fixed e↵ects at the level of individual firm, family, and year triples.
our paper highlights how agency frictions arising in the asset management sector may a↵ect the nature of corporate governance.
Initial submission: August 12, 2014; Accepted: September 16, 2015
Appendix
Proof of Lemma 1: If SA > 12 + , and management goes forward with a proposal, their
payo↵ from exerting influence is v kp(SA), the benefit of the proposal passing net of the
cost of influence, while from not exerting influence is v since the proposal is a sure thing, and passes anyway. If SA < 12 , and management goes forward with a proposal, their
payo↵ from exerting influence is kd kp(SA), since influence cannot alter the outcome on
a lost cause, while from not exerting influence is kd, since the proposal is a lost cause.
Thus, in neither of these cases will influence be exerted. IfSA= 12, and management chooses
to go ahead with an unmodified proposal, the payo↵ from exerting influence is v kp 12 ,
since exerting influence guarantees the passage of contestable proposals, whereas the payo↵
from not exerting influence is 12(v) + 12( kd) corresponding to the events that ✏ > 0 and
✏<0 respectively. Thus, management will exert influence only if the proposal is sufficiently valuable, that is, v 2kp 12 kd. When v 2kp 12 kd, managers will sometimes find
it in their interest to modify the proposal upon going forward. This is because, conditional on v 2kp 12 kd, the payo↵ from not modifying is (by backward induction) v kp 12 ,
whereas the payo↵ from modifying is (1 m)v. Thus, managers will prefer to modify (thus eliminating the need to persuade) whenever (1 m)v > v kp 12 , that is, v <
kp(12)
m . Note
that since m < 12,
kp 12
m >2kp
✓ 1 2 ◆ >max ✓
0,2kp
✓ 1 2 ◆ kd ◆ .
Thus, forv > kp(
1 2)
m , managers will take forward an unmodified proposal and exert influence.
⌅
share-holder proposal, resulting in no reduction in payment but incurring the costkp(12). If they do
not, then their expected payo↵ is 1
2(v kd) +
1
2(0), reflecting respectively the case in which
✏ < 0 (so the proposal passes and the managers receive payo↵ v, a negative number, and simultaneously lose face via defeat in a proposal they opposed, resulting in a further costkd)
and the case in which✏ >0, so that the proposal fails without the exertion of influence and the managers’ payo↵s are unchanged. Accordingly, they will exert negative influence on a proposal they oppose as long as 12(v kd)< kp(21), that is, if v < 2kp(12) kd . ⌅
Proof of Proposition 1: Influence is exerted on management-sponsored proposal with prob-ability ✓ G ✓ 1 2 + M ◆ G ✓ 1 2 M ◆◆ 1 H ✓
kp(12)
m
◆
,
whereas for shareholder-sponsored proposals influence is exerted with probability
✓ G ✓ 1 2+ S ◆ G ✓ 1 2 S ◆◆
H( (2kp(c) kd)).
Since S M, it follows that G 1
2 +
S G 1
2
S G 1
2 +
M G 1
2
M . The
symmetry of h(·) implies that H 2kp(12) kd = 1 H 2kp(12) kd , whereas m < 12
implies that kp(12)
m >2kp(
1
2)>2kp(
1
2) kd, so that H( (2kp(c) kd))>1 H
⇣k
p(12) m
⌘
REFERENCES
Ashraf, Rasha, Narayanan Jayaraman, and Harley E. Ryan, 2012, Do pension-related busi-ness ties influence mutual fund proxy voting? Evidence from shareholder proposals on executive compensation, Journal of Financial and Quantitative Analysis 47, 567–588.
Bebchuk, Lucian A., Alma Cohen, and Allen Ferrell, 2009, What matters in corporate governance, Review of Financial Studies 22, 783–827.
Cohen, Lauren, and Breno Schmidt, 2009, Attracting flows by attracting big clients,Journal of Finance 64, 2125–2151.
Core, John E., Wayne R. Guay, and Tjomme O. Rusticus, 2006, Does weak governance cause weak stock returns? An examination of firm operating performance and investors’ expectations,Journal of Finance 61, 655–687.
Cremers, Martijn K.J., and Roberta Romano, 2011, Institutional investors and proxy voting: The impact of the 2003 mutual fund voting disclosure regulation, American Law and Economics Review 13, 220–268.
Cu˜nat, Vicente, Mireia Gine, and Maria Guadalupe, 2012, The vote is cast: The e↵ect of corporate governance on shareholder value, Journal of Finance 67, 1943–1977.
Dasgupta, Amil, and Giorgia Piacentino, 2015, The Wall Street walk when blockholders compete for flows, Journal of Finance 70, 2853–2896.
Davis, Gerald F., and E. Han Kim, 2007, Business ties and proxy voting by mutual funds,
Davis, Gerald F., and Mina Yoo, 2003, Le monde toujours plus petite des grandes entreprises Americaines: Partecipations communes et liens dans le conseil d’administrations (1990-2001),Gerer et Comprendre 74, 51–62.
Duan, Ying, Edith S. Hotchkiss, and Yawen Jiao, 2011, Business ties and information ad-vantage: Evidence from mutual fund trading, Working paper, Boston College .
Edmans, Alex, 2013, Blockholders and corporate governance, Annual Review of Financial Economics 6, 23–50.
Gantchev, Nickolay, 2013, The costs of shareholder activism: Evidence from a sequential decision model,Journal of Financial Economics 107, 610–631.
Hamdani, Assaf, and Yishay Yafeh, 2012, Institutional investors as minority shareholders,
Review of Finance 17, 1–35.
Holmstrom, Bengt, and Jean Tirole, 1997, Financial intermediation, loanable funds, and the real sector,Quarterly Journal of Economics 112, 663–691.
Karpo↵, Jonathan M, 2001, The Impact of Shareholder Activism on Target Companies: A Survey of Empirical Findings, Working paper, University of Washington .
Li, Tao, 2013, Outsourcing corporate governance: Conflicts of interest and competition in the proxy advisory industry, Working paper, Warwick Business School .
Listokin, Yair, 2008, Management always wins the close ones,American Law and Economics Review 10, 159–184.
McCahery, Joseph A., Zacharias Sautner, and Laura T. Starks, 2016, Behind the scenes: The corporate governance preferences of institutional investors,Journal of Finance, forth-coming .
Table I
Summary Statistics I
All numbers are for our full sample (2003 to 2011). The units of the reported numbers in each panel are given in parentheses at the end of the panel’s heading. Panel A: General characteristics of our merged data set, including data on mutual fund votes reported in ISS Voting Analytics, business relationships of mutual funds with firms reported in DOL Forms 5500, and holdings data at the family level from Forms 13F. Panel B: Number of proposals (and their percentage in parentheses) per category: management, shareholder, and contested as explained in Section VI. In Panels C to G we report statistics for several variables that we use for most of our analysis. Panel C: Percentage of votes with management. This is our main independent variable as defined in Section III. If all funds in a particular family vote with management’s recommendation to a particular proposal, then this number is 100. Votes pertaining to all proposals in our sample are equally weighted, that is, these numbers are for one vote per fund family. Voting behavior at the fund family level across di↵erent proposal categories appears in Table II, Panel B. Panel D: Total compensation at the fund family level. This is our main independent variable, and is the sum of direct compensation (referred to as “salary” prior to 2009), indirect compensation (referred to as “fees” prior to 2009), and assets under management (AUM) divided by 200 for each fund in a family. As reported, for 96% of sample observations we do not have compensation data. The numbers reported here are for the observations with nonmissing compensation data. Panel E: Holdings of fund families in portfolio firms. Panels D & E are equally weighted, that is, one firm⇥family pair per year. Panel F: Contribution of business ties to a fund family’s revenue per year defined as
P
iTotalCompensationf,i,t/
P
i TotalCompensationf,i,t+Holdingsf,i,t/200 , where we posit
a 0.5% expense ratio on the assets under management (AUM) of each fund family. Panel F employs only those fund family–year pairs in which a family had at least one business relationship in the corresponding year. Panel G: Number of funds per fund family voting for a particular proposal before we collapse the voting data along the fund family dimension.
Panel A: General Characteristics (no.)
Observations (votes cast by funds) 1131240 Observations (votes cast by fund families) 171473
Years 9
Firms 3121
Fund Families 29
Firms⇥Families 39944
Firms⇥Years 10026
Table I. Summary Statistics I —continued from previous page
Families⇥Years 191
Firms⇥Families⇥Years 89649
Proposals 17618
Proposal Type ISS 257
Proposal Type MX 12
Proposal Type ISS⇥Years 1136 Proposal Type MX⇥Years 93
Panel B: Proposal Categories (no.)
Management (sponsored) Proposals 13847 (79% of all proposals) Shareholder (sponsored) Proposals 3771 (21% of all proposals)
Contested 20% Shareholder Proposals 1549 (41% of srh. proposals, 9% of all proposals) Contested 10% Shareholder Proposals 784 (21% of srh. proposals, 4% of all proposals)
Panel C: Votes with Management (%)
Mean 77.12
Median 100
Standard Deviation 40.9
Interquartile Range (75%-25%) 14.29
Neither zero, nor 100 5.6%
Panel D: Total Compensation (million $)
Mean 2.25
Median 0.22
Standard Deviation 15.45
Interquartile Range (75%-25%) 0.84
Nonzero 4.1%
Panel E: Holdings (million $)
Mean 101.07
Table I. Summary Statistics I —continued from previous page
Median 11.5
Standard Deviation 393.79
Interquartile Range (75%-25%) 48.53
Panel F: Business Ties / Total Revenue (%)
Mean 13.94
Median 4.17
Standard Deviation 22.42
Interquartile Range (75%-25%) 13.91
Panel G: Funds per family (no.)
Mean 14.94
Median 11
Standard Deviation 13.05
Table II
Summary Statistics II
Panel A: The top 5 business relationships and their corresponding service codes in paren-theses, as reported in DOL Form 5500 - Schedule C. This sample corresponds to the 2003 to 2008 period since reporting of business relationships changed in 2009. For each business relationship we report the constituents of total compensation (direct, indirect, AUM/200), as well as their sum (total compensation). Compensation data are reported in the form mean (variance). All compensation data are for the nonmissing sample. Panel B: Voting behavior as a percentage of appearance in the sample for di↵erent categories of proposals (all, management, shareholder, contested 20%, and contested 10%). Rows pertaining to fund families are averaged across all fund families. Rows pertaining to management and ISS are (nonbinding) recommendations on how shareholders should vote on proposals. Panel C: Distribution of voting results. Results in years pertain to the frequency of say-on-pay proposals.
Panel A Top 5 Business
Relationships (87%) Direct Comp. (th.$) Indirect Comp. (mil.$) AUM/200 (mil.$) Tot. Comp. (mil.$) Contract Admin. (12) 7.42 ( 273.27) 1.23 (25.2) 4.34 (21.3) 5.58 (35.9) Recordkeeping (24) 0 (0) 6.40 (3.30) 1.37 ( 13.2) 2.01 (15.2) Investment Mgmt. (21) 13.35 (51.63) 3.26 (7.07) 6.23 (52.4) 9.51 (58.5) Trustee (corporate) (26) 38.06 (443.38) .65 (1.85) .74 (1.43) 1.43 (2.74) Investment advisory (20) 0 (0) 7.17 (6.94) 15.2 (16.4) 22.4 (23.2)
Panel B
Voting Behavior (%) All Mgmt. Srh. Cont. 20%
Cont. 10% Management recommends yes 78.64 99.86 0.72 0.06 0 ISS recommends yes 80.13 84.76 63.11 98.39 99.36 ISS agrees with mgmt. recommendation 74.61 84.73 37.44 1.68 0.64 Fund family votes yes 68.58 82.97 36.32 55.76 58.79 Fund family votes with mgmt. recommendation 77.12 82.94 64.09 44.28 41.22 Fund family votes with ISS recommendation 82.16 87.20 70.87 56.49 58.94
Panel C
Vote Result Frequency Percent Cumulative
Pass 14260 81.12 81.12
Fail 3310 18.83 99.95
Not Disclosed 3 0.02 99.97
One Year 3 0.02 99.99
Table III
E↵ect of Business Ties on Voting (All Proposals)
The dependent variable is the percentage of votes with management at the fund family level on a 0 to 100 scale. The regression is run over all proposals. The main independent vari-able is either the (natural) logarithm of the total compensation of a fund family (“Log Total Compensation”), which gives the extent to which business ties a↵ect fund family voting with management in all proposals (columns 1 to 3) or a business ties dummy (“BT Dummy”), which gives the extent to which going from no business ties to some business relationship a↵ects fund family voting with management in all proposals (columns 4 to 6). The two remaining independent variables are the (natural) logarithm of holdings of fund families in portfolio firms (“Log Holdings”) and the ISS recommendation for a proposal (“ISS Recom-mendation”). Firm⇥family fixed e↵ects are used in all specifications. Extra fixed e↵ects are as reported. In particular, columns 1 to 3 and 4 to 6 correspond to specifications (1a) to (1c) as explained in Section II. All regressions include an intercept, which is not reported. Robust t-statistics are in parentheses, clustered at the family⇥year level. * Significant at 10%; ** significant at 5%; *** significant at 1%.
All Proposals, 2003-2011
Votes with mgmt (0–100) (1) (2) (3) (4) (5) (6)
Log Total Compensation 0.222** 0.243** 0.212** (2.100) (2.395) (2.103)
BT Dummy 2.342* 2.621** 2.214*
(1.831) (2.135) (1.829) Log Holdings 0.658*** 0.633*** 0.556** 0.657*** 0.632*** 0.556** (2.761) (2.815) (2.432) (2.756) (2.809) (2.428) ISS Recommendation 51.187*** 47.542*** 51.185*** 47.542***
(15.626) (13.340) (15.625) (13.340)
Firm⇥Family F.E. Yes Yes Yes Yes Yes Yes Proposal Type ISS F.E. No Yes No No Yes No Proposal F.E. No No Yes No No Yes
Observations 171,473 171,473 171,473 171,473 171,473 171,473
Table IV
E↵ect of Business Ties on Voting (Management versus Shareholder Proposals)
The dependent variable is the percentage of votes with management at the fund family level on a 0 to 100 scale. The regression is run over management (sponsored) proposals (columns 1 to 2) versus shareholder (sponsored) proposals (columns 3 to 4). The main independent variable is either the (natural) logarithm of the total compensation of a fund family (“Log Total Compensation”), which gives the extent to which business ties a↵ect fund family voting with management in all proposals (columns 1 and 3), or a business ties dummy (“BT Dummy”), which gives the extent to which going from no business ties to some business relationship a↵ects fund family voting with management in all proposals (columns 2 and 4). The two remaining independent variables are the (natural) logarithm of holdings of fund families in portfolio firms (“Log Holdings”) and the ISS recommendation for a proposal (“ISS Recommendation”). Firm⇥family and proposal fixed e↵ects are used in all specifications. The coefficient on “ISS Recommendation” is dropped due to collinearity and hence is not reported. In particular, all columns correspond to specification (1c) as explained in Section II. All regressions include an intercept, which is not reported. Robust t-statistics are in parentheses, clustered at the family⇥year level. * Significant at 10%; ** significant at 5%; *** significant at 1%.
Mgmt. Proposals, 2003-2011 Srh. Proposals, 2003-2011 Votes with mgmt (0–100) (1) (2) (3) (4)
Log Total Compensation -0.067 0.353** (-0.702) (2.274)
BT Dummy -0.739 3.917*
(-0.629) (1.964)
Log Holdings 0.713*** 0.714*** 0.304 0.306 (2.807) (2.809) (0.831) (0.834)
Firm⇥Family F.E. Yes Yes Yes Yes
Proposal F.E. Yes Yes Yes Yes
Observations 118,569 118,569 52,904 52,904
Table V
E↵ect of Business Ties on Voting (D-in-D Shareholder Proposals)
The dependent variable is the percentage of votes with management at the fund family level on a 0 to 100 scale. The regression is run over management and shareholder proposals using a di↵erences-in-di↵erences (d-in-d) specification. The independent variables include a business ties measure (“Log Total Compensation” in columns 1 to 3 or “BT Dummy” in columns 4 to 6) and a dummy variable indicating shareholder (sponsored) proposals (“Shareholder”). The interaction of the two, “Shareholder⇥Log Total Compensation” or “Shareholder⇥BT Dummy,” is our main independent variable and gives the extent to which business ties a↵ect fund family voting with management in shareholder proposals relative to management proposals. The two remaining independent variables are the (natural) logarithm of holdings of fund families in portfolio firms (“Log Holdings”) and the ISS recommendation for a proposal (“ISS Recommendation”). Firm⇥family⇥year fixed e↵ects are used in all specifications. The coefficient on the business ties measure (“Log Total Compensation” or “BT Dummy”) is dropped due to collinearity and hence is not reported. Extra fixed e↵ects are as reported. In particular, columns 1 to 3 and 4 to 6 correspond to specifications (2a) to (2c) as explained in Section IV. All regressions include an intercept, which is not reported. Robust t-statistics are in parentheses, clustered at the family⇥year level. * Significant at 10%; ** significant at 5%; *** significant at 1%.
Mgmt. and Srh. proposals, 2003-2011
Votes with mgmt (0–100) (1) (2) (3) (4) (5) (6)
Srh.⇥Log Total Comp. 0.782*** 0.644*** 0.710*** (3.759) (3.100) (2.952)
Srh.⇥BT Dummy 10.165*** 8.441*** 9.220*** (3.693) (3.060) (2.902) Shareholder 3.819*** -15.676 -17.271 3.830*** -15.687 -16.864 (3.060) (-0.000) (-0.000) (3.068) (-0.000) (-0.000) ISS Recommendation 52.477*** 46.954*** 32.720 52.477*** 46.954*** 32.703
(18.923) (15.200) (0.000) (18.921) (15.200) (0.000) Log Holdings -0.222 -0.127 -0.118 -0.222 -0.126 -0.115
(-0.216) (-0.119) (-0.105) (-0.216) (-0.119) (-0.103)
Firm⇥Family⇥Year F.E. Yes Yes Yes Yes Yes Yes Proposal Type F.E. No Yes No No Yes No Proposal F.E. No No Yes No No Yes
Observations 171,473 171,473 171,473 171,473 171,473 171,473
Table VI
E↵ect of Business Ties on Voting (D-in-D Contested 20% Proposals)
The dependent variable is the percentage of votes with management at the fund family level on a 0 to 100 scale. The regression is run over management and shareholder proposals con-tested at the 20% level using a di↵erences-in-di↵erences (d-in-d) specification. The indepen-dent variables include a business ties measure (“Log Total Compensation” in columns 1 to 3 or “BT Dummy” in columns 4 to 6) and a dummy variable indicating contested 20% share-holder (sponsored) proposals (“Contested 20%”). The interaction of the two, “Contested 20%⇥Log Total Compensation” or “Contested 20%⇥BT Dummy,” is our main independent variable and gives the extent to which business ties a↵ect fund family voting with manage-ment in contested 20% shareholder proposals relative to managemanage-ment proposals. The two remaining independent variables are the (natural) logarithm of holdings of fund families in portfolio firms (“Log Holdings”) and the ISS recommendation for a proposal (“ISS Recom-mendation”). Firm⇥family⇥year fixed e↵ects are used in all specifications. The coefficient on the business ties measure (“Log Total Compensation” or “BT Dummy”) is dropped due to collinearity and hence is not reported. Extra fixed e↵ects are as reported. In particular, columns 1 to 3 and 4 to 6 correspond to specifications (2a) to (2c) as explained in Section IV. All regressions include an intercept, which is not reported. Robust t-statistics are in parentheses, clustered at the family⇥year level. * Significant at 10%; ** significant at 5%; *** significant at 1%.
Mgmt. and Cont. 20% Srh. Proposals, 2003-2011 Votes with mgmt (0–100) (1) (2) (3) (4) (5) (6)
Cont.20%⇥LogTot.Comp. 1.000*** 0.901*** 0.970*** (3.598) (3.307) (3.032)
Cont.20%⇥BT Dummy 12.916*** 11.663*** 12.528*** (3.455) (3.180) (2.931) Contested 20% 6.255** -19.148 -6.326 6.286** -19.085 -6.214
(2.473) (-0.000) (-0.000) (2.484) (-0.000) (-0.000) ISS Recommendation 56.275*** 52.508*** 32.059 56.276*** 52.510*** 32.051
(16.644) (14.353) (0.000) (16.643) (14.354) (0.000) Log Holdings -0.243 -0.096 -0.042 -0.241 -0.094 -0.035
(-0.207) (-0.078) (-0.032) (-0.206) (-0.077) (-0.027)
Firm⇥Family⇥Year F.E. Yes Yes Yes Yes Yes Yes Proposal Type F.E. No Yes No No Yes No Proposal F.E. No No Yes No No Yes
Observations 140,842 140,842 140,842 140,842 140,842 140,842