PDF hosted at the Radboud Repository of the Radboud University
Nijmegen
The following full text is a preprint version which may differ from the publisher's version.
For additional information about this publication click this link.
http://hdl.handle.net/2066/180962
Preprint typeset using LATEX style emulateapj v. 01/23/15
2FGL J0846.0+2820: A NEW NEUTRON STAR BINARY WITH A GIANT SECONDARY AND VARIABLEγ-RAY EMISSION
Samuel J. Swihart1, Jay Strader1, Tyrel J. Johnson2, C. C. Cheung3, David Sand4, Laura Chomiuk1, Asher Wasserman5, Søren Larsen6, Jean P. Brodie5, Gregory V. Simonian7, Evangelia Tremou1, Laura Shishkovsky1,
Daniel E. Reichart8, Joshua Haislip8
1Department of Physics and Astronomy, Michigan State University, East Lansing, MI 48824, USA
2College of Science, George Mason University, Fairfax, VA 22030, resident at Naval Research Laboratory, Washington, DC 20375, USA 3Space Science Division, Naval Research Laboratory, Washington, DC 20375, USA
4Department of Physics, Texas Tech University, Box 41051, Lubbock, TX 79409, USA 5University of California Observatories, 1156 High Street, Santa Cruz, CA 95064, USA
6Department of Astrophysics/IMAPP, Radboud University, P.O. Box 9010, 6500 GL Nijmegen, The Netherlands 7Department of Astronomy, The Ohio State University, 140 West 18th Avenue, Columbus, OH 43210, USA 8Department of Physics and Astronomy, University of North Carolina at Chapel Hill, Chapel Hill, NC, USA
Draft version - November 7, 2017
ABSTRACT
We present optical photometric and spectroscopic observations of the likely stellar counterpart to the unassociatedFermi-Large Area Telescope (LAT)γ-ray source 2FGL J0846.0+2820, selected for study based on positional coincidences of optical variables with unassociated LAT sources. Using optical spectroscopy from the SOAR telescope, we have identified a late-G giant in an eccentric (e= 0.06) 8.133 day orbit with an invisible primary. Modeling the spectroscopy and photometry together lead us to infer a heavy neutron star primary of ∼2M and a partially stripped giant secondary of∼0.8M.
Hαemission is observed in some of the spectra, perhaps consistent with the presence of a faint accretion disk. We find theγ-ray flux of 2FGL J0846.0+2820 dropped substantially in mid-2009, accompanied by an increased variation in the optical brightness, and since then it has not been detected byFermi. The long period and giant secondary are reminiscent of theγ-ray bright binary 1FGL J1417.7–4407, which hosts a millisecond pulsar apparently in the final stages of the pulsar recycling process. The discovery of 2FGL J0846.0+2820 suggests the identification of a new subclass of millisecond pulsar binaries that are the likely progenitors of typical field millisecond pulsars.
1. INTRODUCTION
Neutron stars in low-mass binaries can accrete matter and angular momentum from a non-degenerate compan-ion star and be recycled to very fast spin periods, making them detectable as millisecond pulsars (MSPs;Alpar et al. 1982). During active accretion, the system is observable as a low-mass X-ray binary. As the orbital period grows and accretion eventually ends, the neutron star turns on as a radio MSP powered by the spindown energy of the neutron star.
Most MSPs in the Galactic field are binaries with a degenerate white dwarf companion of 0.2-0.3 M and
orbital periods in the range of days to weeks (Tauris & van den Heuvel 2006). These are the end products of the recycling process. Recent advances—especially follow-up of sources discovered with the Fermi Large Area Tele-scope (LAT) in GeVγ-rays—have allowed the discovery of a subclass of MSP binaries with non-degenerate com-panions in which recycling is apparently not yet complete. These sources, which typically show radio eclipses, are cat-egorized based on their companion’s mass. Black widow systems have very light companions (Mc.0.08M) that
are being actively ablated by the wind of the pulsar, while redbacks have non-degenerate, nearly Roche-lobe filling, main sequence companions of massMc&0.2M
(Roberts 2011).
Recently, at least three of these redbacks have been found to switch between accretion-powered X-ray bi-nary states and rotationally-powered pulsar states on
timescales of days to months (Archibald et al. 2009; Pa-pitto et al. 2013; Bassa et al. 2014; Roy et al. 2015; Bogdanov et al. 2015;Johnson et al. 2015). It is not clear how and when these systems switch on or off as a radio MSPs, nor the cause of the rich phenomenology observed when an accretion disk is present, though both are likely related to the interaction between the inner accretion flow and the pulsar magnetosphere. These transitional MSPs are key systems for understanding the physics of the pulsar recycling process, the interactions between energetic pulsars and their binary companions and sur-roundings, and the typical evolutionary paths leading to the general MSP population. Current evolutionary models predict such transitions on timescales comparable to the billion-year-long evolution of the binary, not in weeks to months as is observed in the known transition-ing systems (Benvenuto et al. 2015). Furthermore, these transitional MSPs all have short orbital periods (.0.5 days); while the evolutionary endpoint of these systems is uncertain, they will likely not be typical of MSP bina-ries in the field, which have degenerate companions with periods of days to months.
In this work, we report observations of a brightγ-ray source, 2FGL J0846.0+2820, studied as part of an ongo-ing survey of unassociatedFermi-LAT sources (Strader et al. 2014,2015). Using follow-up optical observations of the presumed companion, including photometry and spectroscopy, we find that 2FGL J0846.0+2820 is likely a Galactic compact binary with a massive neutron star
primary and a giant secondary in a relatively wide orbit. The long orbital period, giant companion, and compo-nent masses are remarkably similar to those of the re-cently discoveredγ-ray bright binary 1FGL J1417.7–4407 (Strader et al. 2015), which was independently found to host a radio MSP (Camilo et al. 2016). Although no pulsar has yet been discovered to be associated with 2FGL J0846.0+2820, our observations provide evidence of a second system in a new subclass of long-periodγ-ray bright binaries with heavy neutron star primaries and giant secondaries. These systems are plausible progen-itors for typical MSP–white dwarf binaries observed in the field.
2. OBSERVATIONS
2.1. Fermi-LAT Source
The γ-ray source was first detected as 2FGL J0846.0+2820 (Nolan et al. 2012), listed in the second full catalog ofFermi-LAT sources, based on the first two years of LAT data obtained from 2008 August to 2010 August using the earlierP7V6instrument response func-tions (IRFs). 2FGL J0846.0+2820 was one of 774 new
γ-ray sources that did not appear in the 1FGL catalog of LAT sources (Abdo et al. 2010) based on overlapping 95% source location confidence contours. The overall significance of 2FGL J0846.0+2820 was 4.1σ, just above the 2FGL catalog detection threshold of test statistic, TS
>25 (Mattox et al. 1996, for four total degrees of freedom – two positional and two spectral; see§3.2 inNolan et al. 2012for a description). With the limited statistics, the average LAT spectrum was best fit as a single power law with photon index Γ = 2.51±0.20 and a 0.1–100 GeV flux,Fγ = (1.1±0.3)×10−8 photons cm−2 s−1,
corre-sponding to a luminosity ofLγ ≈(4.0 ±1.0)×1034(d/
8.1 kpc)2erg s−1(see
§4.3.1for distance estimate), which is comparable to the luminosity of 1FGL J1417.7–4407 (∼3×1034erg s−1,Strader et al. 2015) The 2FGL catalog
1-month binned light curve showed only 95% confidence upper limits indicating each point has TS<10 or flux error uncertainty>50% of the flux value.
We present an updated analysis of the recent Pass 8 Fermi-LAT data in§4.2.
2.2. Optical and Near-IR Counterpart
The γ-ray source 2FGL J0846.0+2820 was selected for follow-up study based on a search of positional co-incidences of periodic optical variables found in the Catalina Sky Surveys Data Release-1 (CSDR1; Drake et al. 2014) catalog withFermi LAT (Atwood et al. 2009) sources. We identified theV ∼15.7 Catalina source CSS J084621.9+280839, with a USNO B1.0 catalog (Monet et al. 2003) J2000 sexagesimal position of (R.A., DEC.) = (08:46:21.89, +28:08:41.0), as a periodic variable 0◦.215
offset from the 2FGL centroid. This object is also associ-ated with a 2MASS point source withJ = 14.21±0.02,
H = 13.59±0.03, K = 13.50±0.03 mag (Cutri et al. 2003). The CSS source is also listed in the Sloan Digital Sky Survey as J084621.87+280840.8 with magnitudes:
u= 18.24, g = 16.51, r = 15.74, i = 15.42, z = 15.22 (Ahn et al. 2012).
2.2.1. Catalina Sky Survey (CSS)
Table 1
PROMPT Photometry of 2FGL J0846.0+2820
JD-2450000 Band Mag Err
(d)
7057.65342 B 17.001 0.289
7057.65421 B 16.366 0.157
7057.65500 B 16.141 0.153
7057.65579 B 16.683 0.214
7057.65658 B 16.755 0.225
7057.65579 B 16.683 0.214
7057.65658 B 16.755 0.225
...
Note—This table is published in its entirety in machine-readable format. A portion is shown here for guidance regarding its form and con-tent. These magnitudes are not corrected for extinction.
To analyze the CSS photometry of this variable, we retrieved 471 CSS photometric measurements of the vari-able optical counterpart taken between 2005 April 10 and 2013 September 25. We searched for periodicity using a Lomb-Scargle periodigram (Scargle 1982), finding peak power at a period of ∼16.2 d, agreeing with the 16.1866 d period found by Drake et al. (2014). When phased on this period, small periodic flux modulation is evident. However, we have found this period to be an alias of the real orbital period determined via spectroscopy (§4.1). The spectroscopic orbital period is 8.1328 d. Augmented by additional photometry, we analyze the phased light curve of the system in§4.3.
The long-term CSS light curve offers the opportunity to study whether the optical flux from the system has changed significantly since 2005. After removing five measurements that were>3σoutliers, there are a total of 466 measurements. The median magnitude is Vequiv
= 15.72 and the median uncertainty 0.06 mag. The long-term CSS light curve reveals a monotonic increase in the mean system brightness over the past∼decade. A least-square linear regression fit to the data shows the system has brightened at a rate of 0.011±0.001 mag yr−1. We
discuss this trend as well as the strange phenomenology present in the phased CSS light curves in §4.5.
2.2.2. PROMPT
We obtained time series photometry of the optical source inB,V, andRbands with the 16-inch PROMPT-5 telescope (Reichart et al. 2005) at Cerro Tololo Interna-tional Observatory between 2015 February 4 and 2015 June 7. Each observing night consisted of multiple 60-second exposures of the target field, which included the candidate optical counterpart to 2FGL J0846.0+2820 as well as five nearby comparison stars.
We performed differential aperture photometry to ob-tain instrumental magnitudes of the target source using the five (non-variable) comparison stars as a reference. We calibrated our instrumental magnitudes using obser-vations of theLandolt(1992) standard star field RU149. Our final sample includes 1643 photometric measurements in B, 1038 in V, and 500 inR, with mean magnitudes
Table 2
Barycentric Radial Velocities of J0846
BJD RV Err.
(d) (km s−1) (km s−1)
2456999.8170356 52.5 1.6
2457003.8053888 32.5 1.6
2457003.8295105 33.2 1.5
2457012.8609441 63.7 2.4
2457037.7599617 83.0 1.7
2457071.6414565 97.0 1.7
2457119.5191800 92.4 2.0
2457120.5289206 96.3 1.7
2457158.4547783 36.9 1.9
2457166.4751144 37.1 2.0
2457170.4641598 58.6 1.9
2457378.8366717 66.0 2.0
2457417.7571464 3.4 3.4
2457463.5367120 44.1 1.9
2457473.6121242 -12.4 2.1
2457495.5359481 64.9 1.9
2457508.5254554 47.7 1.9
2457657.1257481a 95.9 0.9
2457744.7835625 66.5 2.1
2457752.8115122 58.4 1.8
aThis epoch comes from the Keck/HIRES
spectrum.
3. OPTICAL SPECTROPSCOPY
3.1. SOAR and MDM Spectroscopy
We began spectroscopic monitoring of the source with the Goodman Spectrograph (Clemens et al. 2004) on the SOAR 4.1-m telescope on 2014 Dec 8, continuing through 2016 Dec 31. For the initial epochs we used a 2400 l mm−1 grating in the region of the Mgb triplet and a 1.0300 slit, yielding a resolution of∼ 0.7 ˚A. The observations from 2015 December onward used a 2100 l mm−1 grating, covering a similar region of the spectrum, but with a slightly lower resolution of∼0.9 ˚A. Two or three 600 s exposures were taken per epoch. All spectra were reduced in the standard manner, with wavelength calibration performed using FeAr arcs obtained after each set of spectra. A small number of spectra were obtained with a low-resolution 400 l mm−1 grating (resolution
∼5.8 ˚A) to check for evidence of emission.
We measured barycentric radial velocities for the medium-resolution spectra through cross-correlation with bright template stars taken with the same setup. Given the long period of the system, at each epoch we deter-mined the radial velocity as a weighted average of the two or three measurements from the individual 600 s exposures. This gave 19 independent SOAR epochs of velocities (with a 20th coming from the Keck/HIRES observation discussed below). These measurements are listed in Table 2.
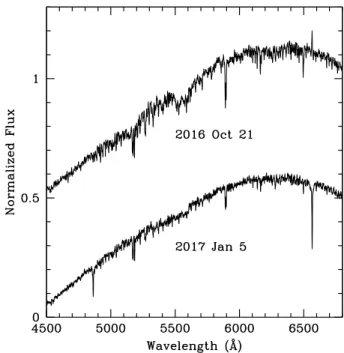
In some of our low-resolution spectra we see evidence for Hαin emission, though the line is generally weak. To better study the emission, we also obtained some low-resolution spectra with OSMOS on the Hiltner 2.4-m telescope at the MDM Observatory at Kitt Peak.These spectra were obtained in 2–3 exposures of 20 min each on eight epochs from 2016 October 20 to 2017 January 8. Reduced in the usual manner, they cover a usable wavelength range of∼ 3960–6840 ˚A at a resolution of about 3.9 ˚A.
These spectra demonstrate a wider range of Hα
mor-phology than observed in the small sample of SOAR spectra, from an epoch with very deep Hαabsorption (1.7 ˚A equivalent width on 2017 Jan 5) to one with ob-vious Hαemission (about 1.0 ˚A equivalent width, and substantially larger if corrected for absorption, on 2016 Oct 21). These changes are accompanied by substantial overall changes in the spectral morphology, with a lower effective temperature implied in the Oct 21 spectrum and a higher effective temperature in the Jan 5 spectrum.
In Figure1we show a comparison of two OSMOS spec-tra taken several months apart that illusspec-trate the extremes of varying effective temperature and Hαemission. In the 2016 Oct 21 spectrum the effective temperature is lower, with more deeper atomic lines and a hint of the emergence of molecular features, along with clear Hαemission and fill-in of Hβ. In the 2017 Jan 5 spectrum the effective temperature is clearly higher and there is no longer any Hαemission visible; the line appears to entirely be in absorption. Other low-resolution spectra are intermediate between these extremes, though unfortunately we do not have enough spectra to track the temperature or emission effectively as a function of orbital phase.
Figure 1. Two of our OSMOS spectra showing the most extreme
examples of varying effective temperature and Hαemission (λrest= 6562.8 ˚A). Our other low-resolution spectra lie somewhere between these extremes.
Analysis of the low-resolution spectra using the spectral classification program MKCLASS(Gray & Corbally 2014) suggests a late-G spectral classification with a subsolar metallicity of –1.1 to –0.6.
3.2. Keck HIRES Spectroscopy
If the secondary is tidally synchronized with the pre-sumed central compact object, we would expect to see evidence of this through the broadening of spectral lines due to rapid rotation. Using the projected rotational ve-locityv sin iand orbital semi-amplitude, the mass ratio
broadening in our SOAR spectra, but the resolution was too low to precisely measurev sini.
To address this, we obtained a high-resolution spectrum with HIRES (Vogt et al. 1994) on the Keck I telescope on 2016 Sep 25. The spectrum was taken using the C5 decker, yielding a nominal resolution of ∼ 36000, and covered a wavelength range of∼3900–8100 ˚A. The single 1200-sec exposure was reduced usingHIRedux(Bernstein et al. 2015).
We additionally obtained a number of spectra of bright late-G to mid-K giant stars with the same resolution and binning to use as templates. We created a set of rotational convolution kernels (assuming a standard limb darkening law) for projected rotational velocities (v sin
i) 10-100 km s-1. Then, on an order-by-order basis, we convolved the spectra of our template stars with the set of kernels and cross-correlated these broadened templates with each of the original, unbroadened spectra. We then fit relations between v sin i and the full-width at half-maximum (FWHM) for each pair of cross-correlations, excluding regions with very strong, broad lines. Finally, we cross-correlated the 2FGL J0846.0+2820 spectrum with the unconvolved template stars and used the FWHM values derived from these cross-correlations to estimate the projected rotational velocity. ForN templates, this procedure producesN2 estimates ofv siniper order. In
practice, we find that the dispersion in v sin i among templates is much smaller than the dispersion among orders, echoing a similar result found for star cluster velocity dispersions (Strader et al. 2009).
The final value derived in this manner is v sin i = 23.2±1.0 km s−1, where the uncertainty is the standard
deviation of the measurements among all of the templates and orders.
Further examination of the HIRES spectrum showed some evidence of chromospheric activity, and also pro-vided us with an estimate of the foreground reddening from the strength of the NaD lines (Munari & Zwit-ter 1997). The E(B −V) estimate is 0.10, which is slightly higher than the 0.04 predicted from theSchlafly & Finkbeiner(2011) all-sky map.
4. RESULTS
4.1. Keplerian Orbit Fitting and Mass Ratio After correcting the observation epochs to Barycentric Julian Date (BJD) on the Barycentric Dynamical Time system (Eastman et al. 2010), we performed a Keplerian fit to our radial velocity data using the custom Markov Chain Monte Carlo samplerTheJoker(Price-Whelan et al. 2017). We fit for the periodP, BJD time of periastron passage TP, eccentricity e, argument of the periastron
ω, systemic velocityγ, and the semi-amplitudeK2. The
posterior distributions were generally close to normal, with equivalent best-fit orbital elements: P = 8.13284± 0.00043 d,TP = 2457007.9589+0.2378−0.2907d,e= 0.061±0.017,
ω= 81◦.8+10.7−12.9,γ= 42.6±0.7 km s−1, andK2= 54.4±1.0
km s−1. This fit is remarkably good, with an rms for the median values of 1.8 km s−1. The phased radial velocity
curve is shown in Figure2.
We use the posterior samples from this fit to derive the mass functionf(M)
f(M) =P K
3 2
2πG =
M1(sini)3
(1 +q)2 (1)
for mass ratio q and inclination i. We find f(M) = 0.136+0.008−0.007M. The mass ratio qcan be directly
deter-mined using our estimate ofvsiniand the semi-amplitude of the secondary using the standard formula v sini = 0.462K2q1/3(1 +q)2/3 (Casares 2001). Using the values
presented above, this gives q = 0.402+0.034−0.037. If the sec-ondary fills its Roche lobe, the orbital period and mass ratio are used to calculate the mean density (Eggleton 1983), yielding ¯ρ= 0.003 g cm-3. Together with an
anal-ysis of our low-resolution spectra, this result leads us to interpret the secondary as a late-G type giant.
We defer a detailed discussion of the inclination to§4.3 below, but note that for typical neutron star masses in the range 1.4–2.0 M, these measurements suggest an
inclination in the approximate range 30–35◦.
Figure 2. Radial velocity curve for the optical counterpart to
2FGL J0846.0+2820 obtained in 20 epochs between 2014 December 8 and 2016 December 31. The high quality fit yields excellent constraints on the orbital ephemeris.
4.2. Fermi-LAT Analysis
Analysis of theγ-ray data was performed usingFermi Science Tools (STs) v10r00p05 and binned likelihood analysis. The background model included all 3FGL cat-alog sources (Acero et al. 2015) and the diffuse γ-ray backgrounds (Acero et al. 2016) using the respective Galactic and isotropic templates files1, gll iem v06.fit and
iso P8R2SOURCE V6 v06.txt. The quoted uncertainties are statistical only and are larger than expected LAT sys-tematic uncertainties of∼8% for fluxes and∼0.1 on the spectral slopes (Ackermann et al. 2012). The normaliza-tion parameters of 3FGL sources with average significance ≥5σin 4 years and within 6◦of the ROI center were left free to vary. Additionally, the normalization parameters of sources flagged as significantly variable and within 8◦ of the ROI center, and of the diffuse components were also free to vary.
We first fit the entire∼8.4-year data set centered at the 2FGL J0846.0+2820 position, modeled as a single power law (normalization and index free). The best-fit parameters of this initial fit wereFγ= (5.2±1.7)×10−9
photons cm−2s−1, Γ = 3.2 ±0.4, and point-source TS = 12 (∼3σ fitting only two spectral parameters). The flux is significantly less than the 2FGL value (see§2.1), implying a variable source. To quantify the variability, we constructed a∼0.5-year binned light curve with 17 bins, the first 16 of which had a 180 day duration and the last one 191 days. For the fit in each time bin, we allowed the same parameters to vary as in the fit of the entire data set but kept the photon index of 2FGL J0846.0+2820 fixed to the initially preliminary fit value. Theγ-ray emission was found to be concentrated within the first two 180-day bins with TS = 6.2 and 29.5 respectively, coinciding with the first half of the time interval analyzed in the 2FGL catalog.
As a next step, we checked for any nearby point sources new to the 8.4-year dataset and not in the 3FGL 4-year catalog. This was done by generating a large TS map of the field, spanning 5◦ ×5◦, with 0◦.25 per pixel. We found two candidate sources, and used gtfindsrc to localize them, then refit their spectral parameters with
gtlikeadopting single power-law models. Only one of
the candidates appeared significant and was included in the model, withFγ = (4.1 ±1.3)×10−9 photons cm−2
s−1, Γ = 2.3±0.4, and TS = 43.0. Thez= 1.283 blazar, B2 0849+28 (Hewett & Wild 2010), is just 0.07 offset
from its best-fit LAT position, R.A. = 133◦.028, Decl. = +28◦.556, and 95% confidence error radius,r95= 4.06, and
is likely the source of theγ-ray emission.
With the new point source in the background model, we fit the LAT position of the target source with only the first two 180-day bins of data, resulting in R.A = 131◦.83, Decl. = 28◦.17 (0◦.212 from the CSS source), r95 = 0◦.14 and
average flux,Fγ = (2.2±0.7)×10−8 photons cm−2 s−1
(∼2x the flux measured when fitting the entire dataset (§ 2.1)), Γ = 2.7 ± 0.2, and TS = 35. For the same 360-day dataset, we compared the best-fit likelihood for a exponentially cutoff power law (normalization, index, and cutoff energy free) and found no significant evidence for curvature in the spectrum (TScut = 0.0; see Abdo et al. 2013). For completeness, we also repeated the analysis with the full 8.4-year dataset, and confirmed the initial
1http://fermi.gsfc.nasa.gov/ssc/data/access/lat/BackgroundModels.html
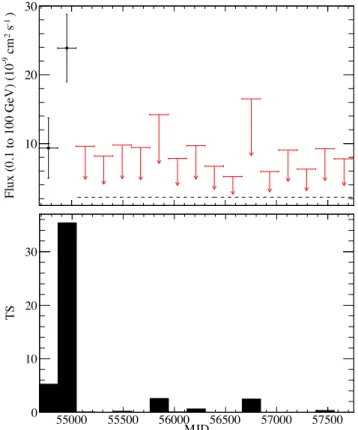
finding of a low-significance source (TS = 6.4) averaged over the larger dataset. We utilized the fitted index = 2.7 that was based on the first 360-days of data, and the new best-fit LAT position to generate the final∼0.5-year lightcurves as presented in Figure3where we only report points for bins in which 2FGL J0846.0+2820 was found with both TS≥4 (∼2σ) and≥4 predicted counts, else a 95% confidence upper limit is shown. We confirmed the initial result that theγ-ray emission is concentrated within the first two 180-day bins with TS = 5.3 and 35.4, respectively. We quantify the significance of variability as TSvar = 161.6 following theFermi-LAT catalog analysis
(see§3.6 inNolan et al. 2012, for the definition), which is well above the threshold of 32 needed to flag this source as variable at 99% confidence level.
)
-1
s
2
cm
-9
Flux (0.1 to 100 GeV) (10
10 20 30
MJD
55000 55500 56000 56500 57000 57500
TS
0 10 20 30
Figure 3. Fermi-LAT 0.1–100 GeVγ-ray light curve (Top) and
corresponding TS values (Bottom) in∼0.5 year bins. In the light curve, down arrows indicate 95% confidence upper limits on the fluxes, and the upper limit derived from the data after the first two bins is indicated with the horizontal dashed line.
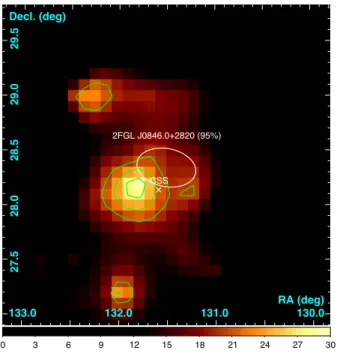
dataset. The shift could be due to several factors, in-cluding using different event reconstructions (P7V6 IRF) and time range compared to the 2FGL catalog analysis, diffuse models for the diffuse background models, and could also indicate a region with poorly modeled diffuse emission seen as extended regions of signal in the resid-ual TS map. To investigate the regions of excess signal visible in Figure 4 that are not associated with 2FGL J0846.0+2820, we constructed another TS map with our target source in the model at the new position. This resulted in no excesses above TS = 13.5 and confidence contours which indicated possible extension, suggesting a positive fluctuation of unmodeled diffuse emission (there are no known features in the adopted diffuse emission model in the region of this source; see Fig. 5 in Acero et al. 2016). This is further supported by the fact that no significant TS excesses were observed at these positions in the TS map covering the full time range.
0 3 6 9 12 15 18 21 24 27 30
27.5 28.0 28.5 29.0 29.5
133.0 132.0 131.0 130.0 Decl. (deg)
RA (deg) CSS
2FGL J0846.0+2820 (95%)
Figure 4. The LAT TS map centered on 2FGL J0846.0+2820
in J2000.0 coordinates (bottom bar indicates TS values). The green contours are, from inside out, 68, 95, 99% confidence on the localization, newly determined from the Pass 8 data analysis. The 2FGL 95% confidence ellipse (white ellipse) is shown as well as the optical CSS position (white cross).
In the interest of better constraining when the flux of 2FGL J0846.0+2820 dropped, we analyzed the second 180 day time bin (2009 Jan 31 to 2009 July 31) in more detail. We constructed flux light curves with 30-day bins spanning ±60 days of our 180 day time bin. We then constructed a second 30-day flux light curve with the start times shifted by 15 days (Figure 5). Due to the rather faint nature of this source, we can not break the flux light curve into smaller intervals, but we estimate that the flux dropped sometime between 2009 May 31.7 (MJD 54982.7) and 2009 Jul 30.7 (MJD 55042.7).
An analysis fitting the entire LAT data set except the first 360 days, with the photon index fixed (Γ = 2.7), resulted in a non-detection with TS = 0 and a 95% flux upper limit of <2.2 × 10⁻⁹ photons cm−2 s−1. This
amounts to a drop in flux of ∼10x with respect to the
second 180-day detection.
Using the spectroscopic optical period and the second (and most significant) 180 day time bin, we searched the LAT data for evidence of modulation with the or-bit. In order to do so, we calculated spectral weights, calculated with the best-fit model for this time range and theFermi STgtsrcprob, which have been shown to enhance sensitivity to periodic signals (e.g.,Kerr 2011). We then calculated the exposure at the position of 2FGL J0846.0+2820 in 30 second intervals over this time period in order to correct for exposure differences with orbital phase (as described in, for instance,Johnson et al. 2015). We used theFermi STgtpphaseto assign orbital phase values to the LAT events and, correcting for exposure and using the spectral weights, tested for modulation using the H-test (de Jager et al. 1989; de Jager & B¨usching 2010) and the Z2m test with two harmonics. Both tests
showed no significant modulation, returning 0.1σ and 0.3σ, respectively.
2FGL J0846.0+2820 is one of 234 unassociated sources not present in the 3FGL catalog, despite a detection at high significance in the earlier (2FGL) catalog. Many of the sources lost between 2FGL and 3FGL were at low Galactic latitudes where the Galactic diffuse emission is strongest, such that improvements in modelling this emission was expected to have the most influence in de-tecting sources. However, 2FGL J0846.0+2820 is out of the Galactic Plane. A number of 2FGL sources out of the Plane were also spurious, some apparently due to contamination from the Moon (Corbet et al. 2012). How-ever, at the declination of 2FGL J0846.0+2820 (ecliptic coordinates: (λ, β) = (126◦.4, 9◦.8)), the effects of the Moon should be minimal, and given the refined event reconstruction and characterization presented here, there is no compelling evidence that it was a spurious source. Instead, our analysis shows that the most likely explana-tion for the absence of the source from the 3FGL catalog is the source variability over the lifetime ofFermi.
MJD
54900 54950 55000 55050 55100
)
-1
s
-2
cm
-8
Flux (0.1 to 100 GeV) (10 1 2 3 4 5
Figure 5. The LAT light curve for the most significant 180-day
4.3. Optical Light Curve Models
We show the phased light curves of the binary in Fig-ure 6. There are two maxima and minima per orbit, consistent with ellipsoidal variations due to a tidally de-formed secondary orbiting the presumed neutron star primary. Motivated by the Hαemission and change in theγ-ray flux of the binary, we start from the assumption that the secondary is filling its Roche lobe, and then explore models where the Roche lobe filling factor is free to vary.
The baseline expectation for ellipsoidal variations are two equal maxima when the projected area of the tidally distorted star is largest, and two unequal minima due to varying effects of gravity darkening when the system is viewed along the axis connecting the primary and sec-ondary. Modelling these ellipsoidal modulations can con-strain the inclination of the system between the extremes where the maximum effect is observed if the system is edge-on (i= 90◦) and no modulations are expected for face-on inclinations (i= 0◦).
0.0 0.5 1.0 1.5
Phase −0.30
−0.15 0.00 0.15 0.30
17.1
16.9
16.7
16.5
B
0.0 0.5 1.0 1.5
Phase −0.2
−0.1 0.0 0.1 0.2
16.2
16.1
16.0
15.9
15.8
15.7
V
−0.15
−0.08 0.00 0.08 0.15
15.6
15.5
15.4
15.3
15.2
R
No Disk Disk
Figure 6. PROMPT B, V, andR light curves folded on the
spectroscopic period. The best fit ELC models that included (right) and excluded (left) a steady accretion disk component are shown with black lines. Uncertainties for each measurement are not shown in the upper panels, but are displayed in the fit residuals (lower panels). Two orbital phases are shown for clarity.
The broad filter used by CSS and its relatively large photometric uncertainties do not make these data ideal for modeling ellipsoidal variations in 2FGL J0846.0+2820. Instead, to model the light curve we use the more precise
and well-sampled PROMPT photometry inB,V, andR
bands.
We model these light curves using the Eclipsing Light Curve (ELC; Orosz & Hauschildt 2000) code. We try fits that include contributions from a Roche-lobe filling secondary and a steady accretion disk component, as well as fits that exclude the disk contribution and allow the filling factor to vary. Throughout, we assume the primary object is invisible. In addition, we set the scale of the system by fixing the value of the orbital period, semi-amplitude, binary mass function, mass ratio, and eccentricity to those determined via spectroscopy. These values imply an average orbital separation ofa∼26R.
We also require the observed value ofv sinibe matched. From an analysis of our low-resolution spectra and the photometric colors, we fix the effective temperature of the secondary (T2) to 5250 K. We note this value is not
well-constrained as the ELC code fits normalized light curves in all bands and is thus insensitive to the effective temperature of the companion. The assumed effective temperature does affect the inferred distance, an issue we revisit in the following section. Given the long period of the system and its luminous secondary, irradiation of the companion by a central X-ray source is likely to be less important than in typical black widows or redbacks. WhileChandraX-ray observations of 2FGL J0846.0+2820 are forthcoming, we have only upper limits on its X-ray flux from all-sky monitors (no clear detections from the Monitor of All Sky X-ray Image (MAXI,∼1-20 keV; Mat-suoka et al. 2009) or the Swift Burst Alert Telescope (BAT,∼15-150 keV;Barthelmy et al. 2005)), which is a comparably weak constraint. For an X-ray luminosity of 1032-1033 erg s−1, the ratio of optical to X-ray flux at the surface of the star is>100, suggesting irradiation is not very important. On the other hand, recent detailed mod-eling of intra-binary shocks in redbacks have suggested the pulsar wind flow is channeled onto the stellar surface due to the magnetic field of the secondary (Romani & Sanchez 2016;Wadiasingh et al. 2017), which may explain the unmodeled features seen in the light curve, such as a phase shift, in the context of irradiation. This issue should be explored in more depth when future X-ray data are available.
We fit the folded light curves forB, V, andR bands simultaneously. For models that included an accretion disk component, we fixed the filling factor of the secondary to 1 while fitting the following parameters: the inclination
i, the inner disk temperatureTdisk, the opening angle of
the disk rimβ, the inner (rin) and outer (rout) radii of
the disk, the power-law index of the disk temperature profileξ, and a small phase shift ∆φ. For models that did not include a disk, we fit the inclination, the filling factor of the secondaryf2, and a phase shift. The best fit
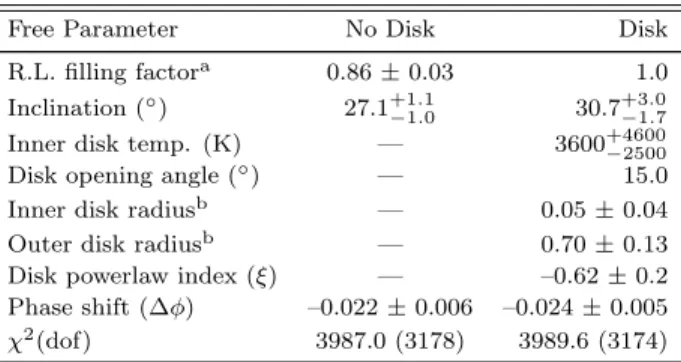
parameters with 1σconfidence levels are listed in Table3. Parameters without listed errors were not well constrained by the models (i.e. flat χ2 distributions) so we refrain from quoting their exact uncertainties, and instead only report the values associated with the best fit.
The first clear result from the fits is that a small phase shift (∆φ) is required: models with no shift can be clearly ruled out at the 4–5σlevel. Approximately the same ∆φ
Table 3
Best fit ELC parameters
Free Parameter No Disk Disk
R.L. filling factora 0.86±0.03 1.0
Inclination (◦) 27.1+1.1
−1.0 30.7 +3.0
−1.7
Inner disk temp. (K) — 3600+4600
−2500
Disk opening angle (◦) — 15.0
Inner disk radiusb — 0.05±0.04
Outer disk radiusb — 0.70±0.13
Disk powerlaw index (ξ) — –0.62±0.2
Phase shift (∆φ) –0.022±0.006 –0.024±0.005
χ2(dof) 3987.0 (3178) 3989.6 (3174)
a The Roche-lobe filling factor of the secondary was fixed to 1.0 for all models that included a disk.
bExpressed as a fraction of the effective Roche-lobe radius of the primary.
exact model.
Similar phase offsets have been observed in some black widow and redback systems, likely due to asymmetries in the heating of the secondary or in the disk (e.g.,Romani & Sanchez 2016; Li et al. 2016). One possibility is that these asymmetries may be caused by hot spots in a disk or star spots on the companion. Although the ELC code allows us to fit for a variety of disk or star spots, we find that adding such features do not significantly change the fit quality, probably due to the relatively face-on nature of the system and our typical measurement uncertainties. Nonetheless, starspots may be important for understanding the long-term variability in the system (see§4.5).
For models that include a disk component and a Roche-lobe filling secondary, we find our best fits to the data occur when the accretion disk contributes a small fraction (<3%) of the total light from the system. This relatively low veiling is not necessarily unexpected, given the weak Hαemission and the dominance of the photometric light curve by ellipsoidal variations. For fits with a disk we find an inclination of 30◦.7+3.0−1.7.
For models without a disk,the best fit χ2 is slightly lower than our best “with disk” model, but given the large number of data points the difference is negligible. Our best fit occurs when the companion is slightly underfilling its Roche lobe, with a filling factorf2= 0.86. This is very
similar to the results ofMcConnell et al.(2015) for the transitional MSP J1023+0023, who foundf2= 0.83+0.03−0.02
while the system was in the radio MSP state.
For 2FGL J0846.0+2820, the inclination implied by the no-disk fit is 27◦.1+1.1−1.0. This value is slightly lower than inferred for the fit including a disk, consistent with the general result that disk veiling leads to an underesti-mate of the inclination from ellipsoidal variations (e.g., Kreidberg et al. 2012;McConnell et al. 2015;Wu et al. 2016).
4.3.1. Distance
We estimate the distance to the system by comparing the luminosity inferred from the best-fit secondary radius and assumed temperature to the observed magnitude of the system. We determined bolometric corrections using 10 Gyr isochrones assuming [Fe/H] = –1 (Marigo et al. 2008). The best fit model assuming the star fills its
Roche lobe has an effective radius of 7.1R. Using an
assumed effective temperature of 5250K, the secondary has a predictedMV = 1.1 mag. Compared to the observed
V0 = 15.63 mag (corrected for extinction using E(B−
V) = 0.10), the distance is ∼8.1 kpc. For an effective temperature of 5000 K, the distance would instead be ∼7.0 kpc.
We performed similar calculations for the case of an underfilled Roche lobe, finding very similar results: ∼8.3 and 7.2 kpc for temperatures of 5250 K and 5000 K, re-spectively. We emphasize that these distance calculations are uncertain and dominated by systematic effects.
Even given the large uncertainty in the distance, the location of the system in the Galactic anti-center (l = 197◦) and its substantial distance above the plane (∼4 kpc for b = 36◦) makes it unlikely that the binary was formed in the thin disk.
4.4. Component Masses
Using the posterior samples for the orbital period, semi-amplitude, and mass ratio obtained from our spectro-scopic analysis (§ 4.1), along with our estimates of the inclination from fitting the photometry, we can infer the primary and secondary masses of the system. For the fits that excluded a disk, we find M1 = 2.81±0.36M
andM2= 1.12±0.21M. The primary mass implied by
these models is larger than any known neutron star and approaches the maximum theoretical mass (Chamel et al. 2013).
For fits that included a disk, our models imply masses
M1 = 1.96±0.41M and M2 = 0.77±0.20M. In
contrast to the fits with no disk, the primary mass is more typical of those inferred for neutron stars in binaries associated withFermi sources (e.g.,Ransom et al. 2011; Romani et al. 2015b;Strader et al. 2015,2016), and we think these masses are more likely to be accurate.
The uncertainties in the component masses are large due to the relatively face-on inclination. Furthermore, the potential for indirect, asymmetric heating on the face of the secondary may be adding an additional source of systematic uncertainty to our mass estimates. A few pre-vious publications that describe the light curve modeling of similar black widow and redback systems have inferred unusually large neutron star masses (>2M), which were
later found to be unreliable because of inadequacies in the assumed model (e.g. not accounting for indirect heating via pulsar spin-down power reprocessed in an intra-binary shock, see Romani et al. 2015a,b, and references therein). However, given the clear differences between this system and typical MSP spiders, including the luminous sec-ondary, the wide orbit, and the face-on orientation of the binary, unmodeled irradiation is expected to make a less important contribution to the systematic uncertainties in our mass estimates than for most MSP binaries with hydrogen-rich companions (see discussion in §4.3).
Nonetheless, other interpretations of the system are unlikely: neither stellar-mass black holes nor white dwarfs in quiescence have been observed to emit GeV gamma rays. The inclination would need to be considerably lower (i= 21◦) to be consistent with even a low-mass 5Mblack
hole, and would need to be somewhat higher (35–40◦) to
systems have periods of hundreds of days and accrete from a wind (Belczy´nski et al. 2000). Future observations can help improve constraints on the presence of a disk and hence on the inclination.
4.5. Long-Term Optical Brightness
As discussed above, there is compelling evidence that the system has brightened at a rate of 0.011±0.001 mag yr−1 over the last decade, with only a few small
inter-ruptions in this monotonic trend (Figure7). There are a number of possible explanations for this trend: the secondary could be slowly increasing in radius; the mean effective temperature could be increasing (either globally or due to a change in the properties of starspots); or an accretion disk could be getting brighter. The last of these was proposed as an explanation for similar secular bright-ness trends in the quiescent black hole binary systems Nova Muscae 1991 (Wu et al. 2016) and A0620-00 (Bailyn 2017).
The trend for 2FGL J0846.0+2820 is not confined to the CSS data: we find that our recent PROMPT data fits the trend, after correcting for a small zeropoint offset of -0.30 mag in the listed Catalina magnitudes using non-variable comparison stars in common between the PROMPT and CSS data.
2005 2006 2007 2008 2009 2010 2011 2012 2013 2014 2015 2016
0 500 1000 1500 2000 2500 3000 3500 4000
MJD - 53000
15.4
15.5
15.6
15.7
15.8
15.9
16.0
16.1
C
SS
V-eq
ui
va
le
nt
(m
ag
)
0.011±0.001 mag/yr
Figure 7. Long-term optical light curve showing a monotonic
increase in the system brightness over the past decade. The Catalina data are shown in red and our recent PROMPTV-band data are in green. The dashed line and rate of brightening are the result of a linear fit to the Catalina data only. A small zeropoint offset has been applied to the PROMPT data as described in§4.5
In addition to the overall trend, the data taken between 2009 November and 2010 June shows a larger scatter than observations before or after this. Above (§4.2), we showed theγ-ray emission disappeared around the start of 2009 July, and these high-scatter observations are the first CSS data taken after this change in the γ-ray flux. Given the long time baseline for comparison, the photometric behavior around this epoch is unusual, and we consider it unlikely that these two events are coincidental: something happened in mid-2009 that affected both theγ-ray flux and optical brightness of the binary.
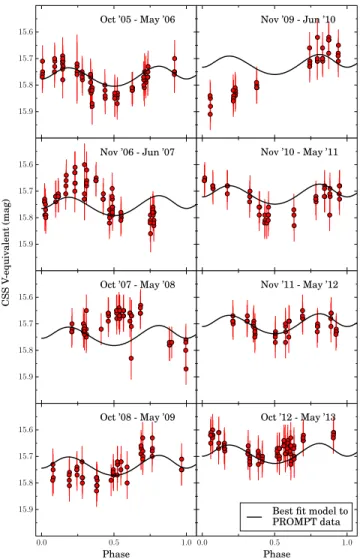
To show the CSS photometry in more detail, we break the data into eight chunks corresponding roughly to the separate epochs visible in Figure 7. When we phase the data on the spectrocopic period, strange behavior is apparent (Figure8). The earliest and latest data show variations more consistent with the ellipsoidal variations found in the PROMPT data (black lines, adjusted for the linear brightening trend), though the phase coverage is not ideal. However, the epochs that bracket the decrease
in gamma rays do not show the same variations, with large changes in either the phase of the variations, or no clear variations at all. For instance, the worst fit to the best ELC model occurs for the data taken between 2009 November and 2010 June (χ2/dof = 82.3/36), while the data from 2005 October to 2006 May clearly matches the model much better (χ2/dof = 23.2/71). This strange
phenomenology as a function of epoch is similar to that observed by van Staden & Antoniadis (2016) for the optical light curves of the redback PSR J1723–2837, which they explain with distinct groups of starspots that vary in number and lifespan over time.
15.9 15.8 15.7 15.6
Oct ’05 - May ’06
15.9 15.8 15.7 15.6
Nov ’06 - Jun ’07
15.9 15.8 15.7 15.6
Oct ’07 - May ’08
CS
S
V-equiv
alent
(m
ag
)
0.0 0.5 1.0 Phase
15.9 15.8 15.7 15.6
Oct ’08 - May ’09
Nov ’09 - Jun ’10
Nov ’10 - May ’11
Nov ’11 - May ’12
0.0 0.5 1.0 Phase
Oct ’12 - May ’13
Best fit model to PROMPT data
Figure 8. The long-term CSS data split into eight separate epochs
(first 4 on left, last 4 on right) and phased on the spectroscopic period. The best fit ELC model (with a disk) from§4.3is shown in black, adjusted for the linear trend seen in Figure7. The shape of the light curve does not appear consistent with typical ellipsoidal variations across all epochs.
5. DISCUSSION AND CONCLUSIONS
Continuing our program to follow up on unassociated Fermi sources using photometry and spectroscopy, we have shown that the previously unidentified γ-ray source 2FGL J0846.0+2820 is likely associated with a heavy neutron star of roughly 2 M with a giant secondary
companion (M2∼0.8M) in an 8.133 d orbit.
of some unassociated Fermi sources. For instance, the space density of CRTS variable stars is about 2.7 per deg2 at the latitude of 2FGL J0846.0+2820. It is
there-fore not surprising that, in addition to the source that is the subject of this paper, there is another periodic optical variable (CSS J084632.3+282524) present inside the newly determined Pass 8 99% confidence ellipse. This other source is classified as a contact binary with an op-tical period of 0.36 days (Marsh et al. 2017). Based on the massive, invisible primary inferred for the original CSS source (CSS J084621.9+280839), and the rarity of compact binaries in the field, the evidence for an associa-tion between this source and theFermi γ-ray emission is strong.
An analogous example is the recent discovery of the likely redback MSP counterpart to theFermisource 3FGL J0838.8–2829. Halpern et al.(2017a) observed the 3FGL field in the optical and X-rays, motivated by the presence of a cataclysmic variable (CV) that showed variability in these bands. However, it was quickly determined that this CV was unlikely to be the γ-ray source. Instead, optical photometric and spectroscopic observations suggested a previously unknown X-ray/optical variable source, which showed properties consistent with redback MSPs in their pulsar state, was the correct counterpart to the γ-ray source (see also,Halpern et al. 2017b).
Forthcoming X-ray observations will help confirm the connection between the Fermi γ-ray source 2FGL J0846.0+2820 and the optical binary CSS J084621.9+280839.
Nonetheless, this work shows that such positional coinci-dence searches between optical variables and unassociated Fermi sources can be productive and may provide a rel-atively “low-cost” method of identifying new compact binaries in the Galaxy.
Overall, 2FGL J0846.0+2820 is very similar to the recently discovered γ-ray bright binary 1FGL J1417.7– 4407 (Strader et al. 2015), which was independently found to host a radio MSP (Camilo et al. 2016). This system has a heavy neutron star primary and giant secondary in a long 5.4 d orbit. The high primary mass and long period of 2FGL J0846.0+2820 are also similar to the famous MSP J1614–2230, though this system has a white dwarf secondary and has ceased mass transfer (Demorest et al. 2010).
Similarly to the conclusions reached byStrader et al. (2015) andCamilo et al.(2016) for 1FGL J1417.7–4407, 2FGL J0846.0+2820 has properties consistent with a sys-tem on the standard evolutionary track of low-mass X-ray binaries that started Case B mass transfer after leaving the main sequence and whose orbital periods will increase over time (e.g.,Tauris & Savonije 1999). These systems do not fit into the existing classes of black widow or red-back neutron star binaries, and we have suggested that an apt name for this new subclass is “huntsman”, after a large spider that does not engage in sexual cannibalism. One relevant difference between 1FGL J1417.7–4407 and 2FGL J0846.0+2820 is the non-zero eccentricity of the latter. Nearly all binary MSPs in the field have circu-lar orbits due to tidal interactions that occur when the system undergoes mass transfer, spinning up the pulsar. It is possible that 2FGL J0846.0+2820 has only partially completed the recycling process and not yet circularized, or that a non-zero eccentricity has emerged due to the
interaction of the binary with a circumbinary disk, as has been theorized for some MSP systems (Antoniadis 2014).
It is now clear that both rotation-powered millisecond pulsars and accreting neutron stars can be associated with γ-ray emission. Such emission is generally weak for millisecond pulsars but is apparently ubiquitous in these systems, while it has been observed in only a small number of low-mass X-ray binaries. These latter systems all belong to the class of transitional millisecond pulsars or have other phenomenological similarities with this class. For two of the three systems that have shown actual transitions, the γ-ray flux is observed to be higher in the accreting state.
Thus, it would be natural to associate the decrease in
γ-ray flux for 2FGL J0846.0+2820 with a transition from a disk to a pulsar state in mid-2009. As we discussed in §4.5, there are some unusual features in the optical light curve around that possible transition time.
The issue with a direct analogy to the other transitional millisecond pulsars is that the higher variations in the optical flux were transient, with no long-term evidence of a state change. For example, the 2013 state change in PSR J1023+0038 was associated with an optical bright-ening of nearly 1 mag (Bogdanov et al. 2015). Hence, these optical data are more consistent with a “glitch” in the binary than a full-fledged state change. However, the relatively nearby main-sequence companion of PSR J1023+0038 is much less luminous than the more distant giant secondary in 2FGL J0846.0+2820. If the compan-ion to PSR J1023+0038 were replaced with the giant in 2FGL J0846.0+2820, the secondary would swamp the disk, resulting in an inferred disk fraction that falls well below 10%. Therefore, similar state changes in 2FGL J0846.0+2820 might not be associated with such obvious changes in the optical brightness.
Given that the mechanism for these transitions is not understood, and the notable physical differences between these hunstmen and the redback transitional millisecond pulsars, a difference in phenomenology of the optical and
γ-ray emission may not be unexpected.
Some evidence for this can be found in 1FGL J1417.7– 4407. In this system there is strong, double-peaked Hα
observed at nearly all epochs from early 2013 to the present (with the latter statement from continuing spec-troscopic monitoring with SOAR).Strader et al.(2015) took this as evidence for an accretion disk. This system also has a hard X-ray spectrum and a high ratio of γ -ray to X--ray flux, consistent with transitional MSPs in their disk states. However, this simple interpretation was challenged by the discovery of an MSP associated with this source byCamilo et al. (2016). The overlap between the observation epochs of these two studies show that the source was active as an MSP while it also appeared to have an accretion disk. It is possible that a disk is present but that the accreted material is not reaching the surface of the neutron star, perhaps due to ejection in a propeller (Strader et al. 2015). Alternatively, the double-peaked Hαcould be due to complex line profiles associated with a wind (Camilo et al. 2016) or an intra-binary shock that forms due to the interaction of the pulsar wind outflows with the disk and/or material from the companion (e.g. Bogdanov et al. 2011;Rivera Sandoval et al. 2017).
and Hαemission suggests a disk could be present. How-ever, the current absence of gamma rays, the dominance of the photometric light curve by ellipsoidal variations, and our best-fit ELC models favor a low-mass disk at the most. Given that a millisecond pulsar was detected in 1FGL J1417.7–4407 (Camilo et al. 2016) despite the presence of strong double-peaked Hαsuggesting a more substantial accretion disk (Strader et al. 2015), a search for a radio pulsar in 2FGL J0846.0+2820 is well-motivated.
The apparent variability in theFermi data along with the peculiar long-term optical light curve suggest we are far from fully understanding 2FGL J0846.0+2820. However, this work provides convincing evidence for the presence of a heavy neutron star primary with a giant secondary in a relatively wide orbit. These long-period
γ-ray bright binaries with massive neutron stars and giant companions likely represent the late phases oftypicalMSP binary formation in the Galactic field, phases which until recently had been unobserved. Further characterizations of similar systems would also provide new insight on the relationship between MSPs and low-mass X-ray binaries.
ACKNOWLEDGEMENTS
We thank the anonymous referee for their helpful sug-gestions that improved the clarity of this paper. S.J.S. thanks Stephan Frank (Ohio State) for observing help provided during the on-site MDM run. Support from NASA grant NNX15AU83G is gratefully acknowledged. J.S. is supported by a Packard Fellowship. Based on observations obtained at the Southern Astrophysical Re-search (SOAR) telescope, which is a joint project of the Minist´erio da Ciˆencia, Tecnologia, e Inova¸c˜ao (MCTI) da Rep´ublica Federativa do Brasil, the U.S. National Optical Astronomy Observatory (NOAO), the University of North Carolina at Chapel Hill (UNC), and Michigan State Uni-versity (MSU). Some of the data presented herein were obtained at the W.M. Keck Observatory, which is op-erated as a scientific partnership among the California Institute of Technology, the University of California and the National Aeronautics and Space Administration. The Observatory was made possible by the generous financial support of the W.M. Keck Foundation. TheFermi LAT Collaboration acknowledges generous ongoing support from a number of agencies and institutes that have sup-ported both the development and the operation of the LAT as well as scientific data analysis. These include the National Aeronautics and Space Administration and the Department of Energy in the United States, the Commis-sariat `a l’Energie Atomique and the Centre National de la Recherche Scientifique / Institut National de Physique Nucl´eeaire et de Physique des Particules in France, the Agenzia Spaziale Italiana and the Istituto Nazionale di Fisica Nucleare in Italy, the Ministry of Education, Cul-ture, Sports, Science and Technology (MEXT), High Energy Accelerator Research Organization (KEK) and Japan Aerospace Exploration Agency (JAXA) in Japan, and the K. A. Wallenberg Foundation, the Swedish Re-search Council and the Swedish National Space Board in Sweden. Additional support for science analysis during the operations phase is gratefully acknowledged from the Istituto Nazionale di Astrofisica in Italy and the Centre National d’ ´Etudes Spatiales in France. This work per-formed in part under DOE Contract DE-AC02-76SF00515. Portions of this research performed at NRL are sponsored
by NASA DPR S-15633-Y.
REFERENCES
Abdo, A. A., Ackermann, M., Ajello, M., et al. 2010, ApJS, 188, 405
Abdo, A. A., Ajello, M., Allafort, A., et al. 2013, ApJS, 208, 17 Acero, F., Ackermann, M., Ajello, M., et al. 2015, ApJS, 218, 23 —. 2016, ApJS, 223, 26
Ackermann, M., Ajello, M., Albert, A., et al. 2012, ApJS, 203, 4 Ahn, C. P., Alexandroff, R., Allende Prieto, C., et al. 2012, ApJS,
203, 21
Alpar, M. A., Cheng, A. F., Ruderman, M. A., & Shaham, J. 1982, Nature, 300, 728
Antoniadis, J. 2014, ApJL, 797, L24
Archibald, A. M., Stairs, I. H., Ransom, S. M., et al. 2009, Science, 324, 1411
Atwood, W. B., Abdo, A. A., Ackermann, M., et al. 2009, ApJ, 697, 1071
Bailyn, C. D. 2017, in IAU Symposium, Vol. 324, IAU Symposium, 35–38
Barthelmy, S. D., Barbier, L. M., Cummings, J. R., et al. 2005, Space Sci. Rev., 120, 143
Bassa, C. G., Patruno, A., Hessels, J. W. T., et al. 2014, MNRAS, 441, 1825
Belczy´nski, K., Miko lajewska, J., Munari, U., Ivison, R. J., & Friedjung, M. 2000, A&AS, 146, 407
Benvenuto, O. G., De Vito, M. A., & Horvath, J. E. 2015, ApJ, 798, 44
Bernstein, R. M., Burles, S. M., & Prochaska, J. X. 2015, PASP, 127, 911
Bogdanov, S., Archibald, A. M., Hessels, J. W. T., et al. 2011, ApJ, 742, 97
Bogdanov, S., Archibald, A. M., Bassa, C., et al. 2015, ApJ, 806, 148
Camilo, F., Reynolds, J. E., Ransom, S. M., et al. 2016, ApJ, 820, 6 Casares, J. 2001, in Lecture Notes in Physics, Berlin Springer
Verlag, Vol. 563, Binary Stars: Selected Topics on Observations and Physical Processes, ed. F. C. L´azaro & M. J. Ar´evalo, 277–327
Chamel, N., Haensel, P., Zdunik, J. L., & Fantina, A. F. 2013, International Journal of Modern Physics E, 22, 1330018 Clemens, J. C., Crain, J. A., & Anderson, R. 2004, in Proc. SPIE,
Vol. 5492, Ground-based Instrumentation for Astronomy, ed. A. F. M. Moorwood & M. Iye, 331–340
Corbet, R. H. D., Cheung, C. C., Kerr, M., & Ray, P. S. 2012, in Fourth International Fermi Symposium Proceedings, ed. T. J. Brandt, N. Omodei, & C. Wilson-Hodge, eConf C121028, 21 Cutri, R. M., Skrutskie, M. F., van Dyk, S., et al. 2003, 2MASS
All Sky Catalog of point sources.
de Jager, O. C., & B¨usching, I. 2010, A&A, 517, L9
de Jager, O. C., Raubenheimer, B. C., & Swanepoel, J. W. H. 1989, A&A, 221, 180
Demorest, P. B., Pennucci, T., Ransom, S. M., Roberts, M. S. E., & Hessels, J. W. T. 2010, Nature, 467, 1081
Drake, A. J., Graham, M. J., Djorgovski, S. G., et al. 2014, ApJS, 213, 9
Eastman, J., Siverd, R., & Gaudi, B. S. 2010, PASP, 122, 935 Eggleton, P. P. 1983, ApJ, 268, 368
Gray, R. O., & Corbally, C. J. 2014, AJ, 147, 80
Halpern, J. P., Bogdanov, S., & Thorstensen, J. R. 2017a, ApJ, 838, 124
Halpern, J. P., Strader, J., & Li, M. 2017b, ApJ, 844, 150 Hewett, P. C., & Wild, V. 2010, MNRAS, 405, 2302 Johnson, T. J., Ray, P. S., Roy, J., et al. 2015, ApJ, 806, 91 Kerr, M. 2011, ApJ, 732, 38
Kreidberg, L., Bailyn, C. D., Farr, W. M., & Kalogera, V. 2012, ApJ, 757, 36
Landolt, A. U. 1992, AJ, 104, 340
Li, K.-L., Kong, A. K. H., Hou, X., et al. 2016, ApJ, 833, 143 Marigo, P., Girardi, L., Bressan, A., et al. 2008, A&A, 482, 883 Marsh, F. M., Prince, T. A., Mahabal, A. A., et al. 2017, MNRAS,
465, 4678
Matsuoka, M., Kawasaki, K., Ueno, S., et al. 2009, PASJ, 61, 999 Mattox, J. R., Bertsch, D. L., Chiang, J., et al. 1996, ApJ, 461, 396 McConnell, O., Callanan, P. J., Kennedy, M., et al. 2015, MNRAS,
Monet, D. G., Levine, S. E., Canzian, B., et al. 2003, AJ, 125, 984 Munari, U., & Zwitter, T. 1997, A&A, 318, 269
Nolan, P. L., Abdo, A. A., Ackermann, M., et al. 2012, ApJS, 199, 31
Orosz, J. A., & Hauschildt, P. H. 2000, A&A, 364, 265
Papitto, A., Ferrigno, C., Bozzo, E., et al. 2013, Nature, 501, 517 Price-Whelan, A. M., Hogg, D. W., Foreman-Mackey, D., & Rix,
H.-W. 2017, ApJ, 837, 20
Ransom, S. M., Ray, P. S., Camilo, F., et al. 2011, ApJL, 727, L16 Reichart, D., Nysewander, M., Moran, J., et al. 2005, Nuovo
Cimento C Geophysics Space Physics C, 28, 767
Rivera Sandoval, L. E., Hernandez Santisteban, J. V., Degenaar, N., et al. 2017, ArXiv e-prints, arXiv:1708.07041
Roberts, M. S. E. 2011, in American Institute of Physics Conference Series, ed. M. Burgay, N. D’Amico, P. Esposito, A. Pellizzoni, & A. Possenti, Vol. 1357, 127–130
Romani, R. W., Filippenko, A. V., & Cenko, S. B. 2015a, ApJ, 804, 115
Romani, R. W., Graham, M. L., Filippenko, A. V., & Kerr, M. 2015b, ApJL, 809, L10
Romani, R. W., & Sanchez, N. 2016, ApJ, 828, 7
Roy, J., Ray, P. S., Bhattacharyya, B., et al. 2015, ApJL, 800, L12 Scargle, J. D. 1982, ApJ, 263, 835
Schlafly, E. F., & Finkbeiner, D. P. 2011, ApJ, 737, 103
Strader, J., Chomiuk, L., Sonbas, E., et al. 2014, ApJL, 788, L27 Strader, J., Li, K.-L., Chomiuk, L., et al. 2016, ApJ, 831, 89 Strader, J., Smith, G. H., Larsen, S., Brodie, J. P., & Huchra, J. P.
2009, AJ, 138, 547
Strader, J., Chomiuk, L., Cheung, C. C., et al. 2015, ApJL, 804, L12
Tauris, T. M., & Savonije, G. J. 1999, A&A, 350, 928
Tauris, T. M., & van den Heuvel, E. P. J. 2006, Formation and evolution of compact stellar X-ray sources, ed. W. H. G. Lewin & M. van der Klis, 623–665
van Staden, A. D., & Antoniadis, J. 2016, ApJL, 833, L12 Vogt, S. S., Allen, S. L., Bigelow, B. C., et al. 1994, in Proc. SPIE,
Vol. 2198, Instrumentation in Astronomy VIII, ed. D. L. Crawford & E. R. Craine, 362
Wadiasingh, Z., Harding, A. K., Venter, C., B¨ottcher, M., & Baring, M. G. 2017, ApJ, 839, 80