MORPHOLOGICAL EFFECTS ON COATED AEROSOL KINETICS
Elias Patrick Rosen
A dissertation submitted to the faculty of the University of North Carolina at Chapel Hill in partial fulfillment of the requirements for the degree of Doctor of Philosophy in the Department of Chemistry
Chapel Hill 2008
Approved by:
Tomas Baer
Christopher Fecko Gary Glish
ABSTRACT
Elias P. Rosen: Morphological Effects on Coated Aerosol Kinetics (Under the direction of Tomas Baer)
ACKNOWLEDGEMENTS
TABLE OF CONTENTS
LIST OF TABLES………ix
LIST OF FIGURES………...x
Chapters 1 INTRODUCTION……….1
1.1 Aerosols in the atmosphere and their impacts on health, climate, and chemistry…….………1
1.1.1 Definition of aerosols and how they are formed………1
1.1.2 Health effects of aerosols………... 2
1.1.3 Climate effects of aerosols………. 2
1.1.4 Influence of aerosols on atmospheric chemistry……… 3
1.2 Composition of tropospheric aerosols………... 4
1.2.1 Prevalence of organics in aerosols………. 4
1.2.2 Mixing state of organic aerosols……… 5
1.2.3 Impact of surface active organics……….. 6
1.3 Chemical Aging of organic particles………. 8
1.3.1 Oxidation reactions, typical products, and prevalence………...8
1.3.2 Ramifications of compositional changes………... 8
1.4 Physical chemistry of aging………... 9
1.4.1 Processes involved in heterogeneous reactions and the concept of γ……….9
1.4.2 Modeling the processes of g with the Resistor Model………. 12
1.4.3 Movement toward experiments of more complex morphologies…….12
1.5 Oleic acid: A model system to investigate morphological effects on chemical reactivity………... 14
1.6 The current work……….. 18
References……… 19
2 DESIGN AND THEORY OF A NEW CONDENSATION OVEN………... 26
2.1 Introduction……….. 26
2.2 Core types and properties………. 26
2.2.1 Silica as a proxy for mineral dust………26
2.2.2 Polystyrene as a proxy for hydrophobic soot-like surfaces………….27
2.2.3 Properties of the core particles………28
2.3 Design and development of the coating oven………...29
2.4 Prediction of coating mass by condensation theory………. 34
2.4.1 Condensation to a solid sphere: Evaluating the mass transfer regime………. 34
2.4.2 Condensation to a solid sphere: Estimating the rate of collisions………..39
2.4.3 Condensation to a porous sphere: Capillary condensation and confinement………...40
2.5 Conclusion………... 44
3 CHARACTERIZATION OF SURFACE-ADSORBED OLEIC ACID
ON SOLID CORE PARTICLES………. 48
3.1 Introduction……..……… 48
3.2 Experimental methods for particle characterization……… 48
3.2.1 Generation of coated aerosols………..48
3.2.2 On-line characterization with ATOFMS and APS………..50
3.2.3 Off-line characterization by SEM, AFM, and filter extraction………52
3.3 Results of coated particle characterization by on-line methods………...53
3.3.1 Compositional analysis with the ATOFMS………. 53
3.3.2 Particle sizing analysis with the ATOFMS and APS………... 60
3.4. Results of coated particle characterization by off-line methods….………... 66
3.4.1 SEM analysis………66
3.4.2 AFM analysis………69
3.4.3 Off-line Filter Analysis……… 71
3.5 Discussion of morphology………..………. 73
3.5.1 Amount of adsorbed oleic acid……….………... 73
3.5.2 Island formation and orientation of adsorbed oleic acid on the core surface………... 74
3.5.3 Lack of evidence for pore condensation……….. 78
3.6 Conclusion………... 79
References……… 81
4 KINETICS STUDIES OF THE REACTION BETWEEN O3 AND ADSORBED OLEIC ACID……… 84
4.1 Introduction……….. 84
4.3 Results of kinetics studies……… 86
4.3.1 Dependence on core type and coating coverage………. 86
4.3.2 Dependence of the observed rate constant on O3 concentration…….. 91
4.3.3 Determination of Uptake Coefficients………..94
4.4 Discussion……… 97
4.4.1 Influence of island morphology on kinetics………. 97
4.4.2 Influence of core particle size and porosity on kinetics………... 98
4.4.3 Influence of core particle type on kinetics………... 99
4.5 Conclusions and atmospheric implications……… 103
References……….. 104
5 CONCLUSIONS………...……….107
LIST OF TABLES Table
2.1 Relevant parameters of core particles……….. 29 2.2 Derived parameters used to calculate DAB………38
LIST OF FIGURES Figure
1.1 Two-dimensional mapping of organic functional groups on ambient particles……….7
1.2 Processes controlling heterogeneous reactions……….11
1.3 Generalized Resistor Model………. 13
1.4 Estimated lifetime of oleic acid particles based on measured uptake coefficients….. 15
2.1 Vapor pressure of oleic acid as a function of oven temperature……….. 31
2.2 Reynolds number in the coating oven as a function of temperature……… 33
2.3 Velocity contours in the coating oven calculated by FLUENT………... 35
2.4 Temperature contours in the coating oven calculated by FLUENT……… 36
2.5 Predictions of adsorbed oleic acid volume based on condensation theory………….. 41
2.6 Adsorption isotherms of n-hexane onto porous silica substrates of different pore diameters and non-porous silica………...43
3.1 Experimental set-up: Particle generation, coating, and particle characterization by ATOFMS……… 49
3.2 Calibration of pure oleic acid particle volume to M+.(m/z = 282) intensity measured by two-laser desorption/ionization using the ATOFMS……….. 55
3.3 Transmittance spectrum for amorphous silica………. 56
3.4 Comparison of mass spectra of oleic acid adsorbed to silica and PSL particles and as pure droplets………. 58
3.5 Optimized M+. (m/z = 282) signal intensity of adsorbed oleic acid as a function of oleic acid vapor pressure in the coating oven for each core type and size……….. 59
3.6 Optimized total signal intensity of adsorbed oleic acid as a function of oleic acid vapor pressure in the coating oven for each core type and size………... 61
3.8 Shift in measured aerodynamic diameter of coated core particles as a
function of oleic acid vapor pressure in the coating oven………63 3.9 Estimated effect of changes in ρp and χ on da based on Equations 3.1 and 3.2……... 65 3.10 SEM images of core particles before and after exposure to oleic acid vapor……….. 67 3.11 AFM phase images of 1.6 µm silica and 1.6 µm PSL particles exposed to
an oleic acid vapor pressure of 4.3 x 10⁻³ Pa………... 70 3.12 AFM images of oleic acid on flat substrates………... 72 3.13 Revised estimated adsorbed volume of oleic acid on 1.6 µm PSL and
1.6 µm silica particles based on collected SEM images……….. 75 3.14 “Quasi-smectic” packing of oleic acid in a bulk liquid………... 77 4.1 Experimental set-up for kinetic studies: Particle generation and coating,
flow tube reactor, and particle characterization by ATOFMS……….……… 85 4.2 Decay of the M+. signal intensity (m/z = 282) upon exposure to O3………... 88 4.3 Typical decay of the relative adsorbed oleic acid signal upon exposure to O3……… 89 4.4 Summary of observed rate constants for ozonolysis of adsorbed oleic acid as a
function of oleic acid vapor pressure in the coating oven………... 90 4.5 [O3] dependence of the pseudo-first-order rate constant for ozonolysis of
adsorbed oleic acid on 1.6µm core particles of PSL and silica………... 93 4.6 [O3] dependence of the uptake coefficient, γ, for ozonolysis of adsorbed
CHAPTER 1
INTRODUCTION
1.1 Aerosols in the atmosphere and their impacts on health, climate, and chemistry
1.1.1 Definition of aerosols and how they are formed
Particulate matter is pervasive throughout the atmosphere and comes from a host of
sources with both biogenic origins, such as windborne dust and sea spray, and anthropogenic
origins, such as combustion of fuels. Condensed-phase particulate matter suspended in the
atmosphere can be either ejected or emitted into the air in a fully formed state at the time of
entrainment (primary particulate matter), or formed in situ by gaseous molecules in the atmosphere through chemical reaction, nucleation, condensation, or some combination of
these processes (secondary particulate matter).1 The ensemble of these particles and the vapor they are entrained in is known as an aerosol. Though diminutive in size, aerosols can
have a large influence on human health, the global energy budget, and the prevailing
chemistry of the atmosphere. This chapter details the role that aerosols play in atmospheric
chemistry, the prevalence of organic material in ambient aerosols, and the importance of
understanding how this organic material is processed by our oxidizing atmosphere. A model
1.1.2 Health effects of aerosols
Most aerosols are sufficiently small, typically having diameters between 10 nm and
10 µm,2 that they can be respired by the human lungs, and aerosols below about 100 nm in
diameter can “penetrate the membranes of the respiratory tract and enter the blood circulation
or be transported along olfactory nerves into the brain.”3 Exposure to particulate matter has been linked worldwide to an increase in cardiac and respiratory morbidity and mortality. A
recent study in the US showed a correlation between exposure to particulate matter smaller
than 10 microns (PM10) and mortality in 20 US cities as well as hospitalization in persons 65 years and older in 14 US cities. The effects of PM10 on mortality and hospitalization persisted
and were not substantively changed with control for other pollutants.4 These cases were most closely associated with cardiovascular and respiratory issues. Respired aerosols can inflame
or obstruct the airways. While the exact toxicological response to different types of particles
is still unclear, many aerosol characteristics including particle size, surface area, and
chemical composition determine the health risk posed by PM.5
1.1.3 Climate effects of aerosols
Aerosols alter Earth’s energy balance by interacting directly with extraterrestrial
radiation or reflected radiation from the Earth’s surface. Particles can scatter light impinging
from the sun and reflect some portion of this light away from the Earth’s surface, which
results in a net loss of energy to the atmosphere and has a cooling effect. Particles can also
absorb some of the impinging solar energy as well as reflected energy from the Earth, and the
subsequent re-emission of a portion of the absorbed energy by the particles serves as a net
condensation nuclei (CCN), for clouds which have an enormous effect on the Earth’s albedo,
aerosol particles can also have an indirect effect on climate. As an ensemble, these direct and
indirect perturbations require equilibrium shifts in the Earth’s climate on local, regional, and
global scales. The net climate forcing of an individual particle depends sensitively on a
particle’s size, chemical composition, and mixing state, as well as its complex interaction
with other atmospheric constituents such as water vapor. The chemical heterogeneity of
aerosols render global assessments of climate forcing by aerosols incredibly challenging, and
as a result these assessments remain “the dominant uncertainty in radiative forcing”
according to the recently issued Fourth Assessment Report by the Intergovernmental Panel
on Climate Change.6
1.1.4 Influence of aerosols on atmospheric chemistry
The presence of condensed phase materials in the atmosphere also influences its
chemistry. Although current understanding of heterogeneous reactions is small relative to
homogeneous gas phase reactions, the impacts on the chemistry of the atmosphere due to
aerosols are significant. Incorporation of a species into the condensed phase may serve to
sequester or scavenge a species from the atmosphere, limiting its ability to participate in
homogeneous gas-phase reactions. Alternatively, the presence of a condensed-phase surface
can catalyze chemical reactions that would otherwise proceed much more slowly in
homogeneous gas-phase reactions. Even in regions of the atmosphere that are relatively
devoid of particulates, such catalytic processes can have profound results. The stratospheric
ozone hole, perhaps the most widely recognized discovery in the field of atmospheric
particles cm-3 existing in the stratosphere based on evidence that the halogen-based chemistry governing ozone loss occurs more efficiently and at a higher rate in condensed
environments.7,8 Particle number densities increase substantially closer to the Earth’s surface, with concentrations in excess of 105 particles cm-3 in an urban environment, suggesting that aerosols can play an even greater role in governing the chemistry of the troposphere.2
1.2 Composition of tropospheric aerosols 1.2.1 Prevalence of organics in aerosols
The impacts aerosols have on health, climate, and atmospheric chemistry are all
dependent on the chemical composition of the particles. The sources of input for particulate
matter in the troposphere are many and varied, as are the resulting particulate components.
Tropospheric aerosols can take the form of water and ice, dust, sea salts, natural and
anthropogenic sulfates, and organic matter.9,10 Increasing attention has been paid to organic aerosols, which are common in the troposphere and have been measured in urban11 and remote12 environments. As field observations devoted to the measurement of organic aerosols have increased, it has become clear that organic matter is a major component of fine
particulate matter in all regions of the atmosphere and can make up to 90% of the total
particle mass under certain conditions.11,13 Organic aerosols are directly emitted to the atmosphere (primary organic aerosol, POA) from sources including wax emission from
plants, sea spray, combustion emissions, and biomass burning. Condensed phase organic
carbon is also formed in the atmosphere from low-volatility products produced by the
oxidation of gas-phase anthropogenic and/or biogenic precursors (secondary organic
and cyclic alkanes, alkenes, aromatics, alcohols, and carboxylic acids.14 The complexity of organic material in aerosols is evidenced by the fact that as many as 10,000 separate organic
components have recently been identified from a single urban source through the use of a
sensitive orthogonal gas chromatography/ mass spectrometry techniques.15 Unfortunately, analytical methods employed in most field campaigns leave significant portions of organic
material unresolved and unidentified.
1.2.2 Mixing state of organic aerosols
Part of the difficulty of component identification is that organics tend to be internally
mixed in particles9,16-18, limiting the amount of analyte for analysis. Internal mixing can occur at the point of particle formation, for example when wave action in regions of the
ocean subject to biofilms creates ocean spray with an organic surfactant layer that has been
modeled as an inverted micelle.19 Mixing within an aerosol particle can also occur throughout the evolution of an aerosol as organic vapors adsorb onto/absorb into surfaces of
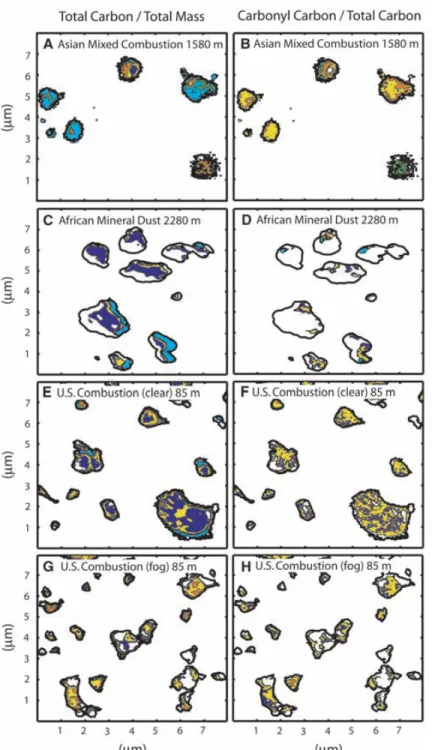
existing organic and inorganic particulates20 or as externally mixed particles agglomerate and coagulate21. Characterization of ambient particles has revealed that the heterogeneity within particles can be both compositional and morphological. A recent study cataloging the organic
functional groups of almost 600 particles collected from different geographical locations and
altitudes found that in addition to 14 distinct groupings of organic functionalities across all
particles sampled, more than 80% of the particles exhibited chemical signatures indicating
internal mixing with non-carbonaceous material.22 The distribution of organic material within individual ambient particles is also highly heterogeneous. Soft X-ray spectromicroscopy
combustion over the Sea of Japan, African mineral dust over the Carribean Sea, and U.S.
combustion in New Jersey) reveals that the total organic material on the collected particles,
shown in the left column of Figure 1.1, is not distributed uniformly over an entire particle.23 When such organic matter is adsorbed to a solid core or is immiscible with a liquid seed
particle, the result is an organic surfactant layer.
1.2.3 Impact of surface active organics
The presence of these organic films may alter the physical properties of the resulting
internally mixed aerosol particle, as well as hinder some chemical reactions while promoting
others. Films can serve as a barrier to mass transfer, limiting uptake of some gases as well as
evaporation of the core. For example, non-reactive uptake of water by an aqueous core is
decreased by an organic coating due to the layer’s hydrophobicity29,30, which has important consequences for the particle’s ability to serve as CCN. The organic film can also inhibit
chemical reaction. McNeill and coworkers observed a reduction in the uptake of N2O5 by
aqueous NaCl aerosols by almost an order of magnitude due to the presence of an organic
monolayer of sodium dodecyl sulfate.31 Smoyzdin et al. performed numerical simulations of the impact that an oleic acid surfactant coating has on marine aerosols and found that the
presence of the surface film reduced mass transfer from the sea salt water core to the
atmosphere.32 An organic coating may also alter the net optical properties of the particle. Importantly, all of these effects are perturbed as the organic coating reacts with gaseous
1.3 Chemical aging of organic particles
1.3.1 Oxidation reactions, typical products, and prevalence
Once emitted to the atmosphere, the lifetime of organic compounds is determined by
chemical removal pathways. These include direct photolysis by ambient radiation, or more
frequently by photochemical oxidation due to a host of oxidizing species of the atmosphere
including ·OH, O3, NOx, SOx, and halogen radicals.1,2,33 Oxidation reaction products are highly oxygenated, adding functional groups such as alcohols, aldehydes, carboxylic acids,
and more complex peroxy acids to an organic molecule. The products of homogeneous
reactions between gas phase oxidants and organics, as well as secondary chemistry among
the primary products, can have sufficiently low vapor pressure to condense and form SOA.14 Oxidation can also occur through heterogeneous reaction between gas phase oxidants and
condensed phase organics. Chemical characterization of aerosols sampled around the world
by aerosol mass spectrometry has shown that the presence of oxygenated organic matter is
“ubiquitous” in the atmosphere and has been measured in both rural and urban
environments.34 Two-dimensional mapping of carbonyl carbon groups on particles collected by Maria et al.23, pictured in the right column of Figure 1.1, shows that these groups are prevalent in organic aerosols of very different geographical and mechanical origin, and that
they are distributed over a similar areal extent as the total carbon.
1.3.2 Ramifications of compositional changes
Oxidation alters the physical and chemical properties of an organic coating. For
example, the addition of oxygen can decrease the hydrophobicity of a fatty acid layer of oleic
soluble, which changes the surface composition as well as its structure.36 Recently, Shilling et al. have shown that the conversion of an oleic acid film from CCN inactive to CCN active
is associated with oligomerization of the products accompanied by a lowering of the
interfacial surface tension of a particle37, which has also been seen for other humic-like substances38. Water soluble organic compounds can be significant players in direct radiative forcing and also as CCN.39 The influence of the hydrophobic to hydrophilic conversion of organic films on climate is currently being assessed. A recent Global Climate Model study
found that the presence of marine organic aerosol was essential to predict correct CCN
concentrations, and that the mixing state of the organic particles influenced the results.40 Oxidation can also result in low molecular weight volatile products that can increase the
atmospheric burden of oxygenated volatile organic products such as nonanal, and these
volatile products may be an important source of gaseous organic carbon.41
1.3.3 Degree of oxidation as a tool for determining the age of organics
The amount of oxygenation of an organic species increases with time in the
atmosphere, and as a result the carbon-normalized oxygen content of an aerosol can be used
as a means of measuring the aging of the organic fraction in atmospheric particles.42 Establishing the age of an aerosol is critical for source apportionment, as well as for
determining its oxidation rate.
1.4 Physical chemistry of aging
Accurately modeling the impact that oxygenated organic aerosols have on
atmospheric chemistry and climate, as well as human health, requires understanding the
mechanisms by which such reactions occur. Considerable experimental effort has been
devoted to quantifying the rate of chemical transformation and aging of aerosol particles and
the processes that control this transformation. Homogeneous reaction mechanisms, involving
collision between two gaseous species, are generally well understood. Heterogeneous
reactions are considerably more complicated, entailing some combination of the following
processes:
o Diffusion of the oxidant to the particle surface o Accommodation of the oxidant at the particle surface
o Reaction between oxidant and organic at the particle surface, and/or o Diffusion of the oxidant into the organic particle
o Reaction between the oxidant and organic within the bulk of the particle
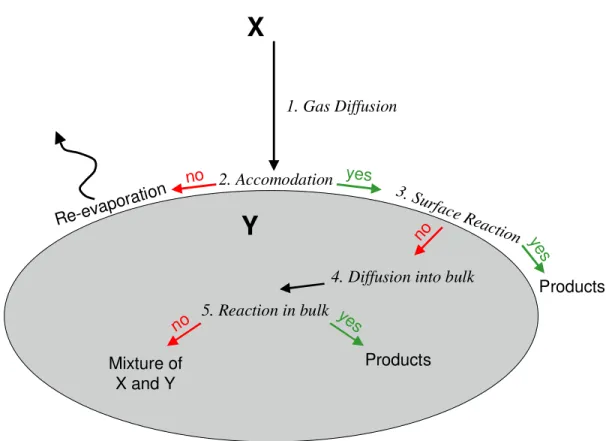
Figure 1.2 depicts these processes for the simplest system: an oxidant, X, attacking a particle
comprised entirely of a single organic species, Y. Laboratory and field measurements of
reaction between two species such as X and Y are typically reported in terms of an uptake
coefficient, γ, which encapsulates all of the physics and chemistry shown in Figure 2 and
reflects the probability that an encounter between a molecule of X and the surface of Y will
result in a chemical reaction.
Products yes
no 2. Accomodation
3. Surface
Reaction
Re-evapo ration
4. Diffusion into bulk 1. Gas Diffusion
X
no ye
s
5. Reaction in bulk ye
s
Products no
Mixture of X and Y
Y
Figure 1.2. Processes controlling heterogeneous reactions. In this simplified reaction
1.4.2 Modeling the processes of γ with the Resistor Model
Deconvoluting the separate contributions of each of these processes from
measurements of a net uptake coefficient is not straightforward, but necessary in order to
incorporate into atmospheric chemistry models. Methods to parameterize each process as a
separate, independent “resistance” have been developed into the aptly named Resistor Model
describing heterogeneous reactions.43 A generalization of this concept is shown in Figure 1.3. Solutions of this model can be found for certain limiting conditions, and laboratory based
kinetics experiments involving simple particle morphologies have been designed to test this
model. However, its applications are not universal, particularly when considering more
realistic particle morphologies as will become evident in the work to be described.
1.4.3 Movement toward experiments of more complex morphologies
While the simplified heterogeneous systems that have been the focus of laboratory
experiments to date have provided a useful framework for developing a means of
understanding the processes that are controlling heterogeneous reactions in the atmosphere, it
is clear that they have not yet been able to mimic the complexity of atmospheric processes.
As the body of experimental work has grown, it has become clear that there is a significant
“gap”44 between the rates of chemical oxidation of organic aerosols measured in the laboratory and observed in field experiments. One of the primary differences between the
two bodies of measurements is the morphology of the particles that are analyzed. Increasing
Figure 1.3. Generalized Resistor Model. The model is a representation of the physical and chemical processes controlling heterogeneous reaction as a circuit of separate resistances.
Gas Diffusion
Surface Accomodation
Surface Reaction
experiments and requires the development of new methods to interpret the oxidation of
complex morphologies.
1.5 Oleic acid: A model system to investigate morphological effects on chemical reactivity
Particle morphology plays an important role in influencing the reactivity once an
oxidant comes into contact with an aerosol particle, as has become evident in the case of the
reaction between oleic acid (C18H34O2) and ozone (O3). Oleic acid is a monounsaturated
carboxylic acid that is found in cooking oils, many types of meats, and is the primary
unsaturated species in olive oil. It is released to the atmosphere during meat cooking and has
been used as a chemical tracer for source apportionment of meat cooking aerosols.45-47 Oleic acid is a common urban pollutant, and accounts for approximately 10% of organic aerosol
measured in Pittsburgh in a recent study.48 In addition to its individual contribution to the primary aerosol burden, oleic acid has also become a benchmark compound to study
experimentally since it serves as a suitable proxy for larger lipid systems. Oleic acid’s double
bond is susceptible to attack by O3, and considerable experimental attention has been paid to
characterization of the products and kinetics of the reaction between oleic acid and O3, which has been recently summarized in a comprehensive review.49 Laboratory experiments measuring the rate of reaction of pure oleic acid and O3 estimate a lifetime of oleic acid in the
atmosphere on the order of seconds.50-53 Yet, oleic acid persists in the atmosphere and has been collected in particulate form, suggesting a lifetime on the order of days.12,45 This disparity is illustrated in Figure 1.4, which shows the particle size dependence of the
1.E-06 1.E-05 1.E-04 1.E-03 1.E-02 1.E-01 1.E+00 1.E+01 1.E+02 1.E+03
0.0001 0.001 0.01 0.1 1 10
Particle Diameter (µµµµm)
A tm o s p h e ri c L if e ti m e ( d a y s )
Figure 1.4. Estimated lifetime of pure oleic acid particles based on measured uptake coefficients. Estimates are shown based on values of g measured for condensed phase particles (blue line) and gas-phase oleic acid (red dashed line). Adapted from Robinson et al.67
Atmospheric observations of Oleic Acid
γ γ γ
γ = 10-3
γ γ γ
typical concentration in the atmosphere. Lifetime estimates are based on an uptake
coefficient of γ = 10-3, which is the average value determined from laboratory experiments, and compared to the lifetime estimated by the measured uptake coefficient for the
homogeneous reaction of oleic acid and O3, γ = 10-6. The estimated oleic acid lifetime in
ambient particles is also shown in Figure 1.4 as a reference.
One obvious simplification in unary phase experiments is the homogeneity of pure
oleic acid particles and films, and matrix effects within internally mixed ambient particles
have long been hypothesized to be responsible for the difference in reactivity between unary
phase and atmospheric oleic acid particles.51,53 Subsequent laboratory studies have investigated the reactivity of oleic acid in internally mixed particles containing other organic
acids expected to be released from meat cooking.54-58 The phase and morphology of these mixed fatty acid systems vary widely, and are dependent on the relative amounts of the
components. These studies have demonstrated the important role of morphology in the
reactivity of oleic acid particles, as well as some of the inherent difficulties associated with
even an incremental increase in morphological complexity in kinetic studies. The particle
morphology of the internally mixed fatty acid systems is highly dependent on the preparation
of particles, which can undergo supercooling57, and the preparation of films, which can influence the resulting crystal structure56. When the resulting morphology involves oleic acid being encased or trapped by a diffusional barrier of a solid fatty acid, the reactive uptake
coefficient of O3 has been shown to decrease by more than an order of magnitude. However, a recent smog chamber study does not show a clear trend in reactivity even going up to a 12
decreased relative to pure oleic acid based on the morphology, there still remains a gulf
between laboratory measurements and field observations that indicates the exploration of the
reactivity involving different particle morphologies is warranted.
In addition to self-aggregating, organic species are frequently found to be internally
mixed with inorganic particles of anthropogenic and biogenic origin that are prevalent in the
atmosphere, as mentioned previously. Internal mixtures of organic material with sulfate,
ammonium, sea salt, soot, and minerals have been measured.9,11,18,24,26,28,60,61 Solid particles such as soot and dust represent a large fraction of the available surface area in the boundary
layer on which low volatility organic species may condense. A recent report from the
ACE-Asia campaign observed that 6-50% of organic carbon incorporated within super-micron
particles was associated with dust particles.26 Importantly, the chemical composition of an aerosol core has been shown to affect the reactivity of an organic surfactant layer.62-66 One class of organic matter that is typically surface active is lower molecular weight (C14-C19)
fatty acids (LFAs), of which oleic acid is a member. Prevalent in the cell walls of most
organisms, LFAs generally derive from plant wax and microbes and have been found
extensively to form hydrophobic surfactant films in marine24,25 and continental aerosols26-28.
Despite the potential atmospheric relevance, few studies have examined the kinetics
of adsorbed oleic acid on solid inorganic particles. Katrib et al. coated oleic acid onto
polystyrene latex spheres (PSLs), and monitored the change in aerodynamic diameter and
recent study by McNeill et al. is the first to report kinetic information for a surfactant layer of
sodium oleate on an aqueous sea salt core.66
1.6 The Current Work
The goal of this work was to investigate the reaction between oleic acid and O3 on two different core particles: silica, which serves as an analog to mineral dust; and
polystyrene, which represents a hydrophobic surface like soot. The importance of size
dependence and porosity of the core particles was also investigated. Chapter 2 details the
development of techniques to deposit an adsorbed layer of oleic acid onto the core particles.
Chapter 3 discusses the characterization of the resulting coated particles. Chapter 4 reports
the results of flow tube studies employing single-particle mass spectrometry that were
conducted to carefully measure the reaction kinetics of a surfactant layer of oleic acid on
References
1. Seinfeld, J. H.; Pandis, S. N. Atmospheric Chemistry and Physics; Wiley Interscience: New York, 1998.
2. Finlayson-Pitts, B. J.; Pitts, J. N. Chemistry of the Upper and Lower Atmosphere: Theory, Experiments and Applications; Academic Press: New York, 2000. 3. Poschl, U. Atmospheric aerosols: Composition, transformation, climate and health
effects. Angewandte Chemie-International Edition 2005, 44 (46), 7520-7540.
4. Samet, J. M.; Dominici, F.; Curriero, F. C.; Coursac, I.; Zeger, S. L. Fine particulate air pollution and mortality in 20 US Cities, 1987-1994. New England Journal of Medicine 2000, 343 (24), 1742-1749.
5. Nel, A. Air pollution-related illness: effects of particles (vol 308, pg 804, 2005). Science 2005, 309 (5739), 1326.
6. Solomon, S.; D.Qin; M.Manning; Z.Chen; M.Marquis; K.B.Averyt; M.Tignor; and H.L.Miller (eds.) IPCC, 2007: Summary for Policymakers. In: Climate Change 2007: The Physical Science Basis. Contribution of Working
Group I to the Fourth Assessment Report of the Intergovernmental Panel on Climate Change; Cambridge University Press: 07.
7. Reid, P. J. Understanding the Phase-Dependent Reactivity of Chlorine Dioxide Using Resonance Raman Spectroscopy. 34 ed.; 2001; pp 691-698.
8. Molina, M. J.; Molina, L. T.; Kolb, C. E. Gas-phase and hetergeneous chemical kinetics of the troposphere and stratosphere. Ann. Rev. Phys. Chem. 1996, 47, 327-367.
9. Buseck, P. R.; Posfai, M. Airborne minerals and related aerosol particles: Effects on climate and the environment. Proceedings of the National Academy of Sciences of the United States of America 1999, 96 (7), 3372-3379.
10. Ravishankara, A. R.; Longfellow, C. A. Reactions on tropospheric condensed matter. Phys. Chem. Chem. Phys. 1999, 1, 5433-5441.
11. Lee, S.-H.; Murphy, D. M.; Thompson, D. S.; Middlebrook, A. M. Chemical
components of single particles measured with Particle Analysis by Laser Mass Spectrometry (PALMS) during the Atlanta SuperSite Project: Focus on
organic/sulfate, lead, soot, and mineral particles. J. Geophys. Res. 2002, 107, AAC 1-1.
13. Lim, H. J.; Turpin, B. J. Origins of primary and secondary organic aerosol in Atlanta: Results' of time-resolved measurements during the Atlanta supersite
experiment. Environmental Science & Technology 2002, 36 (21), 4489-4496.
14. Seinfeld, J. H.; Pankow, J. F. Organic Atmospheric Particulate Material. Ann. Rev. Phys. Chem. 2003, 54, 121-140.
15. Hamilton, J. F.; Webb, P. J.; Lewis, A. C.; Hopkins, J. R.; Smith, S.; Davy, P. Partially oxidised organic components in urban aerosol using GCXGC-TOF/MS. Atmospheric Chemistry and Physics 2004, 4, 1279-1290.
16. Vester, B. P.; Ebert, M.; Barnert, E. B.; Schneider, J.; Kandler, K.; Schutz, L.;
Weinbruch, S. Composition and mixing state of the urban background aerosol in the Rhein-Main area (Germany). Atmos. Environ. 2007, 41 (29), 6102-6115.
17. Worobiec, A.; Szaloki, I.; Osan, J.; Maenhaut, W.; Stefaniak, E. A.; Van Grieken, R. Characterisation of Amazon Basin aerosols at the individual particle level by X-ray microanalytical techniques. Atmos. Environ. 2007, 41 (39), 9217-9230.
18. Russell, L. M.; Maria, S. F.; Myneni, S. C. B. Mapping organic coatings on atmospheric particles. Geophys. Res. Lett. 2002, 29 (16).
19. Ellison, G. B.; Tuck, A. F.; Vaida, V. Atmospheric processing of organic aerosols. J. Geophys. Res. 1999, 104, 11633-11641.
20. Goss, K. U. The air/surface adsorption equilibrium of organic compounds under ambient conditions. Critical Reviews in Environmental Science and Technology 2004, 34 (4), 339-389.
21. Hinds, W. C. Aerosol Technology: Properties, Behavior, and Measurement of Airborne Particles; 2nd ed.; Wiley-Interscience: New York, 1999. 22. Takahama, S.; Gilardoni, S.; Russell, L. M.; Kilcoyne, A. L. D. Classification of
multiple types of organic carbon composition in atmospheric particles by scanning transmission X-ray microscopy analysis. Atmos. Environ. 2007, 41 (40), 9435-9451.
23. Maria, S. F.; Russell, L. M.; Gilles, M. K.; Myneni, S. C. B. Organic Aerosol Growth Mechanisms and Their Climate-Forcing Implications. Science 2004, 306 (5703), 1921-1924.
24. Tervahattu, H.; Juhanoja, J.; Kupiainen, K. Identification of an organic coating on marine aerosol particles by TOF-SIMS. Journal of Geophysical Research-Atmospheres 2002, 107 (D16).
organic films on sea-salt particles. Journal of Geophysical Research-Atmospheres 2002, 107 (D17).
26. Mochida, M.; Umemoto, N.; Kawamura, K.; Lim, H. J.; Turpin, B. J. Bimodal size distributions of various organic acids and fatty acids in the marine
atmosphere: Influence of anthropogenic aerosols, Asian dusts, and sea spray off the coast of East Asia. Journal of Geophysical Research-Atmospheres 2007, 112 (D15).
27. Graham, B.; Guyon, P.; Taylor, P. E.; Artaxo, P.; Maenhaut, W.; Glovsky, M. M.; Flagan, R. C.; Andreae, M. O. Organic compounds present in the natural Amazonian aerosol: Characterization by gas chromatography-mass spectrometry. Journal of Geophysical Research-Atmospheres 2003, 108 (D24).
28. Tervahattu, H.; Juhanoja, J.; Vaida, V.; Tuck, A. F.; Niemi, J. V.; Kupiainen, K.; Kulmala, M.; Vehkamaki, H. Fatty acids on continental sulfate aerosol particles. Journal of Geophysical Research-Atmospheres 2005, 110 (D6).
29. Rudich, Y.; Benjamin, I.; Naaman, R.; Thomas, E.; Trakhtenberg, S.; Ussyshkin, R. Wetting of hydrophobic organic surfaces and its implications to organic aerosols in the atmosphere. J. Phys. Chem. A 2000, 104 (22), 5238-5245.
30. Donaldson, D. J.; Vaida, V. The influence of organic films at the air-aqueous boundary on atmospheric processes. Chem. Rev. 2006, 106 (4), 1445-1461.
31. McNeill, V. F.; Patterson, J.; Wolfe, G. M.; Thornton, J. A. The effect of varying levels of surfactant on the reactive uptake of N2O5 to aqueous aerosol. Atmospheric Chemistry and Physics 2006, 6, 1635-1644.
32. Smoydzin, L.; von Glasow, R. Do organic surface films on sea salt aerosols influence atmospheric chemistry? a model study. Atmospheric Chemistry and Physics 2007, 7 (21), 5555-5567.
33. Williams, J. Organic Trace Gases in the Atmosphere: An Overview. Environmental Chemistry 2004, 1, 125-136.
35. Asad, A.; Mmereki, B. T.; Donaldson, D. J. Enhanced uptake of water by oxidatively processed oleic acid. Atmospheric Chemistry and Physics 2004, 4, 2083-2089.
36. Voss, L. F.; Bazerbashi, M. F.; Beekman, C. P.; Hadad, C. M.; Allen, H. C. Oxidation of oleic acid at air/liquid interfaces. Journal of Geophysical
Research-Atmospheres 2007, 112 (D6).
37. Shilling, J. E.; King, S. M.; Mochida, M.; Martin, S. T. Mass spectral evidence that small changes in composition caused by oxidative aging processes alter aerosol CCN properties. J. Phys. Chem. A 2007, 111 (17), 3358-3368.
38. Taraniuk, I.; Graber, E. R.; Kostinski, A.; Rudich, Y. Surfactant properties of atmospheric and model humic-like substances (HULIS). Geophys. Res. Lett. 2007, 34 (16).
39. Kanakidou, M.; Seinfeld, J. H.; Pandis, S. N.; Barnes, I.; Dentener, F. J.; Facchini, M. C.; van Dingenen, R.; Ervens, B.; Nenes, A.; Nielsen, C. J.; Swietlicki, E.; Putaud, J. P.; Balkanski, Y.; Fuzzi, S.; Horth, J.; Moortgat, G. K.;
Winterhalter, R.; Myrhe, C. E. L.; Tsigaridis, K.; Vignati, E.; Stephanou, E. G.; Wilson, J. Organic aerosol and global climate modeling: A review. Atmos. Chem. Phys. 2005, 5, 1053-1123.
40. Roelofs, G. J. A GCM study of organic matter in marine aerosol and its potential contribution to cloud drop activation. Atmospheric Chemistry and Physics 2008, 8 (3), 709-719.
41. Kwan, A. J.; Crounse, J. D.; Clarke, A. D.; Shinozuka, Y.; Anderson, B. E.;
Crawford, J. H.; Avery, M. A.; McNaughton, C. S.; Brune, W. H.; Singh, H. B.; Wennberg, P. O. On the flux of oxygenated volatile organic compounds from organic aerosol oxidation. Geophys. Res. Lett. 2006, 33 (15).
42. Katrib, Y.; Martin, S. T.; Hung, H. M.; Rudich, Y.; Zhang, H.; Slowik, J. G.; Davidovits, P.; Jayne, J. T.; Worsnop, D. R. Products and Mechanisms of Ozone Reactions with Oleic Acid for Aerosol Particles Having Core-Shell Morphologies. J. Phys. Chem. A 2004, 108, 6686-6695.
43. Hanson, D. R.; Ravishankara, A. R.; Solomon, S. Heterogeneous reactions in sulfuric acid aerosols: A framework for model calculations. J. Geophys. Res. 1994, 99 (D2), 3615-3629.
44. Rudich, Y.; Donahue, N. M.; Mentel, T. F. Aging of organic aerosol: Bridging the gap between laboratory and field studies. Ann. Rev. Phys. Chem. 2007, 58, 321-352.
46. Schauer, J. J.; Rogge, W. F.; Hildemann, L. M.; Mazurek, M. A.; Cass, G. R.; Simoneit, B. R. T. Source Apportionment of Airborne Particulate Matter Using Organic Compounds as Tracers. Atmos. Environ. 1995, 30 (22), 3837-3855.
47. He, L. Y.; Hu, M.; Huang, X. F.; Yu, B. D.; Zhang, Y. H.; Liu, D. Q. Measurement of emissions of fine particulate organic matter from Chinese cooking. Atmos. Environ. 2004, 38 (38), 6557-6564.
48. Robinson, A. L.; Subramanian, R.; Donahue, N. M.; Bernardo-Bricker, A.; Rogge, W. F. Source apportionment of molecular markers and organic aerosol. 3. Food cooking emissions. Environmental Science & Technology 2006, 40 (24), 7820-7827.
49. Zahardis, J.; Petrucci, G. A. The oleic acid-ozone heterogeneous reaction system: products, kinetics, secondary chemistry, and atmospheric implications of a model system - a review. Atmospheric Chemistry and Physics 2007, 7, 1237-1274.
50. Moise, T.; Rudich, Y. Reactive Uptake of Ozone by Aerosol-Associated Unsaturated Fatty Acids: Kinetics, Mechanism, and Products. J. Phys. Chem. A 2002, 106, 6469-6476.
51. Thornberry, T. D.; Abbatt, J. P. D. Heterogeneous reaction of ozone with liquid unsaturated fatty acids: detailed kinetics and gas-phase product studies. Phys. Chem. Chem. Phys. 2004, 6, 84-93.
52. Smith, G. D.; Woods III, E.; Hauser, C.; Miller, R. E.; Baer, T. Reactive uptake of ozone by oleic acid aerosol particles: Application of single particle mass spectrometry to heterogeneous reaction kinetics. J. Phys. Chem. A 2002, 106, 8085-8095.
53. Morris, J. W.; Davidovits, P.; Jayne, J. T.; Shi, Q.; Kolb, C. E.; Worsnop, D. R.; Barney, W. S.; Jimenez, J.; Cass, G. R. Kinetics of submicron oleic acid aerosols with ozone; a novel aerosol mass spectrometric technique. Geophys. Res. Lett. 2002, 29, 71-1-71/4.
54. Nash, D. G.; Tolocka, M. P.; Baer, T. The uptake of O3 by myristic acid-oleic acid mixed particles: evidence for solid surface layers. Phys. Chem. Chem. Phys. 2006, 8, 4468-4475.
56. Knopf, D. A.; Anthony, L. M.; Bertram, A. K. Reactive Uptake of O3 by
Multicomponent and Multiphase Mixtures Containing Oleic Acid. J. Phys. Chem. A 2006, 109 (25), 5579-5589.
57. Hearn, J. D.; Smith, G. D. Measuring Rates of Reaction in Supercooled Organic Particles with Implications for Atmospheric Aerosol. Phys. Chem. Chem. Phys. 2005, 7 (13), 2549-2551.
58. Hearn, J. D.; Smith, G. A. Ozonolysis of mixed oleic acid/n-docosane particles: The roles of phase, morphology, and metastable states. J. Phys. Chem. A 2007, 111 (43), 11059-11065.
59. Hartz, K. E. H.; Weitkamp, E. A.; Sage, A. M.; Donahue, N. M.; Robinson, A. L. Laboratory measurements of the oxidation kinetics of organic aerosol mixtures using a relative rate constants approach. Journal of Geophysical Research-Atmospheres 2007, 112 (D4).
60. Hinz, K.-P.; Trimborn, A.; Weingartner, E.; Henning, S.; Baltensperger, U.; Spengler, B. Aerosol single particle composition at the Jungfraujoch. J. Aerosol Sci. 2005, 36, 123-145.
61. Falkovich, A. H.; Schkolnik, G.; Ganor, E.; Rudich, Y. Adsorption of organic compounds pertinent to urban environments onto mineral dust particles. Journal of Geophysical Research-Atmospheres 2004, 109 (D2).
62. Poschl, U.; Letzel, T.; Schauer, C.; Niessner, R. Interaction of ozone and water vapor with spark discharge soot aerosol particles coated with benzo[a]pyrene: O3 and H2O adsorption, benzo[a]pyrene degradation, and atmospheric
implications. J. Phys. Chem. A 2001, 105 (16), 4029-4041.
63. Mmereki, B. T.; Donaldson, D. J. Direct observation of the kinetics of an atmospherically important reaction at the air-aqueous interface. J. Phys. Chem. A 2003, 107, 11038-11042.
64. Kwamena, N. O. A.; Thornton, J. A.; Abbatt, J. P. D. Kinetics of surface-bound benzo[a]pyrene and ozone on solid organic and salt aerosols. J. Phys. Chem. A 2004, 108 (52), 11626-11634.
65. Kwamena, N. O. A.; Staikova, M. G.; Donaldson, D. J.; George, I. J.; Abbatt, J. P. D. Role of the aerosol substrate in the heterogeneous ozonation reactions of surface-bound PAHs. J. Phys. Chem. A 2007, 111 (43), 11050-11058.
CHAPTER 2
DESIGN AND THEORY OF A NEW CONDENSATION OVEN
2.1 Introduction
This chapter focuses on the development of methods to adsorb oleic acid onto two
different types of solid particles: silica, and polystyrene latex. First, the nature of these two
particle types will be discussed. The design and development of a new condensation oven
will be detailed. Finally, the theory of condensation of a gas onto a condensed phase particle
will be addressed.
2.2 Core types and properties
2.2.1 Silica as a proxy for mineral dust
Mineral dust comprises a significant portion of the atmospheric aerosol burden, as
mentioned in Chapter 1. The mineral structure, or mineralogy, of the dust particles is highly
variable, and influences ability of a particle to take up gases such as water vapor.1 The
chemical composition of mineral dust is similarly variable depending on source2, but its
primary component is silica (SiO2).3 Silica has been selected as a proxy for mineral dust in
heterogeneous chemistry on mineral dust.4-11
Silica surfaces possess terminal silanol OH groups that are mildly acidic and can
promote chemistry, creating a hydrophilic surface for the uptake of gases. Silanol groups
serve as adsorption sites for organic vapors12, and in the case of carboxylic acid head groups,
such as the one possessed by oleic acid, this adsorption is due to hydrogen bonding with the
silanol groups.13,14
Dust aerosols entrained in air by wind-driven soil range in size across the standard
aerosol classes of nuclei (0.005-0.1 µm), accumulation (0.1-2.5 µm), and coarse (>2.5 µm)
modes. Supermicron silica particles have been used in this work since particles of this size
represent most of the mass in the atmosphere and are more readily investigated with the UNC
Aerosol Time-of-Flight Mass Spectrometer (ATOFMS). In addition to solid silica spheres,
porous silica particles have also been investigated to mimic the voids created on certain types
of mineral particles due to wind erosion.3
2.2.2 Polystyrene latex as a proxy for hydrophobic soot-like particles
Soot is the result of incomplete hydrocarbon combustion and, like mineral dust, is
ubiquitous in the atmosphere. Soot is comprised of agglomerated graphene carbon sheets.
and van der Waals forces involving
π
-
π
bonds between unsaturated organics and the sootsurface.15 The uptake of small dicarboxylic acids on soot surfaces has been shown to be on
the same order as monocarboxylic acids, indicating that carboxylic acid groups can also bind
directly to soot surfaces.16
Soot particles are highly fractal, which makes their passage through a fluid such as air
highly non-ideal. This non-ideality serves to severely reduce the transmission of soot
particles into high vacuum instruments like the ATOFMS. As a result, polystyrene latex
spheres (PSLs) have been used in this study as a proxy for the hydrophobic surface of soot
particles. PSLs are highly ordered like soot, and are made of interlocking styrene monomer
units. They can be fabricated in a large range of sizes and serve as standardized spherical
aerosols used for testing. PSL particles matching the silica particle diameters used have been
selected to provide a direct comparison between the two types of surfaces.
2.2.3 Properties of the core particles
The core particles investigated were 1.6 and 3 µm diameter PSL spheres (Duke
Scientific), 1.6 µm diameter silica spheres (Duke Scientific), and 3 µm diameter highly
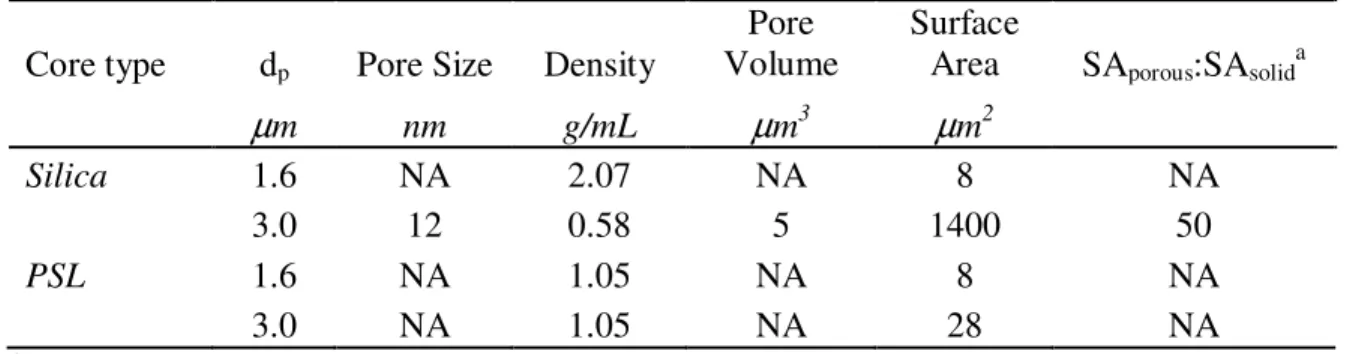
porous silica spheres (Supelcosil, Supelco). The physical properties of the core particles are
summarized in Table 2.1. As is evident from Table 2.1, the porosity of the 3 µm diameter
µm diameter silica sphere.
Table 2.1 - Relevant parameters of core particles
Core type dp Pore Size Density
Pore Volume
Surface
Area SAporous:SAsolida
µm nm g/mL µm3 µm2
Silica 1.6 NA 2.07 NA 8 NA
3.0 12 0.58 5 1400 50
PSL 1.6 NA 1.05 NA 8 NA
3.0 NA 1.05 NA 28 NA
a SA = Surface Area
2.3 Design and development of the coating oven
Techniques to create internally mixed, coated particles include direct atomization of a
mixed solution or controlled condensation of a vapor onto a particle surface. Although the
latter method is more experimentally demanding, it also more closely mimics mechanisms by
which internally mixed particles are created in the atmosphere and for this reason was
selected as the method of creating an adsorbed layer of oleic acid onto the core particles.
Previous experimental efforts by the Baer group generated internally mixed ethylene
glycol/oleic acid aerosols using a “pick-up” cell.17 Mixed particles were created by
introducing liquid glycerol droplets into a glass bulb containing a saturated vapor of oleic
acid, which condensed into a film on the surface of the ethylene glycol. The motivation for
this earlier study was to assess the ability of a two-step laser desorption/ionization process to
thicknesses was not essential. However, analyzing the kinetics of an adsorbed layer requires
accurate estimates of the amount of material in the adsorbed layer. Early attempts to adopt
the pick-up cell methodology to the present work were not successful. Turbulence in the
pick-up cell resulted in varied residence times for the silica particles, and coating thicknesses
were impossible to control. As a result, it became necessary to design and build a new,
well-characterized oven that could create internally mixed particles in a repeatable manner.
The design of the oven was inspired by the work of Han et al.18 and consisted of a 1.9
cm o.d., 33 cm long stainless steel tube encased in a solid aluminum block. Four cartridge
heaters (Watlow, Model C2A4) powered by a temperature controller (Watlow, Series 989)
regulated the temperature of the oven. This design is similar to several others that have
emerged recently with increasing awareness of the need to characterize properties of
internally mixed particles.19-21 Adsorption of oleic acid onto the core particles occurs as a
flow of atomized core particles passes through the coating oven, containing a pool of liquid
oleic acid along the length of the tube. The amount of adsorption onto the core particles was
controlled by two key parameters:
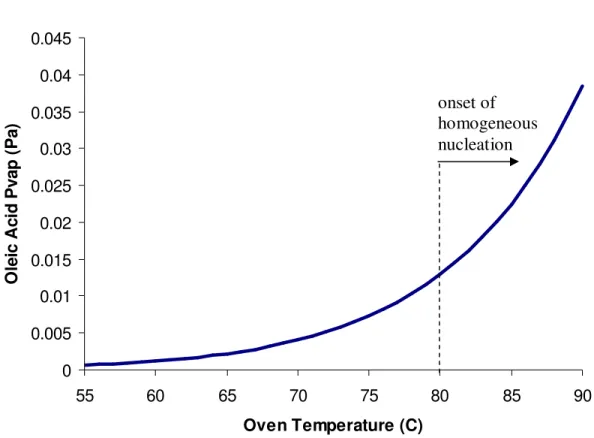
1. Oven Temperature – The oven temperature controlled the saturated vapor
pressure, and the resulting concentration, of oleic acid within the tube. This
dependence is shown in Figure 2.1, based on the work of Tang et al.22 An upper
0 0.005 0.01 0.015 0.02 0.025 0.03 0.035 0.04 0.045
55 60 65 70 75 80 85 90
Oven Temperature (C)
O
le
ic
A
c
id
P
v
a
p
(
P
a
)
Figure 2.1. Vapor pressure of oleic acid as a function of oven temperature. Velocimetry indicates that detectable homogeneously nucleated oleic acid particles begin to form at approximately 80°C.
of homogeneously nucleated oleic acid particles.
2. Aerosol Flow Rate – The residence time of the core particles in the oven is
controlled by the flow rate through the oven. In order to ensure predictable
residence times for all particles through the coating oven, the aerosol flow rate
was kept sufficiently low that the flow was laminar. The velocity profile of a
well-developed laminar flow is parabolic:
− = 2 1 R r v
v o (2.1)
where vo is the maximum velocity determined by the set aerosol flow rate, r is the
radial distance from the centerline, and R is the radius of the tube. The average
flow rate is v =vo /2, and the resulting average residence time in the oven, of
length L, is then τavg =L/v.
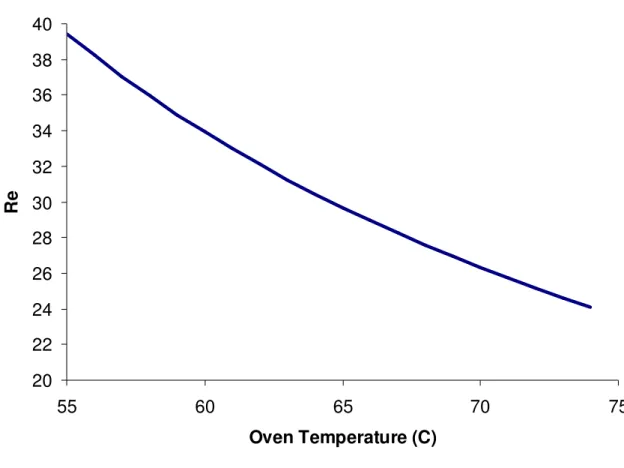
23 Determining the flow conditions requires the
calculation of the Reynolds number (Re) for the flow conditions:
µ ρVd =
Re (2.2)
where ρ is the density of the carrier gas, V is the velocity of the gas, d is the tube
diameter, and µ is the gas viscosity which is temperature dependent. The
condition for laminar flow requires Re < 1500. As shown in Figure 2.2 these
conditions are met for an aerosol flow of 1.3 liters per minute (lpm) over the
20 22 24 26 28 30 32 34 36 38 40
55 60 65 70 75
Oven Temperature (C)
R
e
Operationally, it was much more convenient to alter the oven temperature than to
alter the flow rate. The Constant Output Atomizer (TSI Inc., Model 3076) used to aerosolize
the core particles required at least a 1.0 lpm flow rate of air to atomize particles, and efforts
to reduce this flow rate by pumping off part of the flow prior to the coating oven invariably
reduced the particle concentration and were unworkable. As such, a flow rate of
approximately 1.3 lpm was used throughout these experiments, corresponding to an average
aerosol residence time of approximately 20 seconds in the oven. At this flow rate, no
additional dilution flow was necessary in order to operate the ATOFMS, which draws 0.3
lpm through its inlet, and an external particle sizer, requiring a simultaneous flow of 1.0 lpm.
A computational fluid dynamics model of the coating oven and the associated inlet
connections was created using the FLUENT software package. Figure 2.3 shows the velocity
profile of the flow through the coating oven. The flow is clearly laminar, with well-defined
streamlines. Figure 2.4 shows the temperature profile of the oven.
2.4 Prediction of coating mass by condensation theory
2.4.1 Condensation to a solid sphere: Evaluating the mass transfer regime
The phenomena controlling mass transfer of a gas to a particle surface depend on the
size of the particle relative to the mean free path of the gas. For small particles, mass transfer
Figure 2.3. Velocity contours in the coating oven calculated by FLUENT. Units are meters per second. Conditions are based on a flow rate of 1.3 lpm and an oven wall temperature of 68°C.
Figure 2.4. Temperature contours in the coating oven calculated by FLUENT. Units are degrees Kelvin. Conditions are based on a flow rate of 1.3 lpm and an oven wall temperature of 341 K. The computational fluid dynamics model included the heated section of the oven, as well as associated tubing. The location of the heated section of the coating oven is noted.
heated section
to particles sufficiently larger than the mean free path of the condensing gas is controlled by
diffusion. The mass transfer regime is evaluated by the Knudsen number24:
d
Kn=2λ (2.3)
where λ is the gas mean free path and d is the particle diameter. The mean free path is
defined as the quotient of the binary diffusion coefficient of the condensing vapor in air, DAB,
and the molecular speed of the gas, c, allowing the Knudsen number to be re-expressed as:
c d D
Kn= 2 AB (2.4)
The diffusion coefficient for the binary mixture of oleic acid vapor and nitrogen, as a proxy
for air, has been calculated here using Chapman-Enskog theory25. For an ideal gas mixture,
the binary diffusion coefficient can be expressed in units of cm2 s-1 according to:
AB AB AB AB PM T D Ω = 1/2 2
2 / 3 00266 . 0 σ (2.5)
where P represents the total pressure of the system, MAB represents the reduced mass of the
system, and σAB represents the mean collision diameter of the two species. The collision
integral, encapsulating intermolecular interactions, is represented by ΩAB and is dependent on
the binary Lennard-Jones energy εAB. These parameters can be derived from literature values
reported for nitrogen and oleic acid acid according to:
2 / 1 ) ( A B
AB ε ε
ε = (2.7)
2 B A AB σ σ
σ = + (2.8)
An analytical approximation for ΩAB, based on the 12-6 Lennard-Jones potential, has been
used here25:
+ + + = Ω AB AB AB AB AB kT kT kT kT ε ε ε
ε exp 3.89411
76474 . 1 52996 . 1 exp 03587 . 1 exp 19300 . 0 06036 . 1 15610 . 0 (2.9)
The binary parameters derived for this work based on the expressions above and tabulated
values for homogeneous parameters25,26 are shown in Table 2.2. The calculated binary
parameter have been used to evaluate DAB.
Table 2.2 – Derived parameters used to calculate DAB
Calculated Binary Value
Nitrogen Oleic Acid for Nitrogen/Oleic Acid
M (g/mol) 28.01 282.46 50.97
ε (K) 71.4 25 729.0 26 228.1
σ (Å) 3.798 25 9.551 26 6.675
Based on the values for DAB, the Knudsen number for each core particle size was calculated
over the range of oven temperatures used. The resulting values for the Knudsen number (Kn
= 0.05 - 0.1) indicate that the mass transport of oleic acid to the core particles is on the cusp
of the continuum regime and the transition regime, wherein corrective factors are applied to
motion.
2.4.2 Condensation to a solid sphere: Estimating the rate of collisions
In the continuum regime the flux of gaseous molecules to a surface is determined by
the diffusion, and the rate of collisions of vapor molecules with a particle surface is
expressed as27:
oleic d d p AB oleic p AB z T p T p k d D N d D n − = = ∞ ∞ π π 2 2 (2.10)
where the net concentration of oleic acid vapor, N, is expressed in terms of the partial
pressure p¶ and temperature T¶ of oleic acid away from the particle surface and the partial
pressure pd and temperature Td at the particle surface. The pressure over a curved surface is
given by the Kelvin equation but is dependent on the particle surface temperature, which can
be elevated due to the release of latent heat of vaporization during the condensation process.
The uncertainty of the particle temperature makes calculation of the p¶/T¶ term difficult, but
given the extremely low volatility of oleic acid this term is likely to be small and has been
neglected, effectively assuming that oleic acid adsorbed to the surface does not re-evaporate.
The suitability of this assumption will be addressed later. Neglecting the p¶/T¶ term of
Equation 2.6, the reformulated expression for the flux of oleic acid to the particle surface is:
oven oleic p AB z kT p d D
n =2π (2.11)
regime, a corrective term φ has been used to account for deviations to the continuum regime
solution. The formulation for φ proposed by Fuchs and Sutugin is28:
α φ / ) 1 ( 33 . 1 773 . 0 1 1 Kn Kn Kn Kn + + + + = (2.11)
where α is the accommodation coefficient representing the likelihood that a gas phase
molecule sticks to the surface upon collision. The final estimate for the total number of
adsorbed oleic acid molecules on a solid core particle surface is then:
avg z adsorbed n
N = φτ (2.12)
Predictions of the amount of oleic acid adsorbed to a spherical 3µm sphere based on
Equation 2.12 are shown in Figure 2.5. Evident from these predictions is the influence that
the “stickiness” of the interaction between oleic acid and the surface, encapsulated by α, has
on determining the volume of oleic acid adsorbed. The magnitude of α has not been
measured before for oleic acid adsorbing on either silica or soot surfaces, so α has been used
as a fitting parameter in the characterization of the coated particles as will be discussed in
Chapter 3.
2.4.3 Condensation to a porous sphere: Capillary condensation and confinement
The presence of a porous network was expected to increase the total amount of
0 1 2 3 4 5 6 0.0 0.2 0.4 0.6 0.8 1.0 A d s o rb e d V o lu m e o f O le ic A c id ( µ m 3 )
Oleic Acid Vapor Pressure (Pa x 103)
α = 1.0
α = 0.8
α = 0.6
α = 0.4
α = 0.2
0 2 4 6 8 10 12 14 A d s o rb e d M o n o la y e rs
available for adsorption of a gas on a porous particle, as highlighted in Table 1, the presence
of pores also provides an enthalpic advantage to condensation. The negative radius of the
meniscus that forms in the constriction of a pore allows condensation to occur at a vapor
pressure lower than on a surface, as defined by the Kelvin equation:
RT d
M p
p
pore o
ρ σ 4
ln =−
(2.11)
where σ is the surface tension within the pore, M is the molar mass of the condensing gas, ρ
is the density, and dpore is the pore diameter. Hence, as the pore diameter decreases, the vapor
pressure required to initiate condensation decreases. The dependence of condensation on the
pore diameter and shape has been demonstrated theoretically29,30 and experimentally31,32. An
example of the enhancement in condensation afforded by a porous network relative to a
non-porous substrate is pictured in Figure 2.6 for the case of n-hexane condensation on
mesoporous (3-10 nm) siliceous particles.31
Confinement of oleic acid within the pores of a silica particle was also hypothesized
to alter the adsorption energetics and orientation of oleic acid, which was believed to be
capable of changing the reactivity of O3 with oleic acid in the pore space. Confinement
effects within the pores have been shown to influence the enthalpies of adsorption32 and the
Figure 2.6.Adsorption isotherms of n-hexane onto porous silica substrates of different pore
diameters and non-porous silica. Adsorption in the pores occurs at lower vapor pressures
with decreasing pore diameter, as evidenced by the break points in the isotherms. For all pore sizes, the enhancement in the amount of n-hexane adsorbed to the porous substrates relative to non-porous silica is evident. From Trens et al.31 Reproduced by permission of The Royal Society of Chemistry on behalf of the Centre National de la Recherche Scientifique.
d
p=38 Å
d
p=53 Å
d
p=93 Å
Non-porous
silica
d
p=30 Å
2.5 Conclusion
A new coating oven has been designed and built to control condensational growth of
oleic acid onto solid core particles. Key design parameters of the oven such as flow rate and
oven temperature have been modeled using a computational fluid dynamics to fully
characterize the performance of the oven. Condensation theory was used to develop
predictions for the amount of oleic acid deposited onto core particle surfaces during passage
through the oven. Comparison between these predictions and analytical measurements of the