EXPLORING RNA AND PROTEIN 3D STRUCTURES BY GEOMETRIC ALGORITHMS
Xueyi Wang
A dissertation submitted to the faculty of the University of North Carolina at Chapel Hill in partial fulfillment of the requirements for the degree of Doctor of Philosophy in the Department of Computer Science.
Chapel Hill 2008
ABSTRACT
XUEYI WANG: Exploring RNA and Protein 3D Structures by Geometric Algorithms (Under the direction of Jack Snoeyink)
Many problems in RNA and protein structures are related with their specific geometric properties. Geometric algorithms can be used to explore the possible solutions of these problems. This dissertation investigates the geometric properties of RNA and protein structures and explores three different ways that geometric algorithms can help to the study of the structures.
Determine accurate structures. Accurate details in RNA structures are important for understanding RNA function, but the backbone conformation is difficult to determine and most existing RNA structures show serious steric clashes (≥ 0.4 Å overlap). I developed a program called RNABC (RNA Backbone Correction) that searches for alternative clash-free conformations with acceptable geometry. It rebuilds a suite (unit from sugar to sugar) by anchoring phosphorus and base positions, which are clearest in crystallographic electron density, and reconstructing other atoms using forward kinematics and conjugate gradient methods. Two tests show that RNABC improves backbone conformations for most problem suites in S-motifs and for many of the worst problem suites identified by members of the Richardson lab.
iv
weighted RMSD (wRMSD) for multiple structures and show that using wRMSD with multiplicative weights implies the average is a consensus structure. Although I show that finding the optimal translations and rotations for minimizing wRMSD cannot be decoupled for multiple structures, I develop a near-linear iterative algorithm to converge to a local minimum of wRMSD. Finally I propose a heuristic algorithm to iteratively reassign weights to reduce the effect of outliers and find well-aligned positions that determine structurally conserved regions.
ACKNOWLEDGEMENTS
I am in debt to my advisor Professor Jack Snoeyink, who kindly guides me through the five great years at UNC Chapel Hill, who shows great love, thoughtfulness, integrity, scrupulousness and inspiration to me, and whom I always respect and admire.
I am also in debt to my collaborators Professors Jane & David Richardson, whose earnest, passionate, encouraging, assiduous and cheerful attitudes I will benefit in my life, and Professor Wei Wang, whose amiable, sincere and diligent attitudes I will learn always.
I would like to express my appreciation to my committee members Professors Alexander Tropsha, Jan Prins and Nikolay Dokholyan, whose encouragement, creative- and critical-thinking have been a great benefit to me.
I would like to thank my other collaborators, Michael Word, Andrew Leaver-Fay, Jun Huan, Yuanxin Liu, Gary Kapral, Laura Murray, Ian Davis, and Kevin Weeks, for their selfless contributions and genuine help.
I also would like to give sincere thanks to my friends Bryan Arendall, Deepak Bandyopadhyay, Jeff Headd, Bob Immormino, Dan Keedy, Lizbeth Videau, Liangjun Zhang, and Qi Zhang for all kinds of help in my research and dissertation writing.
vi
TABLE OF CONTENTS
ABSTRACT ... iii
ACKNOWLEDGEMENTS ... v
LIST OF TABLES ... ix
LIST OF FIGURES ... x
Chapter 1 Introduction ... 1
1.1 RNA and Protein Molecules ... 1
1.2 Geometric Algorithms for RNA and Protein Structures ... 2
Chapter 2 RNA and Protein Structures ... 7
2.1 Biochemical Properties ... 7
2.1.1 Atom and Chemical Bond ... 7
2.1.2 Protein ... 8
2.1.3 RNA ... 10
2.2 Structure Determination ... 13
2.3 All-Atom Contact Analysis for Structure Validation ... 15
Chapter 3 Reducing Steric clashes in RNA Backbone ... 17
3.1 Introduction ... 17
3.2 Method ... 22
3.2.1 Description of the Method ... 23
3.3 Results and Discussion ... 38
3.3.1 Running Time Performance ... 38
3.3.2 Methods for the Practical Tests ... 40
Chapter 4 Optimizing Multiple Structure Alignment ... 49
4.1 Introduction ... 49
4.2 Methods ... 51
4.2.1 Weighted Root Mean Square Deviation ... 51
4.2.2 Rotation and Translation to Minimize wRMSD ... 55
4.3 Results and Discussion ... 59
4.3.1 Performance ... 59
4.3.2 Finding Structural Conserved Regions ... 62
Chapter 5 Mining RNA Tertiary Motifs ... 68
5.1 Introduction ... 68
5.2 Related Work ... 70
5.3 Algorithms for Mining RNA Tertiary Motifs ... 71
5.3.1 Labeled Graphs and Frequent Subgraph Mining Algorithms ... 71
5.3.2 Graph Modeling of RNA Molecules ... 73
5.3.3 Constructing Consensus Motifs with Computational Geometry ... 74
5.4 Experiments ... 76
5.4.1 Data Sets ... 76
5.4.2 Identifying Tertiary Motifs ... 77
5.4.3 Consensus Motifs ... 81
viii
LIST OF TABLES
Table 2.1 Typical ranges of 6 nucleotide backbone dihedral angles [Murray03] ... 12
Table 3.1 Parameters often specified by RNABC users ... 33
Table 3.2 Comparison of total and allowed positions of backbone atoms found for suite 77-78 of chain 9, rr0082/1S72 ... 36
Table 3.3 Comparison of running time for three clash types in tr0002/1EVV for current and preliminary RNABC versions ... 39
Table 3.4 Performance on removing steric clashes and bad geometry for the 101 S-motifs . 43 Table 3.5 Command lines at successive trial levels for test two ... 45
Table 3.6 Corrections: Instances of three categories of problems in the original structures for 72 suites, and how many were fixed, improved, unchanged, or worsened by RNABC ... 46
Table 4.1 Performance of the algorithm on different protein families from HOMSTRAD ... 60
Table 4.2 Comparison of RMSD of aligned protein families from CE-MC, MAMMOTH-mult, and Superpose programs and optimized wRMSD from algorithm 4.1 ... 63
Table 4.3 wRMSD before and after optimizing conserved regions for sdr and proteasome families ... 66
Table 5.1List of selected tRNAs and rRNAs ... 77
Table 5.2 Ribose zippers found in 23s rRNA 1s72 ... 79
x
LIST OF FIGURES
Figure 1.1 Examples of protein catalysis and protein-protein interaction ... 3
Figure 1.2 Models of yeast aspartyl-tRNA synthetase ... 4
Figure 2.1 A sequence of three amino acids joined by peptide bonds, showing amino, carboxyl and R groups attaching to the α-carbons ... 9
Figure 2.2 Bond lengths, angles and dihedral angles in the amino acids ... 9
Figure 2.3 A fragment of RNA structure with four nucleotides: A, C, G and U. Each nucleotide has three components: phosphate, sugar and base ... 11
Figure 2.4 Bond lengths, angles and dihedral angles in a nucleotide ... 11
Figure 2.5 C2’-endo and C3’-endo conformations ... 12
Figure 2.6 The procedures of X-ray crystallography to determine RNA/protein structure ... 13
Figure 2.7 A diagram of the small-probe contact dot algorithm ... 15
Figure 3.1 Selected all-atom-contacts in tr0002/1EVV (yeast phenylalanine tRNA [Jovine00]) at 2.0Å resolution (residues 28-32 and 40-44) ... 18
Figure 3.2 Contoured electron density maps and atomic models for the same piece of ribosomal RNA structure (part of the “sarcin loop”) solved at quite different resolutions .... 18
Figure 3.3 Atom labeling and nomenclature for reconstructing a suite within a dinucleotide span ... 22
Figure 3.4 Examples of removing small steric clashes by geometry method ... 37
Figure 3.5 S-motif 587-589 in rr0082/1S72 ... 42
Figure 3.6 Suite 76-77 of chain 9, rr0082/1S72 before and after reconstruction ... 44
Figure 3.7 pr0032/1FFY suite 33-34 before and after refit by RNABC ... 47
Figure 3.8 rr0082/1S72 suite 1941-1942 refit ... 48
Figure 4.1 Example of aligning three structures with gaps ... 56
Figure 4.2 Convergence of wRMSD for 23 protein families ... 61
Figure 4.4 Alignment of short-chain dehydrogenases/reductases (sdr) and proteasome families before and after optimizing the structural conserved regions ... 66 Figure 4.5 The distribution of ak ... 67
Figure 5.1 A database GD of three labeled graphs ... 72 Figure 5.2 All frequent connected subgraphs from G in Figure 5.1 with support threshold
σ = 100% ... 73
CHAPTER 1
INTRODUCTION
Computational geometry studies the design and analysis of algorithms for problems that are best stated in geometric form. The applications of geometric algorithms include computer graphics, computer-aided design and manufacturing, robotics, geographic information systems (GIS), and computational biology. The challenges for designing a geometric algorithm include how to represent a problem in terms of geometry, how to correctly obtain related geometric properties from the problem, and how to effectively build an algorithm to solve the problem by exploring its geometric properties.
This dissertation focuses on using geometric algorithms to solve problems in RNA and protein structures. I present three works that abstract geometric properties of RNA and protein structures at different scales. In the following subsections, I first introduce the RNA and protein molecules and then discuss applications of geometric algorithms in RNA and protein structures.
1.1 RNA and Protein Molecules
cell shape [Faux96, Shih06], stores and transports ions and other molecules [Weber01, Long05], decodes and transmits genetic information [Latchman97, Dame05], and plays other important roles such as cell signaling [Lin04, Mohamed05], immune responses [Roux99, Diaz02], cell adhesion [White97, Wilson01], and the cell cycle [Nigg95, Bates98].
RNA also plays many important roles in organisms, with new ones being discovered constantly [Soukup04, Nielson05, Salehi-Ashtiani06]. RNA stores and transmits genetic information [Crick70, Sussman76, Lolle05], provides and regulates molecular-binding interactions [Huang03, Lukavsky03, Mattick01], maintains chromosome length [Chen04], controls metabolic processes [Winkler02, Serganov06], and catalyzes chemical reactions [Nissen00, Lilley05, Klein06]. RNA plays a central role in all aspects of gene expression and its control [Claverie05], such as performing and regulating RNA interference [Tomari05], co-suppression and silencing [Mattick01], and especially splicing and alternative splicing of exons [Nilsen94, Murray99, Stahley05].
1.2 Geometric Algorithms for RNA and Protein Structures
from breaking down other proteins [Conners07]
a.
catalyzing alcohols to aldehydes/ketones (black colored i
sidechain, red is
RNA and protein structures abstracting the geometry at
covalent bond between two atoms as an edge to build a ball
represent each atom as a ball with van der Waals radius to build a space filling 1.2b), represent
model (Figure 1.2c) RNA)
or spatial distance) as an edge to build a topological By abstracting the
can be applied to Examp
from breaking down other proteins [Conners07]
a. Structure of alcohol dehydrogenase catalyzing alcohols to aldehydes/ketones
(black colored i sidechain, red is
bond, and yellow is a zinc atom Figure 1.1
RNA and protein structures abstracting the geometry at
covalent bond between two atoms as an edge to build a ball
represent each atom as a ball with van der Waals radius to build a space filling 1.2b), represent accessible
model (Figure 1.2c)
) as a point and the connectivity between two or spatial distance) as an edge to build a topological
By abstracting the can be applied to
Examples include structure alignment and from breaking down other proteins [Conners07]
Structure of alcohol dehydrogenase catalyzing alcohols to aldehydes/ketones
(black colored is backbone, purple sidechain, red is NAD+, green is hydrogen
, and yellow is a zinc atom
Figure 1.1 Examples of protein catalysis and protein RNA and protein structures
abstracting the geometry at different scales
covalent bond between two atoms as an edge to build a ball
represent each atom as a ball with van der Waals radius to build a space filling accessible regions of all atoms as a surface
model (Figure 1.2c), or represent each
as a point and the connectivity between two or spatial distance) as an edge to build a topological
By abstracting the macromolecular can be applied to analyze or simulate
les include structure alignment and from breaking down other proteins [Conners07]
Structure of alcohol dehydrogenase catalyzing alcohols to aldehydes/ketones
s backbone, purple is , green is hydrogen , and yellow is a zinc atom)
Examples of protein catalysis and protein RNA and protein structures can be represented
different scales
covalent bond between two atoms as an edge to build a ball
represent each atom as a ball with van der Waals radius to build a space filling regions of all atoms as a surface
represent each residue ( as a point and the connectivity between two or spatial distance) as an edge to build a topological
macromolecular structures as ge analyze or simulate
les include structure alignment and
3 from breaking down other proteins [Conners07].
Structure of alcohol dehydrogenase catalyzing alcohols to aldehydes/ketones
is , green is hydrogen
b.
inhibitor (red colored is trypsin and blue is
Examples of protein catalysis and protein can be represented
different scales. I can represent each atom as a point and each covalent bond between two atoms as an edge to build a ball
represent each atom as a ball with van der Waals radius to build a space filling regions of all atoms as a surface
residue (an amino acid as a point and the connectivity between two residues
or spatial distance) as an edge to build a topological model (Figure 1.2d) structures as ge
many functions of les include structure alignment and structure prediction.
b. Molecular surfaces of trypsin and its inhibitor (red colored is trypsin and blue is
Examples of protein catalysis and protein-protein
can be represented as different geometric models can represent each atom as a point and each covalent bond between two atoms as an edge to build a ball-and
represent each atom as a ball with van der Waals radius to build a space filling
regions of all atoms as a surface to build a molecular surface amino acid of protein
residues (covalent bond, hydrogen bond model (Figure 1.2d)
structures as geometric models, geometric algorithms functions of RNA and protein
structure prediction.
Molecular surfaces of trypsin and its inhibitor (red colored is trypsin and blue is
inhibitor)
protein interaction
different geometric models can represent each atom as a point and each
and-stick model ( represent each atom as a ball with van der Waals radius to build a space filling
to build a molecular surface of protein or
(covalent bond, hydrogen bond model (Figure 1.2d).
ometric models, geometric algorithms RNA and protein
Molecular surfaces of trypsin and its inhibitor (red colored is trypsin and blue is
interaction different geometric models can represent each atom as a point and each
del (Figure 1 represent each atom as a ball with van der Waals radius to build a space filling model (Figure
to build a molecular surface or a nucleotide (covalent bond, hydrogen bond
ometric models, geometric algorithms RNA and protein molecule Molecular surfaces of trypsin and its inhibitor (red colored is trypsin and blue is
different geometric models by can represent each atom as a point and each 1.2a), model (Figure to build a molecular surface nucleotide of (covalent bond, hydrogen bond
Figure 1.2
red is oxygen, blue is nitrogen, and brown is phosphorus. In d, purple colored is protein
Structure alignment
structures and
comparison, detect dissimilar structure, determ calculate structure
tasks in structure alignment: different structures;
a. Ball and stick model
c. Molecular su
Figure 1.2 Models of yeast aspartyl
red is oxygen, blue is nitrogen, and brown is phosphorus. In d, purple colored is protein backbone, brown is RNA backbone, and
Structure alignment
structures and is useful to query databases for similar structures, perform all comparison, detect dissimilar structure, determ
calculate structure
tasks in structure alignment: different structures;
Ball and stick model
Molecular surface model Models of yeast aspartyl
red is oxygen, blue is nitrogen, and brown is phosphorus. In d, purple colored is protein backbone, brown is RNA backbone, and
Structure alignment explores the similarity of two or more molecul
is useful to query databases for similar structures, perform all comparison, detect dissimilar structure, determ
calculate structure-based phylogenetic tree tasks in structure alignment:
different structures; the second is to Ball and stick model
rface model Models of yeast aspartyl-tRNA
red is oxygen, blue is nitrogen, and brown is phosphorus. In d, purple colored is protein backbone, brown is RNA backbone, and
explores the similarity of two or more molecul is useful to query databases for similar structures, perform all comparison, detect dissimilar structure, determ
based phylogenetic tree
tasks in structure alignment: the first is to establish correspondence second is to transform all structures to minimize a
tRNA synthetase (In a, b and c, purple colored is carbon, red is oxygen, blue is nitrogen, and brown is phosphorus. In d, purple colored is protein
backbone, brown is RNA backbone, and
explores the similarity of two or more molecul is useful to query databases for similar structures, perform all comparison, detect dissimilar structure, determine structural
based phylogenetic trees for RNA and protein families first is to establish correspondence
transform all structures to minimize a b. Space filling model
d. Contact edge model
synthetase (In a, b and c, purple colored is carbon, red is oxygen, blue is nitrogen, and brown is phosphorus. In d, purple colored is protein
backbone, brown is RNA backbone, and black is contact edge) explores the similarity of two or more molecul is useful to query databases for similar structures, perform all
ine structural
s for RNA and protein families first is to establish correspondence
transform all structures to minimize a Space filling model
Contact edge model
synthetase (In a, b and c, purple colored is carbon, red is oxygen, blue is nitrogen, and brown is phosphorus. In d, purple colored is protein
black is contact edge)
explores the similarity of two or more molecules based on their 3D is useful to query databases for similar structures, perform all
ine structurally conserved region s for RNA and protein families
first is to establish correspondence between transform all structures to minimize an
Space filling model
Contact edge model
synthetase (In a, b and c, purple colored is carbon, red is oxygen, blue is nitrogen, and brown is phosphorus. In d, purple colored is protein
black is contact edge)
es based on their 3D is useful to query databases for similar structures, perform all-to-all structure conserved regions, and s for RNA and protein families. There are two
between atoms n alignment score synthetase (In a, b and c, purple colored is carbon, red is oxygen, blue is nitrogen, and brown is phosphorus. In d, purple colored is protein
5
function (e.g. minimize the root mean squared distances for all atom pairs). Generally, establishing the correspondence is harder than optimizing the alignment. Most alignment methods regard each structure as a rigid body and allow only rotation and translation of the structure. Structure alignment methods have two categories: pairwise structure alignment aligns two structures and existing programs include DALI [Holm96] and MAMMOTH [Ortiz02]; multiple structure alignment aligns more than two structures and existing programs include MULTAL [Taylor94], CE [Guda01] and MUSTA [Leibowitz01].
Structure prediction is one of the most important problems in bioinformatics and is of
great importance in medicine and biotechnology, e.g. drug design and novel enzyme design. The goal is to predict 3D structure of an RNA or protein molecule from its sequence. Structure prediction searches the space of possible structures and identifies the most probable structure by minimizing an energy function. The predicted structure is subject to many geometric constraints, such as preserving the covalent bonds between atoms, limiting the lengths of the covalent bond and the angles of contiguous bonds in small ranges to canonical values, and preventing remote atoms from getting too close.
Structure prediction methods have three categories: homology modeling, threading, and ab initio modeling. Homology modeling builds a structure from known structures having
whose sequence may be compatible to the sequence of an unknown structure and optimizes the structure. Examples of threading programs include 3D-PSSM [Kelley00] and 3D-Jury [Ginalski03]. Ab initio modeling builds 3D molecular structure without reference to existing structures. It is considered the hardest method and the examples of programs include ROSETTA [Bonneau01] and TOUCHSTONE [Zhang03].
In this dissertation, I present three works that apply geometric algorithms in RNA and protein structures. These three works abstract the geometric properties of RNA and protein structures at different scales: 1) finding alternative clash-free conformations with acceptable geometry for RNA crystal structures, which focuses on the atomic details of RNA structures, 2) optimizing multiple structure alignment, which focuses on both local and global rigid geometry of RNA and protein structures, and 3) mining RNA tertiary motifs, which focuses on the topological geometry of RNA structures.
CHAPTER 2
RNA AND PROTEIN STRUCTURES
In this chapter, I discuss the basic biochemical properties of the RNA and protein structures and the methods to obtain and evaluate their structures.
2.1 Biochemical Properties
2.1.1 Atoms and Chemical Bonds
Hydrogen (H), carbon (C), nitrogen (N), oxygen (O), sulfur (S) and phosphorus (P) are the six most abundant atoms in RNA and protein molecules (sulfur occurs mostly in protein and phosphorus occurs mostly in RNA). RNA and protein molecules can also bond with some metal ions such as magnesium (Mg), zinc (Zn), and iron (Fe). All atoms other than hydrogen may be called heavy atoms.
called a non-polar covalent bond; examples include C-C, O-O and H-H. The typical bond length for a covalent bond with heavy atoms is 1.5Å and for a covalent bond with hydrogen atom is 1.1Å. The typical bond angle formed by two contiguous covalent bonds is 109°. An ionic bond often forms between metal and non-metal ions. Metal ions in RNA and protein
structures form ion bonds with several types of non-metal atoms, such as nitrogen, oxygen, sulfur and phosphorus. The length and angle of ionic bonds vary. A hydrogen bond is a special type of bond formed between an electronegative atom (e.g. nitrogen, oxygen, sulfur or phosphorus) and a hydrogen atom bonded with another electronegative atom. A hydrogen atom bound to a carbon atom (i.e. C-H bond) normally cannot form a hydrogen bond with other atoms because the difference of electron affinity for carbon and hydrogen atoms is small and C-H bond is normally considered non-polar. The normal length of a hydrogen bond is 1.97Å.
2.1.2 Protein
A protein molecule is a linear polymer of 20 different amino acids. Protein has four levels of structural organization: Primary structure is the linear sequence of amino acids, secondary structure is the common recurring patterns of inter-residue interactions, including α-helix and β-sheet, tertiary structure is the overall shape of a protein molecule, and quaternary structure is the organization of two or more protein molecules. The primary structure is
formed by the covalent bonds, whereas the secondary, tertiary and quaternary structures are formed mainly by hydrogen bonds and ionic bonds.
9
the amino and carboxyl groups are the same (except for Proline) and the R groups differ. The amino groups and carboxyl groups from contiguous amino acids are joined by peptide bonds (with the removal of water molecules) and form the protein backbone.
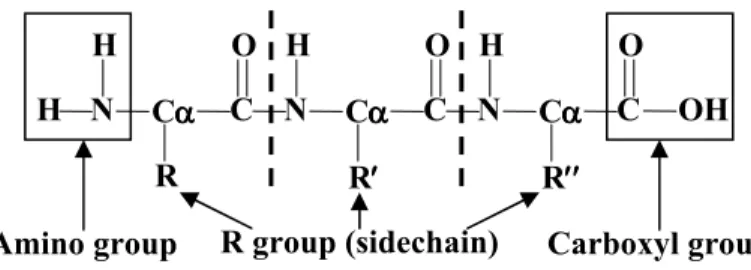
Figure 2.1 A sequence of three amino acids joined by peptide bonds, showing amino, carboxyl and R groups attaching to the α-carbons
Figure 2.2 Bond lengths, angles and dihedral angles in the amino acids. Black colored atoms are carbon, red is oxygen, blue is nitrogen, and gray is hydrogen (not all hydrogens are shown). For heavy atoms (i.e. non-hydrogen atoms), thick solid lines are bond lengths,
curves are angles and arrow curves are dihedral angles
In a protein structure, bond lengths (for covalent bonds) and bond angles (by two contiguous covalent bonds) are relatively rigid –– only limited flexibility is allowed, but dihedral angles (formed by three contiguous covalent bonds) are flexible. Figure 2.2 shows
the bond lengths, angles and dihedral angles in protein backbone. Each amino acid backbone has three dihedral angles ϕ (C–N–Cα–C), ψ (N–Cα–C–N) and ω (Cα–C–N–Cα). The ϕ and ψ angles are relatively free to rotate; the 2D Ramachandran plot shows the allowable ranges
ϕ ϕϕ ϕ
ψ ψ ψ ψ
Cαααα
Cαααα
ω ω ω ω
R group (sidechain) Carboxyl group
Amino group R
C O
Cαααα H N
H
R′′′′ C O
Cαααα N H
R′′′′′′′′ C O
Cαααα N H
of both angles [Morris92, Lovell03]. The ω angle around the peptide bond is relatively rigid because the peptide bond is a partial double bond but not a single bond. The ω angle can be either close to 0° in cis form (both Cα atoms are at the same side of C-N bond) or close to 180° in the more common trans form (Cα atoms are at the different side of C-N bond).
2.1.3 RNA
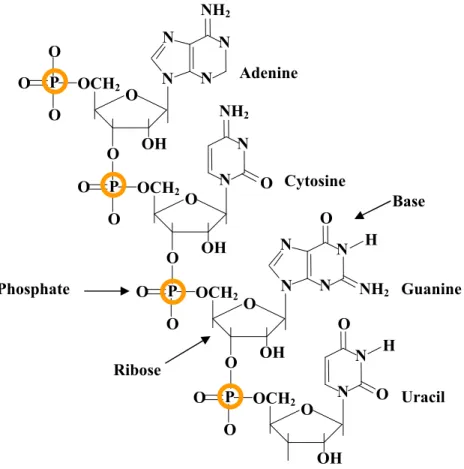
An RNA molecule is a linear polymer of 4 different nucleotides. Like protein, RNA also has four levels of structural organization: primary structure is the linear sequence of nucleotides, secondary structure is the collection of pairs of bases in 3D structure, tertiary structure is the overall shape of an RNA molecule, and quaternary structure is the organization of two or more RNA molecules.
11
Figure 2.3 A fragment of RNA structure with four nucleotides: A, C, G and U. Each nucleotide has three components: phosphate, sugar and base
Figure 2.4 Bond lengths, angles and dihedral angles in a nucleotide. Black colored is carbon, red is oxygen, blue is nitrogen, and yellow is phosphorus. Thick solid lines are bond lengths,
curves are angles and arrow curves are dihedral angles
O5’ α α α α ββββ γγγγ δδδδ εεεε ζζζζ P C5’ C4’ C3’
O3’ P
In RNA structure, as in protein, bond lengths and angles are relatively rigid but dihedral angles are flexible. Figure 2.4 shows bond lengths, angles and dihedral angles in RNA backbone. Each nucleotide backbone has six dihedral angles, α, β, γ, δ, ε, and ζ, whose atoms and typical ranges are shown in Table 2.1. The δ angle is constrained by the ribose ring structure, but the other dihedral angles are more flexible and most of them show several peaks of allowable ranges [Murray03]. The ribose ring has a C2’-endo or C3’-endo pucker modes, in which either the C2’ or C3’ atom is extended out of the sugar plane and lies at the same side of C5’, as shown in Figure 2.5.
Table 2.1 Typical ranges of 6 nucleotide backbone dihedral angles [Murray03]
Dihedral Typical ranges
α (O3’-P-O5’-C5’) Peaks at 60°, –60° and 180°. Extra peak at –110° for C3’-endo β (P-O5’-C5’-C4’) Peaks at 110°, –135° and 180°. Extra peaks at 80° and 135° for
C3’-endo
γ (O5’-C5’-C4’-C3’) Peaks at 60° and 180°. Extra peak at –60° for C2’-endo δ (C5’-C4’-C3’-O3’) Near 84° for C3’-endo and near 147° for C2’-endo
ε (C4’-C3’-O3’-P) Peak at –150° for C3’-endo and peak at –100° for C2’-endo ζ (C3’-O3’-P-O5’) Peaks at 60°, –60° and 180°. Extra peak at –140° for C3’-endo
a. C2’-endo b. C3’-endo Figure 2.5 C2’-endo and C3’-endo conformations
C5’ Base
O4’ C4’
C3’
C2’
C1’
C5’ Base
O4’ C4’
C3’
13
2.2 Structure Determination
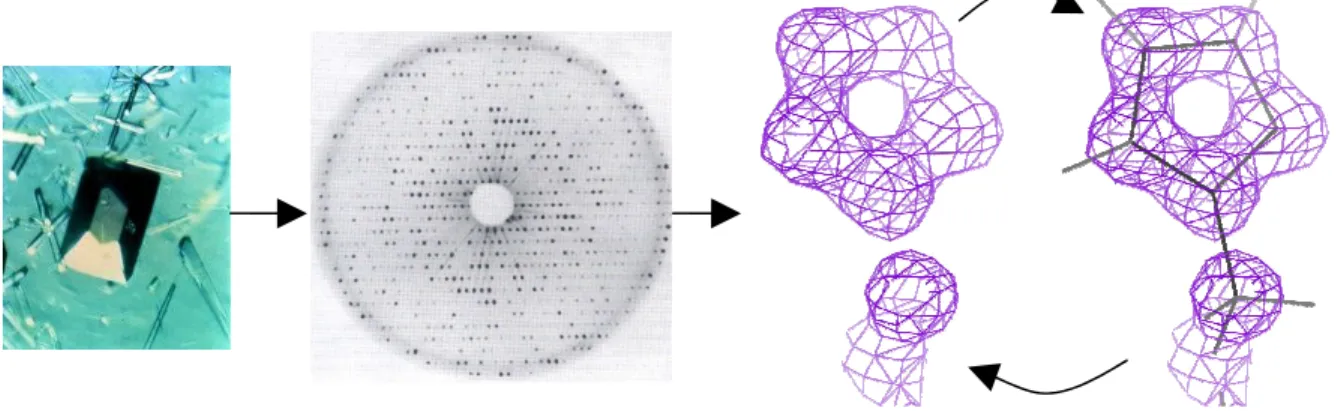
X-ray crystallography is the most common method to obtain data on RNA/protein
structures. X-ray crystallography can be described as a 4-step process [Rhodes06]: in step 1, a pure sample of the desired protein/RNA is coerced to form a crystal by biochemistry methods in the laboratory (Figure 2.6a), in step 2, X-ray beams are scattered by atomic electrons in the crystal to form a series of 2D diffraction patterns (each with a distinct orientation of the crystal), which records the reflections of atoms (Figure 2.6b), in step 3, 3D electron density map is calculated from the diffraction patterns through Fourier transform (FT) (Figure 2.6c), and in step 4, a structure model is fit to the electron density (Figure 2.6d). X-ray crystallography suffers a phase problem: performing Fourier transform needs to know the intensities and phases for all atoms besides the X-ray wavelength, but the diffraction patterns capture only the intensities and not the phases. To solve this problem, at first scientists use various methods to guess initial phases for the atoms and build initial electron density map in step 3, then fit an initial structure model to the electron density in step 4, and repeat steps 3 and 4 for multiple times (called structure refinement) to find a good structure model that fits the electron density map well.
Progress in protein crystal structure determination has lead to decision algorithms that can largely replace manual rebuilding in an automated refinement pipeline [Adams02]. Although RNA crystallography has also seen revolutionary progress [Ban00, Schluenzen00, Wimberly00, Batey04, Torres-Larios05, Martick06], determining RNA backbone remains a difficult task –– RNA backbone has 6 dihedral angles per nucleotide and presents high degrees of freedom, while protein backbone has only 2 dihedral angles per amino acid.
Nuclear magnetic resonance spectroscopy (NMR) explores the quantum mechanical
magnetic properties of atoms’ nuclei to obtain the structure of a molecule [Keeler05]. When placed in the magnetic field, an atom’s nucleus (e.g. 1H, 13C and 15N) resonates at a certain frequency (e.g. proton resonates at 900 MHz). But when the atom is in a molecule, the resonant frequency of the atom’s nucleus may change depending on the presence of nearby atoms. NMR spectroscopy performs a sequence of changes of directions and intensities of the magnetic fields (e.g. Nuclear Overhauser Effect Spectroscopy) to detect the resonant frequencies of atoms and then derive the atoms positions. In NMR spectroscopy, usually the molecules are placed in solution and both the 3D structures and the molecular dynamics can be obtained from the experiments. Currently NMR spectroscopy works well on large protein molecules up to 100 kDa (more than 800 amino acids in total) and RNA molecules up to 100 nucleotides and progress continues to be made to resolve the structures of larger molecules [Kolk98, Oberstrass06].
Electron microscopy uses electrons to obtain the images of objects [Frank06]. Like light
15
microscopy, the specimens (molecules) are cooled to very low temperature (e.g. liquid nitrogen temperature) and are placed in high vacuum to remove the noises (i.e. radiations). Combining with molecular reconstruction methods, electron microscopy works well on studying the structures, dynamics and interactions of protein and RNA molecules [Frank03].
2.3 All-Atom Contact Analysis for Structure Validation
Various errors may occur when obtaining structures in X-ray crystallography and NMR methods, so structure validation methods are important to verify and correct the obtained structures. For both RNA and protein structures, common structure validation methods include the crystallographic residuals R and Rfree [Brunger92], difference density (Fobs–Fcalc), and all-atom contact analysis [Word99a, Davis04, Davis07]. The first method focuses on the validation of overall structures, while the last two methods focus on the validation of local structure details. Protein structures have 2D Ramachandran plots [Morris92, Lovell03] and rotamer libraries [Dunbrack97, Lovell00] for verifying local details, but no equivalent tools are available for RNA structures, although significant progress has been made recently [Murray03, Schneider04, Richardson08].
CHAPTER 3
REDUCING STERIC CLASHES IN RNA BACKBONE
3.1 Introduction
Large RNA or RNP (ribonucleoprotein) structures are typically determined at resolutions of 2.5Å or worse by X-ray crystallography; at that level of detail the phosphates and bases can be seen clearly and accurately positioned (see Figure 3.1a), but the remaining backbone atoms and the sugar puckers are underdetermined. All-atom-contact analysis [Word99a, Davis04, Davis07] of deposited RNA structures commonly shows steric clashes between backbone and base atoms or among backbone atoms, as illustrated in Figure 3.1b. Thus, there is a need for new methodology for backbone fitting.
a. all-atom-contact dots within bases. b. all-atom-contact dots within backbone and between backbone and bases. Figure 3.1 Selected all-atom-contacts in tr0002/1EVV (yeast phenylalanine tRNA [Jovine00]) at 2.0Å resolution (residues 28-32 and 40-44). The green and blue all-atom-contact dots in 3.1a show almost perfect van der Waals and H-bond all-atom-contacts between the stacked and paired bases, while the red spikes in 3.1b show large steric clashes that indicate a
locally misfit backbone
a. ur0035/1Q9A at 1.04Å resolution [Correll03] b. rr0033/1JJ2 at 2.4Å resolution [Klein01] Figure 3.2 Contoured electron density maps and atomic models for the same piece of ribosomal RNA structure (part of the “sarcin loop”) solved at quite different resolutions
19
energetics. However, the 3D structure of the RNA backbone is at least equally important in functional interactions such as drug binding [Hansen03], protein/RNA interactions [Klein04], aptamer binding [Huang03], and ribozyme catalysis [Doudna02], which often occurs at sites with unusual backbone conformations [Ferre-D'Amare98, Adams04, Golden05] that require careful and accurate analysis. The partner molecules in all these systems interact with the full all-angle, all-atom detail of the RNA, and the structural biology should aim to accurately determine that same level of detail.
The currently-available tools for fitting, refining, rebuilding, and validating crystal structures for proteins are significantly richer and more mature than those for RNA. For proteins, initial model building (“chain tracing”) can be done automatically by ARP/wARP [Perrakis99] or Resolve [Terwilliger02], but for RNA, such tools do not yet exist. Almost all large RNA and RNP structures are refined in CNS [Brunger98], which has provided parameter sets and other support for nucleic acids. CNS optimizes agreement of model to data by minimization or simulated annealing protocols, using a simple atomic force field weighted relative to an experimental data term. Energy parameters, weightings, and procedural strategies are not yet fully optimized for RNA: for example, sugar puckers are restrained to the default C3'-endo configuration unless explicitly set by the user, and there are not yet good diagnostics to help make that decision. Model rebuilding between rounds of refinement is traditionally performed by visually comparing the model to the electron density map and manually adjusting it, in software such as O [Jones91], XFit [McRee99], or Coot [Emsley04]. This process is especially time-consuming and error-prone for RNA.
Fcalc), and all-atom steric clashes [Word99a, Davis04, Davis07]. Other tools that are effective on protein do not yet have equivalently versions for RNA rebuilding, including 2-D Ramachandran plots that compactly assess all available protein backbone dihedral angles [Morris92, Lovell03]. Protein backbones have the advantage of only 2 major degrees of freedom per residue (φ and ψ), while RNA backbones have at least 6 degrees of freedom per nucleotide (depending on how sugar pucker is represented), meaning that the equivalent plot for RNA would be 6-D or 7-D. Simplifications using 2-D projections of pairs of adjacent dihedral angle values [Sasisekharan69; Murthy99] have not led to practical tools. Simplification by defining virtual dihedral angles at 2 atoms per residue [Duarte03] is very valuable for locating structural motifs, largely because it is designed to be insensitive to errors. For that same reason, however, it is not useful for building or correcting the all-atom models needed for refining crystallographic or NMR experimental structures. Recent work has identified clusters of preferred RNA backbone conformations [Murray03, Schneider04, Richardson08], but these cannot be represented as a simple 2-D plot and have not yet been incorporated into rebuilding tools. Most steric clashes in refined protein structures are caused by incorrect positions of sidechain atoms, while most steric clashes in refined RNA structures are caused by incorrect positions of backbone atoms. Amino acid sidechains, which have one end fixed in both position and orientation, are easier to adjust than nucleic acid backbone fragments, which have both ends fixed in position, but not orientation.
21
makes it especially needed. RNABC produces new alternative conformations with equal or better geometry and fewer steric clashes. It first applies the robotics technique of forward kinematics [McCarthy90] (a technique determines the conformation of a robot or molecule
given its parameters, which is considerably easier than the inverse kinematics problem of determining the parameters given the conformation.) to recalculate rough backbone conformation across a dinucleotide, subject to anchored positions of the best-known features: phosphates and base planes, and then applies conjugate gradient method [Shewchuk94] (a method finds local minimum nearest to the initial values of a function with n variables, in which the gradient of the function is computable) to build the dinucleotide for each of allowable rough backbone conformation. The user can specify most parameters and procedures, or use default values. RNABC finds and clusters all possible conformations within the specified constraints and outputs those with the best geometry and clash scores. The output conformations are scored and sorted based on their fitness to the electron density map. Multi-platform executables and source code of RNABC are available at http://kinemage.biochem.duke.edu/.
3.2 Method
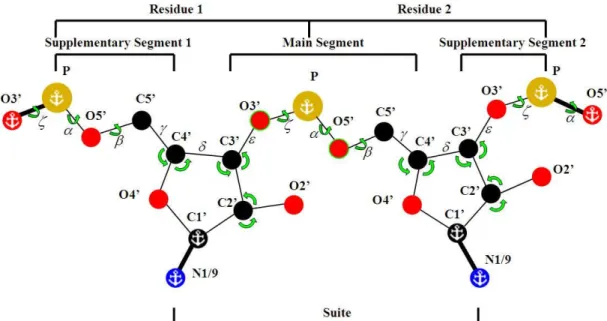
The goal of RNABC program is to remove steric clashes within an individual suite by considering the possible configurations of the dinucleotide that contains the suite, as shown in Figure 3.3.
Figure 3.3 Atom labeling and nomenclature for reconstructing a suite within a dinucleotide span. Anchors mark atoms with fixed positions; green arrows mark the conformational degrees of freedom that are explored directly: dihedrals α, β, and ζ, PO4 orientation around the anchored P, and two of the three bond angles around C2', C3', and C4'. Hydrogens are not
shown but are used extensively in RNABC
23
outside. RNABC samples the configurations of these segments and considers how they can be joined –– it emphasizes early filtering to reduce the number of tested conformations.
3.2.1 Description of the Method
RNABC program reads PDB-format [Berman00] files for the coordinates of the RNA structure. The input file is assumed to include hydrogen atoms, which can be added and optimized conveniently using Reduce [Word99b] via the structure validation service provided by the MolProbity web site [Davis04, Davis07]. MolProbity can also help the user decide which backbone suites need attention by flagging serious clashes between atoms [Word99a] and suspicious sugar puckers. RNABC holds fixed the positions of the bases (defined by the C1’–N1/9 bond) and the phosphorus atoms, since these are the features of RNA structure seen most clearly in X-ray crystallography, and reconstruct the positions of all other backbone atoms in the dinucleotide. RNABC allows only small standard deviations (e.g. 3-4σ) of all the bond lengths and angles to the canonical values used by CNS [Parkinson96]. Alternatively, the user can specify the target bond lengths and angles directly (e.g., from parameter files of a different refinement program), or from the input values, or from the average of the input and canonical values. The user can specify sugar puckers explicitly, keep them from the original coordinates, or let the software determine them by geometric rules based on the perpendicular distance from 3’ phosphorus to the C1’–N1/9 vector or to the base plane. The user can even move the position of a phosphorus or base to a specified new location (e.g., to a local peak in the density).
but is easier to filter for disallowed atom positions. RNABC roughly samples dihedral angles
α,
β, and
ζ, and phosphate orientations. It then determines one bond length (C4’–C3’) and
two bond angles (C5’–C4’–C3’, C4’–C3’–O3’) to satisfy geometry and generates the sugar puckers by allowable rough backbone atoms and C1’ and N1/9 atoms using conjugate gradient method. Note that every atom type (e.g., C4’) and every bond length, angle, and dihedral, occurs at least twice within a target dinucleotide. Conditions defined below presume that distances or angles are between nearest atoms of the given type (i.e., within a residue, or within a segment) and hold for all instances, unless otherwise specified.
RNABC uses four types of criteria for evaluating the positions of RNA backbone atoms. 1. NOCLASH: selected atoms should not have steric clashes with the atoms in the suite or
the atoms out of the dinucleotide. NOCLASH has two categories:
NOCLASH_M: Atoms O5’, C5’, C4’, C3’, O3’, OP1, OP2, H5’, and H5’’ in the main
segment should have no steric clashes with the atoms in the suite or out of the dinucleotide.
NOCLASH_S: Atoms O4’, C2’, O2’, H1’, H2’, HO2’, H3’, and H4’ in the two sugars
should have no steric clashes with the atoms in the suite or out of the dinucleotide.
Atoms within the dinucleotide but out of the suite being adjusted are allowed to clash because local flexibility is not enough to avoid clashes between these and atoms in the suite; clashes related to these atoms may be corrected by running RNABC on adjacent suites.
2. PUCKERTYPE: The two sugar puckers satisfy designated sugar pucker types. Each
25
C4’–O4’–C1’should be shorter than a threshold value (default = 0.4Å). The δ dihedral is also kept within a range compatible with C3’-endo pucker, but quite permissive (51 to 110°). The C2’-endo sugar pucker has similar criteria.
3. INRANGE: distances of atom pairs, angles of certain atom triples and dihedrals of
certain atom quadruples that are not pre-specified should be in certain ranges. INRANGE has two categories:
INRANGE_BB: Backbone atoms O5’, C5’, C4’, C3’ and O3’ in the main and
supplementary segments satisfy: the 2-bond to 4-bond distances of O5’–C1’, C4’–C1’, C5’– C1’, C4’–N1/9, C3’–C1’, O3’–C1’ and C3’–N1/9 and the multi-bond virtual angles of C5’– C4’–C1’, C4’–C1’–N1/9, O3’–C3’–C1’ and C3’–C1’–N1/9 should be within certain ranges (e.g. within 3 or 4 standard deviations (σ) of the range implied by combining specified values of the intervening parameters; see section 2.2.3), and multi-bond virtual dihedrals C5’–C4’– C1’–N1/9 and O3’–C3’–C1’–N1/9 should be within certain ranges (see section 2.2.3).
INRANGE_ SB: In the sugars on the backbone, bond length C4’–C3’ and bond angles
C5’–C4’–C3’ and C4’–C3’–O3’ in each nucleotide should be within the specified ranges. 4. CGRANGE: sum of squared distances (of atom pairs for bond lengths and of certain
atom triples for bond angles) to designated values should be minimized in conjugate gradient method. CGRANGE has five categories:
CGRANGE_O4C2: The sugar atoms O4’ and C2’ satisfy: bond lengths O4’–C4’, O4’–
C1’, C2’–C3’, C2’–C1’ and bond angles O4’–C4’–C5’, O4’–C4’–C3’, O4’–C1’–N1/9, C2’– C3’–C4’, C2’–C3’–O3’, C2’–C1’–N1/9, and O4’–C1’–C2’ should be close to the designated values.
C4’–O4’, C3’–O3’, C3’–C2’, and C4’–C3’ and bond angles C4’–C5’–O5’, C4’–C3’–O3’, C4’–C3’–C2’, C4’–O4’–C1’, C3’–C4’–C5’, C3’–O3’–P, C3’–C4’–O4’, and C3’–C2’–C1’ should be close to the designated values.
CGRANGE_O5C5: The backbone atoms O5’ and C5’ satisfy: bond lengths O5’–P, C5’–
C4’, and O5’–C5’ and bond angles O5’–P–O3’, O5’–C5’–C4’, C5’–O5’–P, C5’–C4’–C3’, and C5’–C4’–O4’ should be close to the designated values.
CGRANGE_O3: The backbone atom O3’ satisfies: bond lengths O3’–C3’ and O3’–P and
bond angles O3’–C3’–C4’, O3’–C3’–C2’, and O3’–P–O5’ should be close to the designated values.
CGRANGE_O3O5: The backbone atoms O3’ and O5’ satisfy: bond lengths O3’–C3’,
O3’–P, O5’–P, and O5’–C5’ and bond angles O3’–C3’–C4’, O3’–C3’–C2’, O5’–C5’–C4’, and O3’–P–O5’ should be close to the designated values.
RNABC applies these criteria in first three of four steps: building backbone segments, building sugar geometry, and optimizing dinucleotide geometry.
3.2.1.1 Step 1: building backbone segments
In the first step, RNABC first samples positions of 5 outer atoms in the dinucleotide backbone (O5’, C5’ & C4’ in supplementary segment 1, and O3’ & C3' in supplementary segment 2) by changing dihedral angles, and use forward kinematics to calculate allowable positions of these atoms. Given
fixed phosphorus positions and the bond lengths and angles, RNABC first calculates allowable positions of those 5 atoms and evaluate them using criterion INRANGE_BB,
P O5’
C5’ C4’ P
ζ
α αα α
β ββ β
ζ αααα
27
O5’ C5’
C4’ P
ζ
α α α α
β ββ β
O3’ C3’
of atom C4’ in supplementary segment 1, for example, with given positions of atoms P, O5’ and C5’, RNABC rotates C4’ around bond O5’–C5’ (i.e. rotate
dihedral angle β).
After calculating the allowed positions of atoms in the two
supplementary segments, RNABC calculates allowed positions of atoms C3', O3', O5’, C5’, C4’ in the main segment and evaluate them using criteria INRANGE_BB, INRANGE_SB, and NOCLASH_M. The positions of atoms O5’ and O3’ are calculated from the anchored phosphorus by sampling three Euler angles, which represent the rotation of a 3D object by the angles of rotation around three chosen axes. This ensures that O5’ and O3’ are sampled from a sphere centered at P with angle O5’–P–O3’ fixed. The positions of atoms C5’, C4’, and C3’ are calculated from the positions of O5’ and O3’ and the relevant bond and dihedral angles.
In the implementation, I coarsely sample atom positions in steps of 10° (default). Larger rotation angle may not find allowable positions for certain atoms. Smaller rotation angle may generate many similar atom positions (i.e. generate same sugars in the second step) and slow down the program.
3.2.1.2 Step 2: building sugar geometry
In the second step, RNABC constructs the two sugars in the suite by conjugate gradient method from the coordinates of the two sextuples {C5’, C4’, C3’, O3’, C1’, N1/9} around them –– these are the atoms in the three bonds that join a sugar to the rest of the
structure. The first sextuple has C5’ and C4’ from supplementary segment 1 and C3’ and O3’ from the main segment. The second sextuple has C5’ and C4’ from the main segment and
O3’ C3’ C5’
C4’
O4’ C1’
N1/9
C3’ and O3’ from supplementary segment 2. The positions of atoms C1’ and N1/9 are anchored. RNABC generates allowable sextuples by evaluating the combinations of main segment and two supplementary segments using criterion INRANGE_SB.
For each sextuple, RNABC first translates and rotates an ideal sugar with canonical bond lengths and angles to superimpose the sextuple, so that the positions of C1’ and the bonds C1’–N1/9 are coincident and the bonds C4’–C3’ parallel to each other. By adding C2’ and O4’ from the ideal sugar, the sextuple is expanded to an octuple {C5’, C4’, O4’, C3’, O3’, C2’, C1’, N1/9}.
Next, RNABC optimizes two sugars by conjugate gradient method, using the octuple as initial atom positions. All atom positions except C1’ and N1/9 in the octuple are adjusted to make all bond lengths and angles close to the designated values. Conjugate gradient method may stick at an unfavorable local minimum when optimizing the positions of all atoms together, so RNABC divides the sugar atoms into four groups and runs the conjugate gradient method for each group, first optimizes the positions of O4’ and C2’ and adds O2’, H2’ and H1’, then optimizes C4’ and C3’ and adds H3’ and H4’, then optimizes O5’ and C5’ and adds H5’ and H5’’, and finally optimizes O3’, using the criteria CGRANGE_O4C2, CGRANGE_C4C3, CGRANGE_O5C5, and CGRANGE_O3, respectively. All sugar atoms are evaluated by criterion NOCLASH_S during the minimization. The whole optimization process is repeated five times (default) to make sure that all criteria are minimized.
29
1. fi =((x1−a1)2 +(x2 −a2)2+(x3−a3)2 −d2)2 , where (x1, x2, x3) is an unknown atom position, (a1, a2, a3) is a known atom position and d is the distance.
2. 2 2 2
3 3 2 2 2 2 1
1 ) ( ) ( ) )
((x y x y x y d
fi = − + − + − − , where (x1, x2, x3) and (y1, y2, y3)
are two unknown atom positions and d is the distance. For bond length constraint, d is the designated bond length; for bond angle constraint, if the three atoms related
with bond angle constructing a triangle by designated values, then d is the length of the opposite edge of the angle.
Choosing the above quartic functions has two reasons: first, these quartic functions satisfy the requirement that the bond lengths and bond angles (can be regarded as distances when two bonds are fixed) should be close to designated values, and second, these quartic functions are easy to calculate the derivatives –– an essential step in the conjugate gradient method. In the implementation, I set higher weights to the functions for bond lengths (default = 4.0) because the bond length constraints are less flexible than bond angle constraints.
In the last round of minimization, if any of the bond lengths and angles is larger than a threshold scale of standard deviation (default = 3.0) to the designated value, then weight of the corresponding quartic function is increased by 2.0 in default and the conjugate gradient method runs again, in order to keep all the standard deviations small.
3.2.1.3 Step 3: optimizing dinucleotide geometry
In the third step, RNABC adjusts the whole dinucleotide to minimize all the bond lengths and angles to the designated values by conjugate gradient method. RNABC divides the whole dinucleotide into nine groups (some atoms may appear in two groups) and runs conjugate
d
gradient method for each group, first optimizes O3’ and O5’ and adds OP1 and OP2 in the main segment,
then optimizes O3’ in the main segment, then optimizes C4’ and C3’ and adds H4’ and H3’ in the first sugar, then optimizes O4’ and C2’ and adds O2’, H2’ and H1’ in the first sugar, then optimizes O5’ and C5’ and adds H5’ and H5’’ in the supplemental segment 1, then optimizes O5’ and C5’ and adds H5’ and H5’’ in the main segment, then optimizes C4’ and C3’ and adds H4’ and H3’ in the second sugar, then optimizes O4’ and C2’ and adds O2’, H2’ and H1’ in the second sugar, and finally optimizes O3’ in the supplemental segment 2. All atoms are evaluated by criteria NOCLASH_M and NOCLASH_S during the minimization. The whole process is repeated 10 times (default).
RNABC starts at O3’ and O5’ in the main segment because both sugars have been optimized but the bond length O3’–P and P–O5’ and bond angle O3’–P–O5 remain in designated values and may provide extra flexibility to optimize the whole dinucleotide. Similar to step 2, in the last round of minimization, RNABC increases the weight of certain function if the corresponding bond length or angle is larger than a threshold scale of standard deviation (default = 3.0) to the designated value.
RNABC evaluates and accepts the optimized dinucleotide geometry when all the bond length or angle are less than 5 standard deviations (default) to the designated values and both sugar puckers satisfy criterion PUCKERTYPE.
Finally, RNABC calculates the positions of two HO2’ in both sugars and evaluate them O3’
C3’
O5’ C5’
C4’
P P
O3’ C3’
O4’ C2’ O2’ C1’
N1/9 O5’
C5’ C4’ P
O3’
O4’ C1’
N1/9
31
by criterion NOCLASH_S. RNABC leaves the calculation of HO2’ to the last because the position of HO2’ is very flexible and it can always find a good position for HO2’.
3.2.1.4 Step 4: clustering and comparing to the electron density map
In the fourth step, RNABC clusters similar suite conformations from the third step, calculates the error scores by comparing the conformations to the electron density map, sorts the conformations by the error scores, and outputs them.
To cluster similar conformations, RNABC calculates RMSD of heavy atoms for each conformation pair and considers the pair as equivalent if the RMSD is less than a threshold value (default = 0.4Å). For equivalent conformations, RNABC keeps the conformation with smaller maximum standard deviation value for all bond lengths and angles to the designated values, because a conformation having a large standard deviation for a certain bond length or angle is more prone to a bad geometry.
RNABC uses a standard procedure in X-ray crystallography for structure refinement to calculate the error score from the dinucleotide conformation to the electron density map [Diamond71, Chapman95]. The target function is
∑
[
( )
( )
]
∈
− + =
V g
i c i
o
i
g k
g S
T ρ ρ , where S and
k are scale factors and can be calculated during initialization using partial structural model, gi is a grid point, V is the volume around the dinucleotide, ρo is the observed electron density values and ρc is the calculated electron density values. S and k are pre-calculated during each run of RNABC by minimizing a partial model of the RNA structure with the electron density map. In the implementation, I use all the phosphorus in the partial model, because phosphorus is the clearest in the RNA structures.
electron density of each atom as an isotropic 3D Gaussian and sums up the electron density values for all atoms. The function of Diamond’s method is
( )
=∑
(
−)
i
i i i i
c g Z G a ,r r
ρ , where
Zi is the number of electrons associated with atom i, r – ri is the distance between the position of the atom and grid point, G
(
a, r)
=a−3e−πr2 a2 is a spherical Gaussian function. a= B 4πwhen the atomic scattering factor is f =Ze−Bsin2θ λ2, where B is the B-factor and θ and λ are known values related with resolution.
For each output conformation, RNABC outputs PDB formatted ATOM items for all atoms, seven dihedral angle values for the suite conformation, standard deviations for all bond lengths and angles to the designated values, and kinemage formatted dinucleotide structure [Richardson01]. Future work is needed to assign each output conformation a backbone conformer name defined by RNA Ontology Consortium [Leontis06, Richardson08].
3.2.2 Implementation
RNABC is implemented in C++. The executables and source code are available at http://kinemage.biochem.duke.edu.
3.2.2.1 User-specifiable Parameters
33
Table 3.1 Parameters often specified by RNABC users
Flag Parameter details
-RESID Residue ID of central P atom in the suite to be analyzed -CHAIN Chain ID character, default = first chain in file
-PUCKER Pucker type or method for first [second] sugar in suite, default = both determined by 3’P perpendicular to C1’–N1/9 vector
-PARAMETER
Specifies reference bond lengths and angles. Users can choose canonical, original, average of canonical and original, or specify values in a file. Default = canonical
-COARSESPAN Step size for sampling coarse rotation angles, default = 10° -WITHINCHAIN Check collisions with atoms only on the local chain -OVERLAP Overlap distance considered a steric clash, default = 0.4Å
-ADJUSTOUTLIER Maximum allowable standard deviation of all bond lengths and angles, default = 5σ
-STDEV Standard deviation limitations of all bond lengths and angles that conjugate gradient method attempts to achieve, default = 3σ
-ADJUSTSMALLCLASH
Use geometric method to remove small steric clashes. For hydrogen, adjust the overlap within 0.45Å (default); For others, adjust the overlap within 0.5Å (default)
-ADJUSTCLASHBYCG Add additional function to remove steric clashes in conjugate gradient method
-CONFORMATION Maximum number of suite conformations to be output, default = output all conformations
3.2.2.2 Output
conformation (with its name and dihedral-angle values), while the second half is readable by the Mage and KiNG kinemage viewers [Richardson01, Davis04, Davis07] for 3D display of the original and new conformations. Mage and KiNG can ignore the first half of the file, and do not need it to have a specific extension (e.g., *.kin).
Mage (C) and KiNG (Java), available at http://kinemage.biochem.duke.edu, are open-source software for multi-platform display and modeling of molecules. Both can display RNABC output, along with electron density maps and MolProbity validation kinemages of the original structure. Mage can build a dockable dinucleotide with adjustable backbone rotamers, if further fitting is desired. KiNG reads more map formats, recontours and moves in them in real time, and can be used on-line in the MolProbity service of the above web site, by reading in the RNABC output file and the user's electron density map (or fetching a map from the Electron Density Server at http://eds.bmc.uu.se/eds/ [Kleywegt04]. When the user has selected a preferred new conformation, the corresponding coordinates can then be cut-and-pasted from the RNABC output file into the PDB file for the overall structure, for submission to further crystallographic refinement.
3.2.2.3 Early rejection
35
To improve the performance, RNABC uses criterion INRANGE_BB to reject supplementary segments and main segment that contain disallowed atom positions as soon as they are calculated. For example, for the supplementary segment P–O3’–C3’ in residue 2, after calculating a position of O3’, RNABC checks the distance from O3’ to C1’ and if the distance is not within a valid range, it rejects O3’ and needs not to calculate C3’.
In the INRANGE_BB, the distances C5’–C1’, C4’–N1/9, O3’–C1’ and C3’–N1/9 depend on the angles C5’–C4’–C1’, C4’–C1’–N1/9, O3’–C3’–C1’ and C3’–C1’–N1/9. These angles depend on the pucker state of the sugars and cannot be obtained directly from the other bond lengths and angles. Also I introduce two dihedral angles C5’–C4’–C1’–N1/9 and O3’–C3’– C1’–N1/9, which are used to reject disallowed sugar poses, because the distance and angle criteria allow symmetric sugar poses but the β-D-ribose sugar in RNA has a fixed chirality at the C1’ atom. These angles are first measured from ideal C2’-endo and C3’-endo sugars and then extended to certain ranges to accommodate the influence of possibly changed bond lengths, angles and δ dihedral.
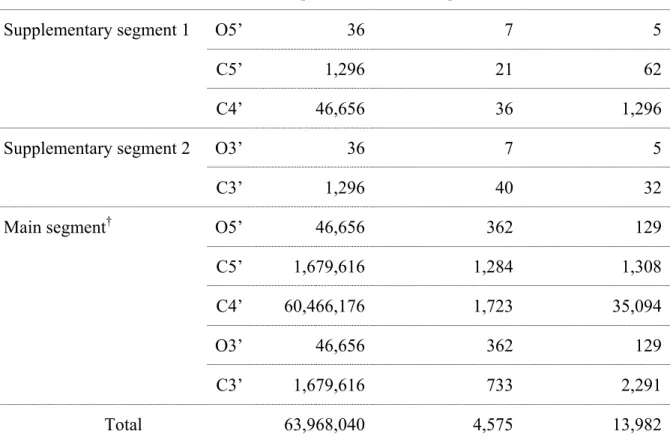
Table 3.2 Comparison of total and allowed positions of backbone atoms found for suite 77-78 of chain 9, rr0082/1S72
Sample step (every 10°)
Total positions Allowed positions Ratio(total/allow)
Supplementary segment 1 O5’ 36 7 5
C5’ 1,296 21 62
C4’ 46,656 36 1,296
Supplementary segment 2 O3’ 36 7 5
C3’ 1,296 40 32
Main segment† O5’ 46,656 362 129
C5’ 1,679,616 1,284 1,308
C4’ 60,466,176 1,723 35,094
O3’ 46,656 362 129
C3’ 1,679,616 733 2,291
Total 63,968,040 4,575 13,982
†
The main-segment O3’ and O5’ are obtained by 3 Euler rotation angles around P, so the total number of positions of O3’ and O5’ could be (360/10)3 = 4.7×10⁴.
3.2.2.4 Adjustment to avoid steric clashes
The conjugate gradient method described in Section 3.2.1.2 and 3.2.1.3 focuses on optimizing the geometry of dinucleotide but not steric clashes. Although in most cases, the optimized conformations are also clash-free, but some conformations may have steric clashes with other atoms and cannot be output. RNABC provides two flags, -ADJUSTSMALLCLASH and -ADJUSTCLASHBYCG, to try to remove steric clashes and preserve the geometry.
37
clash-free positions using geometric method. For hydrogen atoms, the maximum overlap for steric clash is limited to 0.45Å (default); for heavy atoms, the maximum overlap for steric clash is limited to 0.5Å (default). RNABC moves the atom position so that the new overlap is 0.39Å. For heavy atoms, RNABC moves the atom directly, but for hydrogen atoms, RNABC moves the heavy atom bonded with the hydrogen atom to keep the hydrogen geometry. For example, in Figure 3.4, atom C has steric clash with atom D. If C is a heavy atom, RNABC calculates the vector CD and move atom C to C’, and if C is a hydrogen atom, RNABC calculates the vector BD and move atom B to B’ so atom C moves to C’’. Since the adjustment is small, so it is highly possible that the standard deviations of influenced bond lengths and angles are still acceptable.
Figure 3.4 Examples of removing small steric clashes by geometry method
The flag -ADJUSTCLASHBYCG removes steric clashes by adding additional quartic function and rerunning the conjugate gradient method. The new quartic function is the same to the quartic function describing bond length or angle constraint (see Section 3.2.1.2) and the weight is assigned as 4.0 (default). Each steric clash is described by one quartic function. The initial value of d in the quartic function is set to the atom distance + 0.05Å (default) and if conjugate gradient method fails to remove the steric clash, RNABC increases the value of d by 0.02Å (default) and reruns the conjugate gradient method. The maximum runs of
conjugate gradient method are limited to 20 times (default).
C’’
B’ C C’
A
B
3.3 Results and Discussion
3.3.1
Running Time Performance
RNABC is tested on a desktop with a 3.0GHz Pentium 4 processor, 1GB memory and Windows XP operating system. I compare the current version with a preliminary version, which has been heavily tested on the performance and correcting steric clashes in RNA dinucleotide. The preliminary version uses exclusively forward kinematics method and runs in three steps. In the first step, it samples backbone conformation in two sub-steps: the first sub-step samples atom positions with steps of 5° and the second sub-step samples atom positions with steps of 1° in a ±2° span. Early rejection is used to speed up the program. In the second step, for each sextuple of backbone conformation, it uses geometric method to construct a sugar and satisfies all bond length and angle constraints. Various acceleration techniques are used to fast reject unfavorable sextuples and speed up the program.
![Table 2.1 Typical ranges of 6 nucleotide backbone dihedral angles [Murray03]](https://thumb-us.123doks.com/thumbv2/123dok_us/8282302.2193357/23.918.122.820.514.945/table-typical-ranges-nucleotide-backbone-dihedral-angles-murray.webp)
![Figure 2.7 A diagram of the small-probe contact dot algorithm. Image courtesy of the Richardson Lab [Word99a]](https://thumb-us.123doks.com/thumbv2/123dok_us/8282302.2193357/26.918.317.631.801.1012/figure-diagram-small-contact-algorithm-image-courtesy-richardson.webp)
![Figure 3.1 Selected all-atom-contacts in tr0002/1EVV (yeast phenylalanine tRNA [Jovine00]) at 2.0Å resolution (residues 28-32 and 40-44)](https://thumb-us.123doks.com/thumbv2/123dok_us/8282302.2193357/29.918.480.789.105.362/figure-selected-contacts-yeast-phenylalanine-jovine-resolution-residues.webp)