Dose-Duration Reciprocity for G protein
activation: Modulation of kinase to substrate
ratio alters cell signaling
Kang-Ling Liao1¤, Charles E. Melvin2, Rosangela Sozzani2, Roger D. Jones3, Timothy C. Elston4*, Alan M. Jones1,4*
1 Departments of Biology, University of North Carolina at Chapel Hill, Chapel Hill, NC, United States of
America, 2 Department of Plant and Microbial Biology, North Carolina State University, Raleigh, NC, United States of America, 3 Center for Complex Systems and Enterprises, Stevens Institute of Technology, Hoboken, NJ, United States of America, 4 Department of Pharmacology, University of North Carolina at Chapel Hill, Chapel Hill, NC, United States of America
¤ Current address: Department of Mathematics, Tamkang University, New Taipei City, Taiwan *[email protected](AM);[email protected](TC)
Abstract
In animal cells, activation of heterotrimeric G protein signaling generally occurs when the system’s cognate signal exceeds a threshold, whereas in plant cells, both the amount and the exposure time of at least one signal, D-glucose, are used toward activation. This unusual signaling property called Dose-Duration Reciprocity, first elucidated in the genetic model
Arabidopsis thaliana, is achieved by a complex that is comprised of a 7-transmembrane
REGULATOR OF G SIGNALING (RGS) protein (AtRGS1), a Gαsubunit that binds and hydrolyzes nucleotide, a Gβγdimer, and three WITH NO LYSINE (WNK) kinases. D-glu-cose is one of several signals such as salt and pathogen-derived molecular patterns that operates through this protein complex to activate G protein signaling by WNK kinase trans-phosphorylation of AtRGS1. Because WNK kinases compete for the same substrate, AtRGS1, we hypothesize that activation is sensitive to the AtRGS1 amount and that modu-lation of the AtRGS1 pool affects the response to the stimulant. Mathematical simumodu-lation revealed that the ratio of AtRGS1 to the kinase affects system sensitivity to D-glucose, and therefore illustrates how modulation of the cellular AtRGS1 level is a means to change sig-nal-induced activation. AtRGS1 levels change under tested conditions that mimic physiolog-ical conditions therefore, we propose a previously-unknown mechanism by which plants react to changes in their environment.
Introduction
Extracellular signals such as hormones are perceived by cell-membrane receptors. The exis-tence of an extracellular signal molecule, such as a hormone or a neurotransmitter, causes the receptor to act on molecules internal to the membrane such as the heterotrimeric G protein complex. When activated by the receptor, the heterotrimeric G protein complex, which
a1111111111 a1111111111 a1111111111 a1111111111 a1111111111 OPEN ACCESS
Citation: Liao K-L, Melvin CE, Sozzani R, Jones
RD, Elston TC, Jones AM (2017) Dose-Duration Reciprocity for G protein activation: Modulation of kinase to substrate ratio alters cell signaling. PLoS ONE 12(12): e0190000.https://doi.org/10.1371/ journal.pone.0190000
Editor: Srinivasa M. Srinivasula, Indian Institute of
Science Education and Research, INDIA
Received: July 17, 2017
Accepted: December 6, 2017
Published: December 29, 2017
Copyright:©2017 Liao et al. This is an open access article distributed under the terms of the
Creative Commons Attribution License, which permits unrestricted use, distribution, and reproduction in any medium, provided the original author and source are credited.
Data Availability Statement: All data are contained
within the paper and its Supporting Information files.
Funding: This work was supported by grants from
associates with the receptor on the cytoplasmic side of the membrane, exchanges bound GDP for GTP [1,2]. The complex is then available to interact with cellular components that confer a particular cell behavior such as muscle contraction or altered metabolism [3–5]. The G protein has an intrinsic GTP hydrolysis activity that returns the G protein to its GDP-bound, inactive state ready to cycle again if the signal remains above its threshold. In animal cells, this G pro-tein cycle is rate limited by guanine nucleotide exchange, a property controlled by the signal and its receptor. However, in plant cells and protists, nucleotide exchange is spontaneous; rather GTP hydrolysis is the rate-limiting step in the G protein cycle. Modulation of the G pro-tein cycle is through a 7-transmembrane receptor that keeps the G propro-tein complex in its inac-tive state [6–9]. Extracellular signals de-repress activation leading to spontaneous nucleotide exchange and thus activation. The prototype receptor is Arabidopsis Regulator of G Signaling (AtRGS1) and shown to be a shadow detector controlling the efficiency of photosynthesis probably through detection of fixed sugar amount and duration [10]. AtRGS1 is an important G protein element in extracellular glucose signaling and is a strong candidate as the extracellu-lar glucose receptor of co-receptor [4,11–16].
One mechanism by which plant cells de-repress the G protein cycle is to internalize AtRGS1 from the cell surface, leaving behind the G protein complex to self- activate [4]. Acti-vation is quantitated using cells expressing AtRGS1 tagged with fluorescent YFP. This data was used to fit a mathematical model describing an emergent property whereby a low dose of signal presented to the cell over a long period of time activated as well as a high concentration presented as a short pulse. This unique property was designated Dose-Duration Reciprocity [15]. The mathematical model predicted that the plant G protein system included two different kinases operating with different time constants and sensitivity to glucose. These two kinases were identified as WITH NO LYSINE (WNK) kinases, WNK1 and WNK8/10 where WNK1 (kinase 2) controls the slow reaction and WNK8 and WNK10 kinases (kinase 1) were assumed to be redundant in controlling the fast reaction however they may not be. These WNK kinases phosphorylate AtRGS1, a key reaction controlling the amount of the receptor, therefore it is essential to incorporate our understanding of the total amount of AtRGS1 and the ratio of kinases to this receptor to predict signal-induced behavior involving the G protein elements.
The effect of receptor levels on signal-induced behavior is not new. In 1957, Nickerson applied histamine to a guinea pig ileum preparation to show that a maximum contraction was produced when agonist occupied only a small percent of histamine receptors [6]. Similar behavior occurred in the rabbit aortic strips [17]. Consequently, by the 1970’s, the concept of “spare receptor” was evoked to explain why the half-maximal effective concentration (EC50) of a hormone was lower than the concentration causing half maximal receptor occupancy (Kd) [18]. In these cases, the rate-limiting step occurs downstream to receptor binding. However, while a rate-limiting step distil to receptor binding was easy enough to understand at the time, a different emergent systems property for spare receptors was not understood. Specifically, early researchers noted that as the amount of receptor increased, the system became more sensitive.
To understand how this occurs, consider the following hormone interaction:
HþR⇄k1
k2 HR
where [H], [R], and [HR] are concentrations of hormone, unbound receptor, and bound receptor, respectively, and the association and dissociation ratesk1andk2. At the equilibrium, we have the relation that [HR] = (k1/k2) [H][R], which means that the more spare receptor R present, the more HR will form at a relatively lower [H]. Consequently, “spare receptors” are not actually spare. Controlling the amount of receptor is a mechanism to control sensitivity.
A.M.J. funded the plant-based experimental part of this project.
Competing interests: The authors have declared
A similar behavior may occur in G protein activation via regulation of the AtRGS1 pool size, therefore we investigated whether the amount of the total AtRGS1 pool size changes the responsiveness to glucose in Arabidopsis. To quantitate this, we used AtRGS1-YFP endocyto-sis because it is the current standard method used to report G protein activation. Unfortu-nately, expression of AtRGS1-YFP, by its nature, increases the pool of AtRGS1 and thus is a perturbation on the system [15]. Therefore, in order to understand how AtRGS1 modulates G activation in the unperturbed state, we determined how in quantitative terms that the total level of AtRGS1 affects the system responsiveness to glucose. We showed that even a modest change in the AtRGS1 pool size changes responsiveness from linear to non-responsive or vice versa depending on the direction of change in pool size. We found physiological conditions where the AtRGS1 pool size changes suggesting a mechanism for natural control of glucose signaling.
Materials and methods
Plant growth and genotypes
Stable lines expressing YFP driven by the 35S promoter, namely, 35S::AtRGS1-YFP (denoted as 35S-YFP) and AtRGS1 tagged with YFP driven by the native RGS1 promoter (denoted as RGS1-YFP) were used in the AtRGS1 endocytosis and AtRGS1 expression level experiments.
Arabidopsis seeds expressing AtRGS1-YFP from its native promoter or YFP from the 35S viral promoter were sterilized with ethanol (first with 70%, 10 min, 95% 10 min). Ten to 20 seeds were then sown on 1-mL liquid 1/4 X Murashige and Skoog (MS) medium without sucrose in 24-well plates and stratified at 5˚C for 2 days, followed by 2 hours light, then grown in darkness at 27˚C for 4 days. For best results, keep the plates kept in darkness but move them to the microscope room on the third day to acclimate. Homozygouswnk1,wnk8-2,
andwnk10-1null mutants were generated from T-DNA insertion mutants (SALK_015778,
SALK_024887, and SALK_012899) [3]. All DNA-insertion lines were made homozygous and the T-DNA insertions were confirmed by PCR of genomic DNA with the following table for primer sets (Table 1).
Experimental design and image acquisition
Before taking images, the seedling was moved to a well with 2-mL sterile water for 5–10 min-utes to wash out the MS salts. For the glucose-induced endocytosis experiment, after this wash the seedlings (wild type,wnk8/10 null mutant, andwnk1 null mutant) were gently placed into another well containing D-glucose, with a dwell time of 1 min between each seedling, and then moved onto one slide for image acquisition. For the AtRGS1 endocytosis fraction, the image was taken at the vertical optical sections (i.e. Z stacks acquired) of hypocotyl epidermal cells located approximately 3–4 mm from the cotyledon. For AtRGS1-YFP fluorescence intensity quantitation, seedlings were washed and moved to a slide with 100 mM NaCl, 100 mM
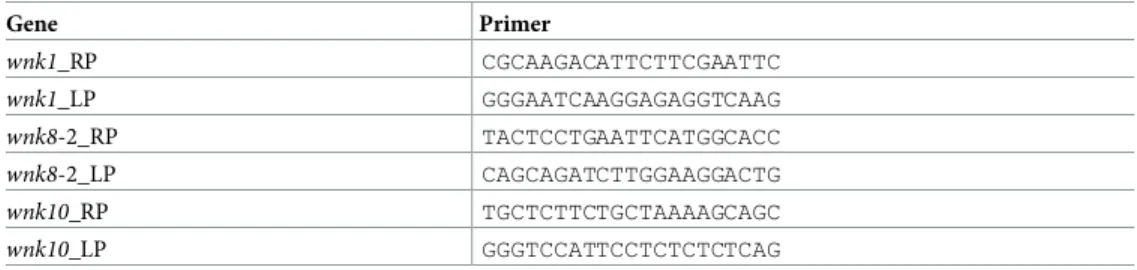
Table 1. Primers used for genotyping.
Gene Primer
wnk1_RP CGCAAGACATTCTTCGAATTC
wnk1_LP GGGAATCAAGGAGAGGTCAAG
wnk8-2_RP TACTCCTGAATTCATGGCACC
wnk8-2_LP CAGCAGATCTTGGAAGGACTG
wnk10_RP TGCTCTTCTGCTAAAAGCAGC
wnk10_LP GGGTCCATTCCTCTCTCTCAG
sorbitol, 100 mM flg22, water, or 2% D-glucose, and left on the microscope stage over the time course of image acquisition. The hypocotyl epidermal cells imaged were taken at the vertical optical sections (i.e. Z stacks acquired) located 2–4 mm below the cotyledons.
Microscopy
A Zeiss LSM710 confocal laser scanning microscope with a C-Apochromat 40X 1.2N.A. water immersion objective was used to quantitate the proportion of internalized AtRGS1. The YFP fluorescence was excited by a 514-nm argon laser and the photomultiplier detector was set between 526 nm and 569 nm for quantification. The proportion of internalized AtRGS1 was analyzed by Image J. Illumination was as short as possible to avoid heating or photobleaching.
To quantitate the relative amount of AtRGS1 over time after treatment, imaging was per-formed using light sheet fluorescence microscopy (Zeiss Lightsheet Z.1) and the Multi-sample Arabidopsis Growth and Imaging Chamber (MAGIC) (de Luis Balaguer et al. 2016). Lines 35S-YFP and RGS1-YFP were prepared as described in de Luis Balaguer et al. [19]. 35S-YFP roots were used as the control for the D-glucose treatment. Six and eight roots of the 35S-YFP and RGS1-YFP, respectively, were loaded into a MAGIC device and imaged every 15 minutes in deionized water (first 15’) and then with a 6% D-glucose solution (from 15’ to 165’) (Sigma G8270). Due to differing optical properties of the deionized water and the D-glucose solution, the lightsheet was realigned between treatments. Laser (488 nm) and bright field intensities remained constant between the deionized water and D-glucose phases of the experiment. The Lightsheet Z.1 native incubator was used to keep the imaging chamber at 22ºC throughout the experiment. For the analysis, the maximum intensity projections were generated using Zeiss Zen Black edition (Zen 2014 SP1) and exported as tiff images using Zen 2.3 lite. The average pixel intensity of the images was processed in MATLAB (See Supplement-Matlab Code,S1 File). Briefly, a mask was applied to remove the image background of the maximum intensity projections of each root, leaving only pixels containing root. The average intensity of the pixels corresponding to the root were calculated.
Mathematical model
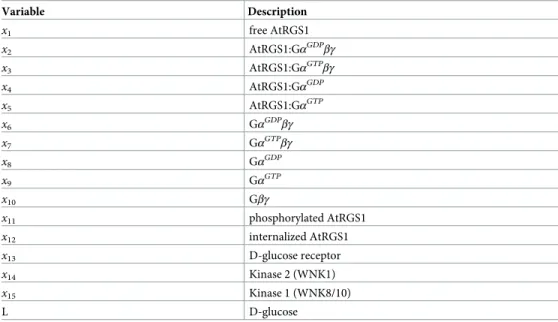
Variables of the model (Table 2). Glucose-input model.
dx1
dt ¼ k17x1x7 k18x1x9 k12x1þk24x5þk25x3þk27x12 ð1Þ
dx2
dt ¼k4x3þk8x4x10 k6x2 k16x2 ð2Þ
dx3
dt ¼k6x2 k4x3 k11x3 xk14
13
kk14
26 þx
k14
13
k25x3þk17x1x7þk13x5x10 ð3Þ
dx4
dt ¼k4x5 k6x4 k8x4x10þk16x2 ð4Þ
dx5
dt ¼k6x4þk11x3 xk14
13
kk14
26 þx
k14
13
k4x5 k3x5ðx14þx15Þ þk30x11þk18x1x9 k2x5
k24x5 k13x5x10
dx6
dt ¼k5x7þk7x8x10 k6x6 k28x6 ð6Þ
dx7
dt ¼k6x6 k5x7 k10x7 k17x1x7þk9x9x10þk25x3 ð7Þ
dx8
dt ¼k5x9þk28x6 k6x8 k7x8x10 ð8Þ
dx9
dt ¼k20x11þk6x8þk10x7 k5x9 k18x1x9 k9x9x10þk2x5þk24x5 ð9Þ
dx10
dt ¼k10x7þk11x3 xk14
13
kk14
26 þx
k14
13
k8x4x10 k7x8x10 k9x9x10þk28x6 k13x5x10þk16x2 ð10Þ
dx11
dt ¼k3x5ðx14þx15Þ k20x11 k30x11 ð11Þ
dx12
dt ¼k2x5þk12x1þk20x11 k27x12 ð12Þ
dx13
dt ¼k15ðL x13Þ ð13Þ
dx14
dt ¼
k1ð k21x
2 10 k2
22þx210
x14Þ; two kinase model
0; one kinase model
ð14Þ
8 > <
> : Table 2. Variables of the model.
Variable Description
x1 free AtRGS1
x2 AtRGS1:GαGDPβγ
x3 AtRGS1:GαGTPβγ
x4 AtRGS1:GαGDP
x5 AtRGS1:GαGTP
x6 GαGDPβγ
x7 GαGTPβγ
x8 GαGDP
x9 GαGTP
x10 Gβγ
x11 phosphorylated AtRGS1
x12 internalized AtRGS1
x13 D-glucose receptor
x14 Kinase 2 (WNK1)
x15 Kinase 1 (WNK8/10)
L D-glucose
dx15 dt ¼k19ð
k23x 2 10 k2
29þx210
x15Þ ð15Þ
Conservation laws. For the model in Eqs (1–15), summing all equations related to the AtRGS1 complex, one obtains:
ðdx2
dt þ dx3 dt þ dx4 dt þ dx5 dtÞ þ ð
dx1
dt þ
dx11
dt þ
dx12
dt Þ ¼0; for allt0; ð16Þ
which represents that the total level of AtRGS1 over time. Similarly, summing up all equations related to GPA1 and AGB and AGG complexes, one obtains:
ðdx2
dt þ dx3 dt þ dx4 dt þ dx5 dtÞ þ ð
dx6 dt þ dx7 dt þ dx8 dt þ dx9 dtÞ þ
dx11
dt ¼0; for allt0; ð17Þ
and dx2 dt þ dx3 dt þ dx6 dt þ dx7 dt þ dx10
dt ¼0; for allt0; ð18Þ
which represents the total amount of GPA1 and AGB and AGG complexes, respectively, over time.
Results
The importance of the AtRGS1 substrate to WNK kinase ratio
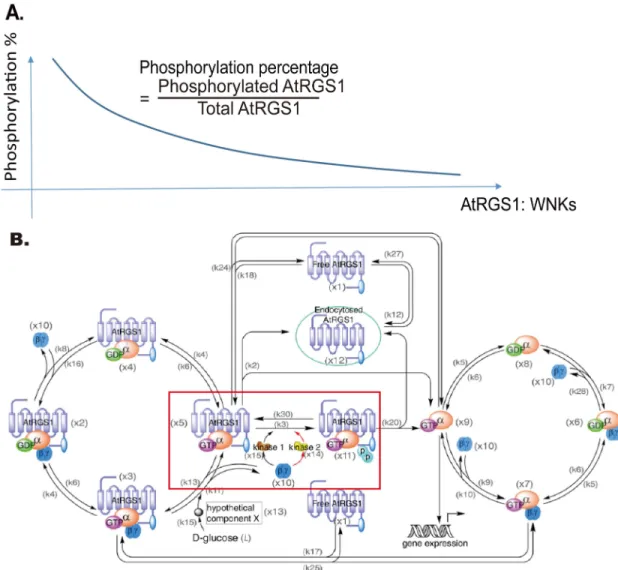
Our hypothesis is that the total AtRGS1 level affects glucose responsiveness as determined by AtRGS1-YFP endocytosis because the competition between WNKs kinases depends on the AtRGS1 pool size. The G protein signaling pathway requires kinases having different reaction rates in order to respond to signal intensity and duration [15]. As for any enzyme-substrate relationship, the ratio of AtRGS1 and WNKs kinases is important.Fig 1Aillustrates our hypothesis that the phosphorylation proportion, a proxy for activation, is a function of the ratio of AtRGS1-YFP level and WNKs kinases. A high AtRGS1 level predicts a low phosphory-lation proportion, thus activation, whereas a low AtRGS1 pool size with fixed amount of the WNKs kinases predicts a high proportion of activation. Therefore, we chose to simplify by modeling only the relevant kinase-AtRGS1 reactions in the Dose-Duration Model as shown in the red box inFig 1B. Variables used in the model are provided inTable 2.
Next, we explored the relationship of AtRGS1 levels on glucose-induced activation of G signal-ing in the model [15]. This model (Fig 1B) is a closed system obeying conservation laws for AtRGS1, AtGPA1, and AGB/AGG complexes. The constant amount of AtRGS1, AtGPA1, and AGB1/AGG are denoted asC1,C2, andC3, respectively. To test whether AtRGS1 pool size (i.e.,
C1) affects D-glucose-induced AtRGS1-YFP endocytosis, we simulated the proportion of internal-ized AtRGS1 at different AtRGS1 levels, i.e., at differentC1 values. As shown inFig 2, the propor-tion of internalized AtRGS1 was sensitive toC1. Fu and co-workers [5] set C1 = 5.2× 10⁴ molecules in their simulations. Therefore, we randomly chose initial values such that
C12 ½3:7104
; 6:8104
molecules
andC1 =C2 (as the set in [5]) andC3 = 5.1× 10⁴molecules for wild type (as the set in [5]),
The proportion of AtRGS1 internalization and thus the amount of G signaling activation after glucose depends onC1. The raw data supporting this is illustrated by heat maps inFig 2A and 2Cdisplaying the proportion of internalized AtRGS1 of wild type at 0% (water only), 2%, and 6% D-glucose whenC12[3.7×10⁴, 6.8×10⁴] molecules. Another way to illustrate this prop-erty is to plot the proportion of AtRGS1 over time at just three members of theC1 set. The solid, dotted, and dashed lines inFig 2A and 2Cdenote, respectively, a lowC1 value (i.e., solid lineC1 = 4×10⁴molecules), a mediumC1 value (i.e., dotted lineC1 = 5×10⁴molecules), and a highC1 value (i.e., dashed lineC1 = 6×10⁴molecules).Fig 2D and 2Fplot the values repre-sented by the respective heat map inFig 2A and 2Cas a function of time after water (no-glu-cose control) or the addition of glu(no-glu-cose. Without glu(no-glu-cose, the values remained constant, but the constant depended onC1 (cf.Fig 2A and 2D). Upon glucose stimulation, the relation betweenC1 and the proportion of internalized AtRGS1 became nonlinear in that the propor-tion of internalized AtRGS1 did not always increase asC1 increased. For example, after 2% Fig 1. Hypothesis: AtRGS1 phosphorylation proportion and endocytosis depend on the AtRGS1 level. The hypothesis is that the AtRGS1 level affects the phosphorylation percentage in G protein signaling pathway and the level of activation of the G protein pathway. (A). The relationship between phosphorylated AtRGS1 and the ratio AtRGS1:WNK kinases. The natural variation in expression levels among transformed cells will be used to test this hypothesis. (B). Network of G protein signaling pathway. This model is taken from Fu, et al 2014. The added red box marks the process affected by our hypothesis.
glucose treatment (Fig 2E), cells with lower AtRGS1 level had a lower proportion of internal-ized AtRGS1 than cells with higher AtRGS1 level before 10 minutes, but this relation reversed after 10 minutes (the solid and dashed curves inFig 2B and 2E). A similar behavior occurred after 6% glucose treatment (cf.Fig 2C and 2F). This indicates that the system is sensitive toC1; a difference inC1 as small as 20% altered the glucose responsive. Moreover, as shown inFig 2D and 2F, at the higher AtRGS1 level (i.e., dashed curves) the system was less sensitive to glu-cose treatment because the system was close to saturation, such that gluglu-cose induced a lower proportion of internalized AtRGS1 than the system having a lower AtRGS1 level (i.e., solid curves).
Previous published works have not taken into consideration the effect ofC1 or the ratio of AtRGS1:WNK on glucose activation. For example, to fit the original model, Fu and coworkers [15] used experimental data obtained from a genetically stable plant line that constitutively overexpressed AtRGS1-YFP but for testing and subsequent validation, they used data obtained from transient expression in thewnknull mutants. This difference is important because tran-sient expression generally produces a higher AtRGS1 level than expression in genetically stable lines. Fu et al reported that thewnk1 null mutation only reduced endocytosis at low dose/high duration of glucose compared to wild type, whereas thewnk8/10 null mutations only reduced endocytosis at high dose/short duration of glucose.
As shown inFig 1A, it is now clear that endocytosis is dependent on the AtRGS1:WNK kinase ratios. Therefore, whether or not thewnknull mutations alter the sensitivity to glucose also depends on the AtRGS1 level and which WNK kinases is genetically ablated. This was tested. For thewnk8/10null mutations, the difference in the proportion of internalized AtRGS1 between wild type and thewnk8/10 mutant under high glucose concentration (i.e., 6% glucose) was small when the AtRGS1 level was low (Fig 2G, black and blue solid curves, 6%), but this difference increased as the AtRGS1 level increased (Fig 2G, black and blue dotted curves). However, this relation between wild type andwnk8/10 mutant was reversed under low glucose concentration (i.e., 2% glucose) inS1A Fig. For thewnk1null mutation, the rela-tion between wild type and thewnk1null mutant reversed under low glucose concentration, i.e., 2% glucose (Fig 2H). A similar relationship between wild type and thewnk1 null mutant occurred at high glucose concentration, i.e., 6% glucose, inS1B Fig. Note that the difference in the proportion of internalized AtRGS1 between wild type andwnk1 null mutant decreased as the AtRGS1 level increased (Fig 2H, black and magenta dotted curves). The AtRGS1 endocyto-sis dynamics in thewnk8/10 andwnk1 null mutants withC12[3.7×10⁴, 6.8×10⁴] molecules under different D-glucose treatment are provided inS2 Fig. The results of this simulation Fig 2. Relationship between AtRGS1 endocytosis and the AtRGS1 level in wild type. (A-C). The heat map of the proportion of internalized AtRGS1 under water, 2%, and 6% D-glucose treatment for the cells with AtRGS1 level whereC12[3.7×10⁴
, 6.8×10⁴] molecules, by numerical simulation of the mathematical model and setting used by [15].
The color bar shown on the top represents the proportion of internalized AtRGS1 value ranging from blue (0.00) to yellow (1.00). In (A-C), the proportion of internalized AtRGS1 increases as time increases, however, the relation between the proportion of internalized AtRGS1 and AtRGS1 level (C1) is nonlinear. (D-F). AtRGS1 endocytosis dynamics within the first 40 minutes of water- and glucose-treated cells with low, moderate, and high AtRGS1 levels in panels (A-C). D. Water treated controls. E. 2% D-glucose. F. 6% D-glucose. Curves are for different AtRGS1 levels: Solid line (C1 = 4×10⁴molecules), dotted line (C1 = 5×10⁴molecules), and dashed lines (C1 = 6×10⁴molecules) as illustrated in panels A-C. Red arrow heads mark the tested time points discussed inFig 3. (G-H). Comparison of the proportion of internalized AtRGS1 in wild type,wnk8/10, andwnk1 null mutants under different AtRGS1 levels after high and low D-glucose concentration treatment. (G). Wildtype, black solid (C1 = 4×10⁴molecules) and dotted
(C1 = 5×10⁴molecules);wnk8/10mutant, blue solid (C1 = 4×10⁴) and dotted (C1 = 5×10⁴) curves represent the proportion of internalized AtRGS1 after 6% D-glucose treatment over 40 minutes. (H). Wildtype, black solid (C1 = 4×10⁴molecules) and dotted (
C1 = 5×10⁴molecules);
wnk1mutant, magenta solid (C1 = 4×10⁴) and dotted
(C1 = 5×10⁴) curves represent the proportion of internalized AtRGS1 after 2% D-glucose treatment over 120 minutes.
supports our hypothesis that the AtRGS1 level affects the cellular response to glucose and also emphasizes the importance of knowing the expression level of the AtRGS1-YFP reporter in making conclusions on activation of the G protein pathway.
G signaling dynamics under different AtRGS1 and WNK kinase levels. To test the
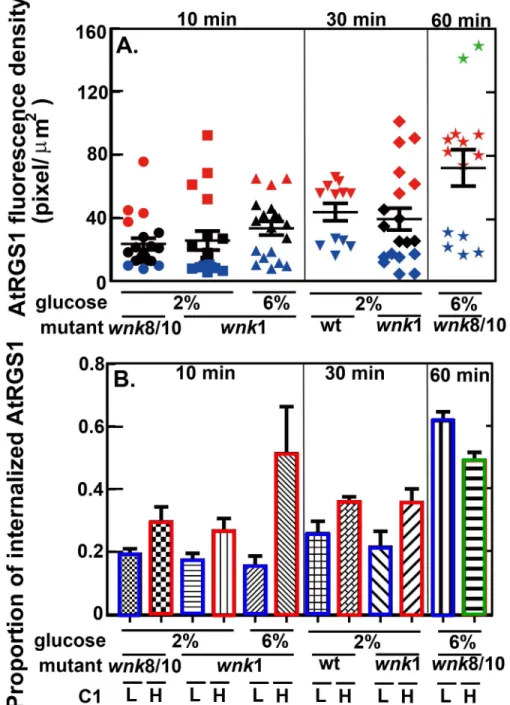
model, we measured the proportion of internalized AtRGS1 in cells with different AtRGS1 lev-els (Fig 3A). This experiment was performed in the following way: First, the natural variation of AtRGS1-YFP fluorescence densities was separated into four groups: relatively high density (green symbols), medium density (red symbols), intermediate (black symbols), and low den-sity (blue symbols). Second, cells were treated with glucose and the proportion of internalized AtRGS1 was quantified.
The model predictions inFig 2(for wild type) andS1 Fig(forwnk8/10 andwnk1 null mutants) showed that the relationship between endocytosis and the AtRGS1 level was nonlin-ear, namely, cells expressing the higher AtRGS1 level did not always have a higher proportion of AtRGS1-YFP endocytosis than the cells expressing the lower level. This was validated by the experimental results shown inFig 3Bin which AtRGS1 fluorescence intensity correlated with AtRGS1 level (Fig 3A). Three key observations validate the model simulation: 1) In thewnk8/ 10 mutant treated with 6% glucose for 60 min, there was a lower proportion of internalized AtRGS1 in cells with higher AtRGS1 levels compared to lower levels as predicted (S1F Fig; cf. solid to dash curves). 2) Regardless of the genotype at a low dose of glucose, there was a higher proportion of internalized AtRGS1 in cells with a higher level of AtRGS1 (Fig 3, 2% values) as predicted (Fig 2E, red arrow heads [cf. dash vs dotted curves];S1K Fig, red arrowheads [dashed vs dotted curves];S1E Fig, red arrowheads [dashed vs. dotted curves]). 3) In thewnk1
mutant treated with 6% glucose for 10 min, there was a higher proportion of internalized AtRGS1 in cells with a higher level of AtRGS1 (S1L Fig, red arrowheads [dashed vs dotted curves]).
This nonlinear relation between AtRGS1 level and glucose activation of G signaling may be caused by saturation of the AtRGS1-kinase reaction. For cells with a lower AtRGS1 level (i.e., the solid curves inFig 2andS1 Fig), the WNK kinases may have a better efficiency or sensitiv-ity to interact with AtRGS1 and hence the cells internalize more AtRGS1 than the cells with a higher AtRGS1 level.
AtRGS1 levels change under different physiological conditions
Fig 3. Experimental testing of the mathematical model.C1 affects glucose-induced AtRGS1 endocytosis dynamics. Proportion of glucose-induced AtRGS1-YFP endocytosis that occurred with different starting levels of AtRGS1 binned based on YFP fluorescence intensity. For these experiments, AtRGS1-YFP was driven by the 35S viral promoter and the natural variation in expression level was utilized. (A). The AtRGS1 fluorescence intensity distribution for wild type andwnknull mutants under different D-glucose treatments and times were binned accordingly: green, highest AtRGS1 intensity; red, moderate intensity; black intermediate intensity; blue, lowest intensity. Quantitation was performed using cells from the indicated genotypes. Each symbol represents the AtRGS1 fluorescence intensity for a single cell. Intensity is correlated with AtRGS1 level (C1 in the conservation law). (B). The proportion of internalize AtRGS1at three times corresponded to the cells with binned high and low AtRGS1 fluorescence intensity shown in panel A. Left panel,wnk8/10 null mutant under 2% glucose treatment,wnk1 null mutant under 2% glucose treatment, andwnk1 null mutant under 6% glucose treatment for 10 min; Middle panels, wild type andwnk1 null mutant under 2% glucose treatment for 30 min; Right panel,wnk8/10 null mutant under 6% glucose treatment for 60 min. Each group is separated into four groups: high, moderate, intermediate, and low AtRGS1 intensity, which were marked by green, red, black, and blue symbols based on the intensity shown in A. Experimental results fit the model predictions and are discussed.
AtRGS1 level by NaCl increased the sensitivity of endocytosis to glucose (namely, the propor-tion of internalized AtRGS1 is predicted to increase (seeFig 2). This result also suggest that there is a de-sensitization mechanism to glucose whereby glucose increases the level of AtRGS1 over time leading to reduced glucose sensitivity. The bacterial plant pathogen elicitor, flg22, a 22-amino acid peptide from the bacterial flagellin induces RGS1 endocytosis [23,24]. We tested if a high concentration (100 mM) caused a change in the AtRGS1 level and did not observe a statistically-significant difference (p-value was around 0.02) over the 30 minute time course (S3 Fig).
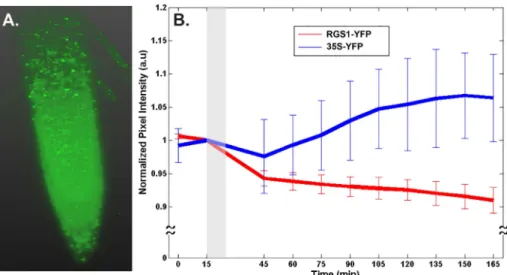
An alternative method was used to quantitate changes in AtRGS1-YFP level after glucose treatment. Lightsheet microscopy has the advantage in that photobleaching is negligent. More-over, the increased detection sensitivity of Lightsheet microscopy enabled us to quantitate changes in AtRGS1-YFP when expressed by its native gene promoter (Fig 5) compared to higher expression by the 35S promoter (Fig 4) required to detect AtRGS1-YFP by confocal microscopy (Fig 4). The root tip of a seedling expressing AtRGS1-YFP at its native level is shown inFig 5A. The intensity of YFP was captured every 15 min. As expected due to ectopic expression by the 35S promoter, the YFP control, although variable, showed an increase over time (P = 0.016). During glucose application (grey zone,Fig 5), there was a decrease in both the 35S-YFP control and the RGS1-YFP lines. This a solution-changing artifact. There was no difference in the slope before vs. after glucose application for the 35S-YFP control (P = 0.5). In contrast to the 35S-YFP control, the intensity of the AtRGS1-YFP protein was much less Fig 4. Two physiological conditions alter the level of AtRGS1 (C1 in the model). Panels show the change in AtRGS1 intensity over 90 minutes after treatment with 100 mM NaCl treatment (A), 100 mM D-Sorbitol (B), water (C), and 110 mM (2%) D-glucose (D). The image was taken every 30 minutes at the same location of the same seedlings over 90 min in (A-D). In (A), after 100 mM NaCl treatment, the AtRGS1-YFP intensity significantly decreased over 90 minutes. In (B) and (C), the AtRGS1-YFP intensity in the controls (i.e., 100 mM D-Sorbitol and water) was constant over 90 minutes. In (D), after 110 mM D-glucose treatment, the AtRGS1 density significantly increases after 60 minutes treatment. This suggests that the nutritional state of the plant cell affects the AtRGS1 level. For these experiments, AtRGS1-YFP was driven by the 35S viral promoter.
variable and clearly decreased over the entire time course (P = 1.69632×10⁻⁹). After switching from water to 6% glucose, the decrease in the intensity of AtRGS1-YFP was 2-3-fold less than during the water treatment (P = 0.1). Thus is contrast to hypocotyl cells expressing a higher proportion of AtRGS1 where glucose causes a decrease in the AtRGS1-YFP pool. Root cells expressing the native level of AtRGS1 stabilize the AtRGS1-YFP pool over 2 hours.
In order to distinguish the relative expression level, the following method and standard was adopted: the AtRGS1 level was measured to determine whether over expressing AtGRS1 altered the AtRGS1 level. InFig 6, we measured the AtRGS1 level in the root using the native AtRGS1 promoter (RGSp,Fig 6) and compared this to expression at different locations of the root with the 35S promoter (35S,Fig 6). With two exceptions, the native AtRGS1 gene pro-moter (RGSp,Fig 6) was insufficient to detectably drive expression of AtRGS1-YFP. However, YFP fluorescence in some cells in the elongation zone and the root cap (Fig 6A) were detect-able. This enabled estimation of the relative level of endogenous AtRGS1 to the amount of AtRGS1-YFP driven by the 35S promoter in the stable lines (35S,Fig 6B and 6C) under water and 6% glucose treatment, respectively. The ratio of AtRGS1 level between 35S-YFP at any region (i.e., root cap, elongated zone, and hypocotyl) and AtRGS1-YFP at the elongated zone and root cap was ~4. The later assay utilized the native level of AtRGS1 while the former uti-lized approximately a four-fold higher level of AtRGS1 (in the form of the AtRGS1-YFP reporter) shown inFig 6B and 6C.
Discussion
We tested the hypothesis that the AtRGS1 pool size modulates D-glucose-induced AtRG-S1-YFP endocytosis, a cellular marker for sustained G protein activation (Fig 1). Our model predicted a nonlinear relationship between the AtRGS1 level and AtRGS1-YFP endocytosis (Fig 2); specifically that the system was less sensitive to glucose treatment when the system had higher AtRGS1 levels.
Changes in AtRGS1 level may occur in nature because we showed experimentally that the AtRGS1 level changes with NaCl and D-glucose treatments (Figs4and5). This is a newly-Fig 5. D-glucose treatments decrease the level of AtRGS1. (A). 3D reconstruction of AtRGS1-YFP translational fusion within the root tip as imaged in the Zeiss Lightsheet Z.1. (B). Quantitation of the normalized pixel intensity of 6 and 8 biological replicates of 35S-YFP and RGS1-YFP, respectively. Grey bar represents the D-glucose treatment time and error bars represent standard deviations.
Fig 6. AtRGS1 level driven by the native and a strong viral gene promoter. AtRGS1 expression was driven by its native promoter (AtRGS1-YFP) or the 35S Califlower Mosaic Viral promoter (35S-YFP) in roots/hypocotyl cells treated with water for 30 minutes (B) and treated with 6% D-glucose for 1 hour (C). Both ofAtRGS1-YFPand35S-YFP
have 1 gene copy. (A). The corresponding regions of the seedling are: hypocotyl (Hyp), elongation zone (EZ), and root cap (RC) inArabidopsis. (B). Under water treatment, the AtRGS1 expression density of 35S-YFP in the elongation zone (35S_EZ), root cap (35S_RC), and hypocotyl (35S_Hyp) is around 4 to 6 fold of the AtRGS1 level of AtRGS1-YFP in elongation zone (RGSp_EZ). (C). Under 6% D-glucose treatment for 1 hour, both AtRGS1 expression density of AtRGS1-YFP and 35S-YFP in the root cap increases, but the ratio between RGSp_RC and 35S_RC is still around 4 fold. Note that the 6% D-glucose treatment does not change the AtRGS1 expression density of 35S-YFP in hypocotyl.
discovered mechanism by which plant cells control glucose responsiveness through the G pro-tein pathway. Our findings also provide a mechanism by which the nutrient state of the cell affects important signaling pathways. For example, glucose via the G protein signaling pathway improves plant survival under salt stress [21]. Glucose also enhances hypocotyl and root elon-gation through the brassinosteroid pathway [23,24], promotes defense against pathogens by the innate immunity pathway [25,26], and affects root partitioning through the auxin pathway [27].
How do these changes affect the rapid dynamics of Dose-Duration Reciprocity? Because the change in AtRGS1 is small but significant over two hours (Figs4and5), the early dynamics of the Dose-Duration Reciprocity model is unaffected and therefore, a closed-system model remains suitable for predicting the rapid changes in the model components. However, over longer time spans such as the course of a solar day, the changes in the amount of AtRGS1 are expected to be in the range that we show here to affect the sensitivity. Over a long period, Does-Duration Reciprocity is better described mathematically by an open-system model.
Supporting information
S1 Fig. Comparison of the proportion of internalized AtRGS1 in wild type,wnk8/10, and
wnk1 null mutants. (A), 2% glucose. Wildtype, black solid (C1 = 4×10⁴molecules) and dotted (C1 = 5×10⁴molecules);wnk8/10mutant, blue solid (C1 = 4×10⁴) and dotted (C1 = 5×10⁴) curves represent the proportion of internalized AtRGS1 after 2% D-glucose treatment over 40 minutes. (B) 6% glucose. Wildtype, black solid (C1 = 4×10⁴molecules) and dotted (C1 = 5×10⁴ molecules);wnk1mutant, magenta solid (C1 = 4×10⁴) and dotted (C1 = 5×10⁴) curves repre-sent the proportion of internalized AtRGS1 after 6% D-glucose treatment over 120 minutes. (TIF)
S2 Fig. Heat map of proportion of internalized AtRGS1 inwnkmutants under different
AtRGS1 levels. This figure supportsFig 3. This figure shows the heat map of the proportion
of internalized AtRGS1 in thewnk8/10 null mutant (A-C) andwnk1 null mutant (G-I), under water (top row), 2% (middle row), and 6% (bottom row) D-glucose treatment, when the AtRGS1 levelC1 is between [3.7×10⁴, 6.8×10⁴] molecules. The color bar shown at the top rep-resents the proportion of internalized AtRGS1 value ranging from 0.00 (blue) to 1.00 (yellow). Similar to wild type inFig 2, the proportion of internalized AtRGS1 is nonlinearly dependent on the AtRGS1 level. (D-F). The time course is 60 minutes for thewnk8/10 null mutants with low, moderate, and high AtRGS1 level in (A-C). (J-L). The time series within 60 minutes of the
wnk1 null mutants with low, moderate, and high AtRGS1 level in (G-I). In (D-F) (resp. (J-L)), the solid curves, dotted curves, and dashed curves represent the solid line (i.e., C1 = 4×10⁴ molecules), dotted line (i.e., C1 = 5×10⁴molecules), and dashed lines (i.e., C1 = 6×10⁴ mole-cules) in (A-C) (resp. (G-I)).
(TIF)
S3 Fig. Sustained AtRGS1 level (C1 in the model) under flg22 condition. This figure shows
the change in AtRGS1 intensity after treatment with 100 mM flg22 treatment. Because the effect from flg22 occurs quickly (around 10 minutes), the image was taken at 1 minute and 30 minutes at the same location of the same seedlings. After 100 mM flg22 treatment, the mean of AtRGS1-YFP intensity increased from 25 pixel/μm2to 29.1 pixel/μm2, but the AtRGS1-YFP intensity is not significantly different over 30 minutes (p-value is around 0.02). For these experiments, AtRGS1-YFP was driven by the 35S viral promoter.
S1 File. MATLAB code for pixel intensity measurement. This MATLAB code is used for the
average pixel intensity of the images taken from light sheet fluorescence microscopy. The func-tion find_avg_intensity(fileName) is used to calculate the average intensity of the image speci-fied in fileName after removing the image background with the default intensity threshold 0.1 for separating signal from background. The function find_avg_intensity(fileName,TH) calcu-late the same thing as find_avg_intensity(fileName), besides the intensity threshold can be adjusted by changing the value of TH. The return values of both functions are the average pixel intensity of the region of the image above the threshold value (default setting 0.1 for fin-d_avg_intensity(fileName) and TH for find_avg_intensity(fileName,TH)).
(PDF)
Acknowledgments
We thank Ying Liang and Daisuke Urano for suggesting hypotheses and designing experi-ments, Eli Buckner and Maria Angels De Luis Balaguer for writing the script for the light sheet image analysis and assistance with light sheet data analysis, and Jing Yang for technical assistance.
Author Contributions
Conceptualization: Kang-Ling Liao, Rosangela Sozzani, Roger D. Jones, Timothy C. Elston,
Alan M. Jones.
Data curation: Charles E. Melvin.
Formal analysis: Kang-Ling Liao.
Funding acquisition: Rosangela Sozzani, Timothy C. Elston, Alan M. Jones.
Investigation: Alan M. Jones.
Methodology: Timothy C. Elston, Alan M. Jones.
Project administration: Timothy C. Elston, Alan M. Jones.
Supervision: Rosangela Sozzani, Timothy C. Elston, Alan M. Jones.
Validation: Kang-Ling Liao.
Visualization: Kang-Ling Liao, Charles E. Melvin.
Writing – original draft: Kang-Ling Liao, Alan M. Jones.
Writing – review & editing: Kang-Ling Liao, Rosangela Sozzani, Roger D. Jones, Timothy C.
Elston, Alan M. Jones.
References
1. Urano D, Chen J-G, Botella JR, Jones AM. Heterotrimeric G protein signalling in the plant kingdom. Open Biology. 2013 March 1, 2013; 3(3).
2. Urano D, Jones AM. Heterotrimeric G Protein–Coupled Signaling in Plants. Annual Review of Plant Biology. 2014; 65(1): 365–384.
3. Chuang H-h, Yu M, Jan YN Jan LY. Evidence that the nucleotide exchange and hydrolysis cycle of G proteins causes acute desensitization of G-protein gated inward rectifier K+ channels. Proceedings of the National Academy of Sciences. 1998 September 29, 1998; 95(20): 11727–11732.
5. Kleuss C, Raw A, Lee E, Sprang S, Gilman AG. Mechanism of GTP hydrolysis by G-protein alpha sub-units. Proc Natl Acad Sci U S A. 1994 91(21): 9828–9831. PMID:7937899
6. Bradford W, Buckholz A, Morton J, Price C, Jones A, Urano D. Eukaryotic G protein signaling evolved to require G protein–coupled receptors for activation. Sci Signal. 2013; 6:ra37.https://doi.org/10.1126/ scisignal.2003768PMID:23695163
7. Johnston CA, Taylor JP, Gao Y, Kimple AJ, Grigston JC, Chen J-G, et al. GTPase acceleration as the rate-limiting step in Arabidopsis G protein-coupled sugar signaling. Proceedings of the National Acad-emy of Sciences. 2007 October 30, 2007; 104(44): 17317–17322.
8. Urano D, Fu Y, Jones AM. Activation of an unusual G-protein in the simple protist Trichomonas vagina-lis. Cell Cycle. 2013 2013/10/01; 12(19): 3127–3128.https://doi.org/10.4161/cc.26350PMID: 24013419
9. Urano D, Jones JC, Wang H, Matthews M, Bradford W, Bennetzen JL, et al. G Protein Activation with-out a GEF in the Plant Kingdom. PLoS Genet. 2012; 8(6):e1002756.https://doi.org/10.1371/journal. pgen.1002756PMID:22761582
10. Liao K-L, Jones RD, McCarter P, Tunc-Ozdemir M, Draper JA, Elston TC, Kramer D, Jones AM. A shadow detector for photosynthesis efficiency. J Theoret Biol 2017; 414: 231–244.
11. Booker KS, Schwarz J, Garrett MB, Jones AM. Glucose attenuation of auxin-mediated bimodality in lat-eral root formation is partly coupled by the heterotrimeric G protein complex. PLOS ONE. 2010 Septem-ber 17, 2010, 5(9): e12833.https://doi.org/10.1371/journal.pone.0012833PMID:20862254
12. Chen J-G, Jones AM. AtRGS1 function in Arabidopsis thaliana. Methods in Enzymology: Academic Press; 2004. pp. 338–350.
13. Chen J-G, Willard FS, Huang J, Liang J, Chasse SA, Jones AM, et al. A seven-transmembrane RGS protein that modulates plant cell proliferation. Science. 2003; 301: 1728–1731.https://doi.org/10.1126/ science.1087790PMID:14500984
14. Chen Y, Ji F, Xie H, Liang J, Zhang J. The regulator of G-protein signaling proteins involved in sugar and abscisic acid signaling in Arabidopsis seed germination. Plant Physiol. 2006; 140: 302–310.https:// doi.org/10.1104/pp.105.069872PMID:16361523
15. Fu Y, Lim S, Urano D, Tunc-Ozdemir M, Phan N, Elston T, et al. Reciprocal encoding of signal intensity and duration in a glucose-sensing circuit. Cell. 2014; 156(5): 1084–1096.https://doi.org/10.1016/j.cell. 2014.01.013PMID:24581502
16. Grigston JC, Osuna D, Scheible WR, Stitt M, Jones AM. D-glucose sensing by a plasma membrane regulator of G signaling protein, AtRGS1. FEBS Lett. 2008; 582: 3577–3584.https://doi.org/10.1016/j. febslet.2008.08.038PMID:18817773
17. Nickerson M. Nonequilibrium drug antagonism Pharmacological Reviews. 1957; 9(2): 246–259. PMID: 13465305
18. Baxter JD, Funder JW. Hormone Receptors. New England Journal of Medicine. 1979; 301(21): 1149– 1161.https://doi.org/10.1056/NEJM197911223012104PMID:226885
19. de Luis Balaguer MA, Ramos-Pezzotti M, Rahhal MB, Melvin CE, Johannes E, Horn TJ, et al. Multi-sample Arabidopsis growth and imaging chamber (MAGIC) for long term imaging in the ZEISS Light-sheet Z.1. Developmental Biology. 2016 2016/11/01/; 419(1): 19–25.https://doi.org/10.1016/j.ydbio. 2016.05.029PMID:27235815
20. Smith P, House JI, Bustamante M, Sobocka´ J, Harper R, Pan G, et al. Global change pressures on soils from land use and management. Global Change Biology. 2016; 22(3): 1008–1028.https://doi.org/ 10.1111/gcb.13068PMID:26301476
21. Colaneri A, Tunc-Ozdemir M, Ping Huang J, Jones A. Growth attenuation under saline stress is medi-ated by the heterotrimeric G protein complex. BMC Plant Biology. 2014 12 May 2014; 14:129https:// doi.org/10.1186/1471-2229-14-129PMID:24884438
22. Deuschle K, Chaudhuri B, Okumoto S, Lager I, Lalonde S, Frommer WB. Rapid metabolism of glucose detected with FRET glucose nanosensors in epidermal cells and intact roots of Arabidopsis RNA-Silencing mutants. Plant Cell. 2006 September 1, 2006; 18(9): 2314–2235.https://doi.org/10.1105/tpc. 106.044073PMID:16935985
23. Gupta A, Singh M, Jones AM, Laxmi A. Hypocotyl directional growth in Arabidopsis: A complex trait. Plant Physiology. 2012 August 1, 2012; 159(4): 1463–1476.https://doi.org/10.1104/pp.112.195776 PMID:22689891
24. Zhang Y, He J. Sugar-induced plant growth is dependent on brassinosteroids. Plant Signaling & Behav-ior. 2015 2015/12/02; 10(12):e1082700.
26. Morkunas I, Ratajczak L. The role of sugar signaling in plant defense responses against fungal patho-gens. Acta Physiol Plant. 2014; 36: 1607–1619.