٦٧
Experiment # 7
Analyzing Network Traffic
Analyzing Network Traffic
8-1 : Introduction
In the prior experiment, you experimented with measuring, logging and charting the performance of the Server using .the Performance Monitor supplied with Windows NT Server. If the workstations attached to the server had the proper software, you could use this same tool to analyze the workstations as well. In analyzing the' performance of .the Server and the workstations, you can get important information about the health of the overall network. Even so, there are some things that the Performance Monitor simply does not tell you about the network itself-such as, which protocols are getting through and which are not, which workstation sent .the frame, etc. For this type of analysis, a Protocol Analyzer is often used. A Protocol Analyzer is often an expensive piece of hardware that can capture and decode packets as they are transmitted across the network. Fortunately, Windows NT Server comes with a software implementation of a protocol analyzer. It is called Network Monitor and it does many of the same jobs as the much more expensive protocol analyzer. In this experiment you will learn how to use the Network Monitor to analyze network traffic.
8-2 : Objectives
At the end of this experiment, you will be able to: • Demonstrate how to use the Network Monitor.
• Computer the performance of the network under different conditions. • Create a baseline of performance for the network.
• Determine the source, destination, time, and protocol of frames transmitted across the network.
8-3 : Materials Required
٦٨ 8-4 : Procedure : Examining Network Monitor
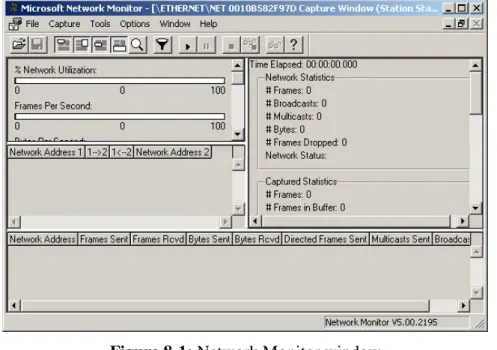
1. At Serverl, select Start / Programs / Administrative Tools (Common) I Network Monitor. The Network Monitor window will open as shown in Figure 8-1. You have not told the Network Monitor to 49 anything as yet, so nothing is going on.
Figure 8-1: Network Monitor window
2. Notice that the window is divided into several different sections. The upper left section displays bar graphs of various network parameters/like Network Utilization and Frames Per Second. Scroll through the bar graphs and notice which parameters are graphed.
3. The right section displays Time Elapsed and displays Time Elapsed and some Statistics. Scroll through the list and notice which parameters are tracked.
4. The other sections are currently empty because you have not yet captured any data to analyze. To see how capture works, open the Capture menu and click on Start. Notice that the Time Elapsed counter begins to count up. Let the counter count for about 30 seconds then open the Capture menu and click on Stop
٦٩
5. Notice that everything appears pretty much as it did before except for the Time Elapsed counter, because nothing was going on over the network during the capture period. In the next few steps, you will do another capture but this time you will initiate a simple network action during the capture period.
6. On Workstationl, open My Computer.
7. On Serverl, open the Capture menu and click on Start. When asked if you wish to save the previously captured data, click on No. Notice that the Time Elapsed counter resets and begins to count up again.
8. On Workstationl, in the My Computer window, double-click on the icon labeled Larry's Stuff on "Serverl".
9. On Serverl, open the Capture menu and click on Stop. Notice that the Network Monitor window now gives you some useful information as shown in Figure 8-2. Your results may look different, but they should be somewhat similar.
10.Notice that this simple act of opening the folder called Larry's Stuff on "Server1" caused a good bit of network activity. Let's look at the information provided.
11.Scroll through the bar graphs and notice that they have hardly changed since the network was not exactly being taxed during this capture. However/look at the statistics and list the following for your capture:
Network Statistics: # Frames :_________________ # Broadcasts : ______________ # Multicasts : _______________ # Bytes : ___________________ # Frames dropped : ___________ # Network status : ______________
٧٠
Figure 8-2 : The Network Monitor displays some of the information from the capture.
12.Notice that immediately below the bar graphs, an entry now appears in the Network Address section. This indicates that a communication occurred between Network Address..1 and Network Address 2. You undoubtedly recognize the Serverl address. But what is the other address? This is the Network Monitor's interpretation of the MAC address of Workstationl's NIC. Recall that the MAC address is a 12-digit hexadecimal number, with the first 6 digits representing the manufacturer of the NIC.Network Manager can recognize many of the manufacturing codes and substitute the name or abbreviation of the manufacturer. On a large network it is not unusual to see names like Intel, 3COM, WestDg, etc., as the manufacturer. In Figure 2, the manufacturer is identified by the abbreviation ADDTRN. The last 6 digits are the corresponding digits of the MAC address.
13.The two numbers between the two addresses indicate the number of frames sent in each direction.
14.The bottom of the window shows each side of the communications in a summary form. In Figure 8-2, the first entry shows that Workstation1 sent 10 files to the server for a total of 1074 bytes. The second entry indicates that Server1 responded with 8 frames for a total of
٧١
1441 bytes. While this summary is fine, wouldn't it be nice if you could also see a frame-by-frame description of this exchange of information? You can. Let's see what it1ooks like.
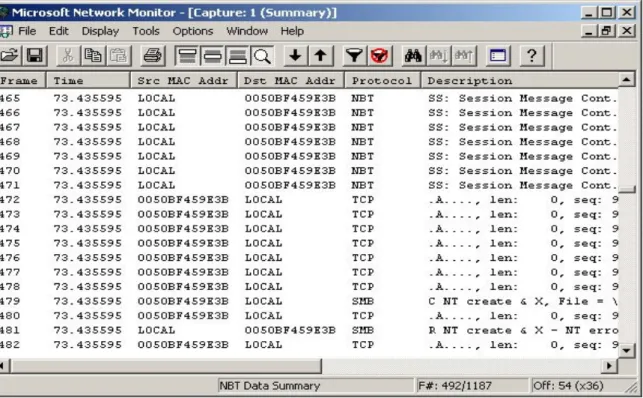
15.Open the Capture menu and click on Display Captured Data. The Capture.1 (Summary) window opens as shown in Figure 8-3. Notice that it provides information about each frame that you captured. Let's look at some of the details provided:
• Frame-Each frame is given a number.
• Time-Indicates the number of seconds that have elapsed since the capture began. You could change this to a time of day display if you wished by selecting Display I Options. • Src MAC Addr-Indicate the MAC address or name of the source of the frame.
• Dst MAC Addr-Indicates the MAC address or name of the destination of the frame. • Protocol-Indicates the protocol that Network Monitor determines is being used. • Description- A brief description of what the frame does,
٧٢
16.Compare your display with that shown in Figure 3 and see if you can answer the following questions about the behavior of your network during the capture:
A. Which computer started the communications ?___________ B. How many seconds into the capture was frame 1 sent ? _________ C. How long between Frame 1 and Frame 8 ?________________ D. What protocol was used in Framel ? ______________________ E. Wha t is the IP address of Workstation1 ? ___________________
17.Close the Capture 1 (Summary) window.
8-4-1 : Discussion
In this part of the experiment you examined the capture mode of the Network Monitor. You saw that it can eavesdr6pon the network to see what is going on. You also saw some of the information it can provide about what it finds. In this particular communication, the 5MB or Server Message Block protocol was used most often. This is the file-sharing protocol that allows a computer to transparently access files on another computer. Finally you saw that even simple network communications can cause a dozen or more frames to be transferred back and forth between the workstation and the server. What do you suppose happens when the network is going full-blast? Let's find out.
٧٣ 8-5 : Procedure-Filtering the Network Information
One of the problems with the Network Monitor is that it can inundate you with information. On a busy network even a few seconds of capture can result in hundreds or even thousands of frames. How can you sort it all out? Fortunately, the Network Monitor gives you ways of filtering these massive amounts of information down to a more manageable size. In this part of the experiment you will experiment with filtering.
1. Scroll through the frames listed. How many frames are listed? _______________
2. Look at the protocols of the frames. Notice that most are either TCP (Transport Control Protocol) or NBT, (NetBios overTCP/IP)
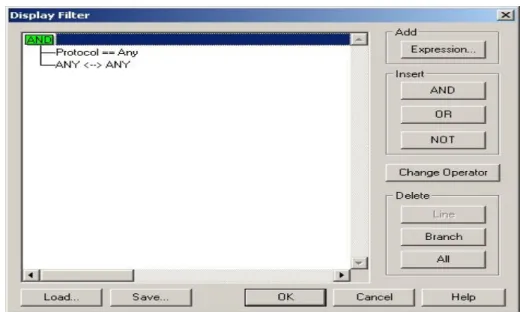
3. Let’s suppose you are interested in those frames using the; NBT protocol, but are having trouble finding them amid all the TCP frames. This is where filtering comes in handy. 4. Open the Display menu and click on Filter The Display Filter dialog box will open as
shown in Figure 8-4.
Figure 8-4 : The Display Filter dialog box
5. Double-click on the line labeled Protoco1 == Any. The Expression dialog box will open to the Protocol tab as shown in Figure 8-5.
٧٤
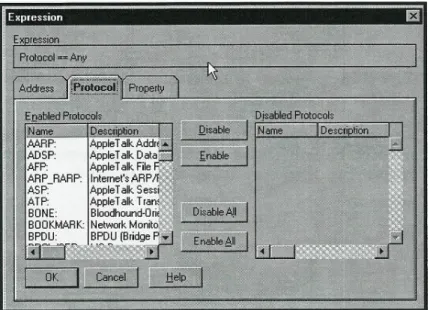
Figure 8-5 : The Expression dialog box
6. Look at the long list of protocols listed under Enabled Protocols. Scroll down the list and find NBT and TCP .To simplify the display you will disable all protocols except NBT. 7. Click on the Disable All button. Notice that all the protocols jump over to the Disabled
Protocols list. Scroll down the list, Find and highlight the NBT protocol. Click on the Enable button. Notice that the NBT protocol is now the only entry in the Enabled Protocols list.
8. Click on OK to close the Expression dialog box. In the Display Filter dialog box, notice the line that has changed to Protocol==NBT. Click on OK to close the Display Filter dialog box.
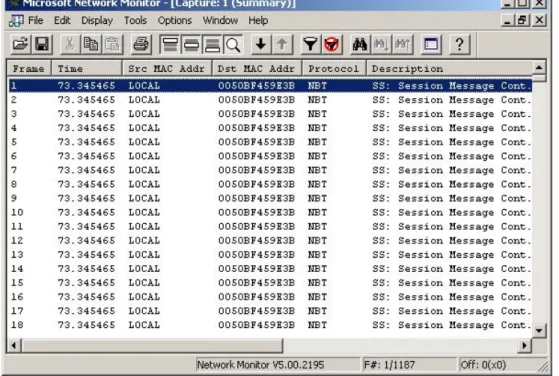
9. Back at the Summary display; notice that for the most the NBT protocol frames are listed, as shown in Figure 8-6. However, you may have noticed that the filtering is pot perfect.
٧٥
Figure 8-6 : summary display of NBT protocol frames
10.Exit the Network Monitor. Using the proper procedures, shut down the three computers.
8-5-1 : Discussion
In this part of the experiment, you saw that the Filter feature of the Network Monitor can help you to sort out the avalanche of frames captured. Here you filtered by protocol. But you can also filter by Work- station or by certain frame properties. A word of caution: The Network Monitor supplied with Windows NT Server 4.0 is a stripped-down version of a Network Monitor that Microsoft sells with its extra cost Server Management System (SMS). Several of the features do not work in this smaller version. Even so, as you have seen, the Network Monitor is a powerful tool for measuring the performance of the network and analyzing the files being transferred.