The Structure of the Plasmid pCU1 TraI Relaxase and the Role of the pCU1 TraI Relaxase-Helicase during Conjugative Plasmid Transfer
Rebekah Potts Nash
A dissertation submitted to the faculty of the University of North Carolina at Chapel Hill in partial fulfillment of the requirements for the degree of Doctor of Philosophy in the Department of
Chemistry.
Chapel Hill 2011
Approved by
Advisor: Matthew Redinbo, Ph.D.
Reader: Kevin Slep, Ph.D.
Reader: Linda Spremulli, Ph.D.
Steven Matson, Ph.D.
ii Abstract
Rebekah Potts Nash: The Structure of the Plasmid pCU1 TraI Relaxase and the Role of the pCU1 TraI Relaxase-Helicase during Conjugative Plasmid Transfer
(Under the direction of Matthew R. Redinbo)
Bacteria disseminate genetic material to neighboring cells using conjugative plasmid transfer (CPT). During CPT, a donor bacterium transfers one strand of a double-stranded DNA plasmid to a recipient. Each conjugative plasmid encodes a complex of proteins necessary for its transfer. One of these proteins, the relaxase, initiates plasmid transfer by severing the nic site of the transferred strand (T-strand). A DNA helicase then separates the T-strand from the parent strand, starting at the nic site. The relaxase acts a second time to terminate transfer by resealing the nicked T-strand. The resistance plasmid pCU1 encodes a multi-domain protein, TraI, that supplies both the relaxase and helicase activities required for its transfer. We analyzed the structure and function of pCU1 TraI in order to compare it to similar plasmid-encoded proteins and to identify TraI-mediated activities that could be targeted by inhibitors.
Characterization of the pCU1 relaxase revealed unique structural and functional
iii
Analysis of the pCU1 helicase established the extent of the minimal helicase domain, the location of the seven conserved helicase motifs, and the substrate requirements of the helicase ATPase activity. The pCU1 helicase harnesses the energy released during ATP hydrolysis to drive DNA strand separation. After optimizing an ATPase assay for use with pCU1 TraI, small molecule libraries were screened for their ability to inhibit pCU1 TraI, and several potential TraI ATPase inhibitors were identified.
iv Dedication
v
Acknowledgements
I cannot hope to adequately thank those who have wisely guided me through graduate school and who have made my time in graduate school such a pleasure. I will simply hope to convey here a small measure of my gratitude, and, then, to trust that those who read these words will be able to surmise the true magnitude of my appreciation.
I thank the many collaborators who have welcomed me as a passing member into their labs, including the Matson lab, the Macromolecular Interactions Facility, and the Center for Integrative Chemical Biology and Drug Discovery. I especially appreciate the guidance of Steve Matson and Kambiz Tahmaseb, Ashutosh Tripathy, Bill Janzen, Emily Hull-Ryde and Cathy Simpson.
I thank the MD/PhD program and in particular Dr. O, David Siderovski, Carol, Alison, and Liz for their support and wisdom as I transitioned to graduate school, as I ventured into the world of grant writing, and as I now prepare to return to medical school.
I thank the hard working, gracious, and thoughtful members of the Chemistry Department who have made my time as a chemistry graduate student such a pleasure, and in particular want to thank Karen Gilliam, Laura Condie, and Lars Sahl for the help they provided me.
vi
and ever-patient help as I waded through crystallography; Laurie for her friendship and guidance as I collected and then refined crystallographic data; Bill for his friendship and energetic support of our lab’s work; and Keith for his friendship, plasmid transfer prowess, and gracious help with all things science.
I thank all the former members of the Redinbo lab for the wisdom and knowledge they imparted to me during their time at UNC. I particularly want to thank Eric for his friendship, for taking out all the lion and bear traps in Carolina North, and for answering endless questions about computer scripts; Scott for his friendship, love of science and his Excel prowess; Laura for being a mentor extraordinaire during my rotation in the lab, for lab bike rides, and for introducing me to the joys of the synchrotron; Jill for her help with numerous and various crystallography programs and problems; Andy for his friendship, spinning ability, and amazing bike rides, and Mike Miley for his help both during his time here in the Redinbo lab and at the UNC crystallography core.
I thank the undergraduates and exchange students I have had the joy of working with. Franklin, Drew, Dan, and Johanne: I am so grateful for your hard work, but even more for your friendship. I wish you only the best.
I thank Matt for the opportunity to work in his laboratory. I am incredibly grateful for the support, advice, and encouragement he gave me as I worked and trained over these last five years. I greatly respect his love of science, of research, and his ability to share these traits with those who work for him.
I thank the loving, supporting, and ever-wise members of Christ Community Church whom I have the delight and honor of considering my friends, in particular Chris and Erin, Lauren, Nikki, Robin, Jessie, Rik and Bobbie, Kent and Jeline, Mike and Celette.
vii
Table of Contents
List of Tables………...x
List of Figures………...………...xi
List of Abbreviations and Symbols...…………...……….………...xiii
Chapter 1: Introduction to Conjugative Plasmid Transfer..……….………...1
1.1 An Overview of the Replication and Transfer of Genetic Material in Bacteria…………..1
1.2 The Classification of Transmissible Plasmids………….……….2
1.3 The Mechanism of Conjugative Plasmid Transfer…….………..4
1.4 Figures…………..…….………...6
Chapter 2: The Structure of the Plasmid pCU1 TraI Relaxase………...11
2.1 Introduction to the Structure of the Relaxase……….11
2.2 Construct Design and Cloning of the pCU1 TraI Relaxase………...12
2.3 Expression and Purification of the pCU1 TraI Relaxase………13
2.4 Crystallization, Data Collection, and Data Processing of the pCU1 TraI Relaxase……..15
2.5 Analysis of the pCU1 TraI Relaxase Structure………..16
2.5.1 The Dimer in the Asymmetric Unit………16
2.5.2 The Overall Fold and the Active Site HUH Motif of the pCU1 TraI Relaxase………..…17
2.5.3 The N-terminus of the pCU1 TraI Relaxase………...…...18
2.5.4 The Motif 3 Tyrosines of the pCU1 TraI Relaxase………19
2.6 Conclusions………20
2.7 Tables and Figures.……….20
viii
3.1 Introduction to Relaxase Function……….……….29
3.2 Construct Design, Mutagenesis, Expression, and Purification of the pCU1 TraI Relaxase………..…….30
3.3 Characterization of pCU1 TraI Relaxase Stability by Circular Dichroism (CD) Spectroscopy………31
3.4 Characterization of DNA Binding by the pCU1 TraI Relaxase……….33
3.4.1 Introduction to DNA Binding by the pCU1 TraI Relaxase………33
3.4.2 Methodology………..33
3.4.3 pCU1 TraI Relaxase DNA Binding Affinity and Specificity……….34
3.5 Characterization of DNA Nicking by the pCU1 TraI Relaxase……….36
3.5.1 Introduction to DNA Nicking by the pCU1 TraI Relaxase………36
3.5.2 Methodology………..38
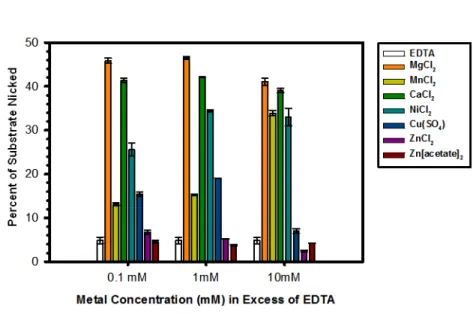
3.5.3 Metal-Dependent DNA Nicking by the pCU1 TraI Relaxase………....40
3.5.4 Tyrosine-Dependent DNA Nicking by the pCU1 TraI Relaxase………...42
3.5.5 Aspartic Acid-Dependent DNA Nicking by the pCU1 TraI Relaxase………...44
3.5.6 Model of DNA Nicking by the pCU1 TraI Relaxase Active Site Tyrosines and Adjacent Aspartic Acid……….46
3.5.7 DNA Structure- and Sequence-Dependent Nicking and Ligation by the pCU1 TraI Relaxase……….………...48
3.6 Summary of Data………51
3.7 Tables and Figures………..52
Chapter 4: DNA Binding and DNA-Dependent ATPase Activities of the pCU1 TraI Helicase...…...70
4.1 The Classification of Helicases………..70
4.2 Introduction to Helicase Structure and Function………71
4.3 Analysis of the Sequence and Predicted Structure of the pCU1 TraI Helicase…………..72
4.4 Characterization of DNA Binding by the pCU1 TraI Helicase………..74
4.4.1 Introduction to DNA Binding by the pCU1 TraI Helicase………74
ix
4.4.3 Expression and Purification of the pCU1 TraI Helicase………75
4.4.4 Effect of DNA on the Oligomeric State of pCU1 TraI………..76
4.4.5 DNA Binding Stoichiometry and Affinity of pCU1 TraI and the pCU1 TraI Helicase…..………..78
4.4.6 Summary of DNA Binding by pCU1 TraI and the pCU1 TraI Helicase..…….81
4.5 Characterization of pCU1 TraI Helicase ATPase Activity………83
4.5.1 Introduction to pCU1 TraI Helicase ATPase Activity………...83
4.5.2 Design of an NADH-coupled ATPase Activity Assay………..84
4.5.3 Optimization and Application of an NADH-coupled ATPase Activity Assay………...85
4.6 Design, Optimization, and Validation of a High Throughput Assay of pCU1 TraI Helicase ATPase Activity………...87
4.6.1 ADP Quest Assay Design………...87
4.6.2 Results of the ADP Quest Assay Optimization and Validation……….88
4.7 A High Throughput Screen for Inhibitors of the pCU1 TraI Helicase ATPase Activity………...91
4.8 Future Steps for the Identification and Characterization of pCU1 TraI ATPase Inhibitors………..92
4.9 Tables and Figures………..93
Chapter 5: Characterization of Plasmid pCU1 Transfer………..119
5.1 Introduction to Plasmid Transfer………..119
5.2 Method Development for Characterization of Plasmid pCU1 Transfer………...119
5.3 Analysis of Plasmid pCU1 Transfer……….122
5.4 Tables and Figures………124
x List of Tables Chapter 1
No Tables Chapter 2
Table 2.1 Crystallographic Statistics……….21
Chapter 3 Table 3.1 DNA Binding Assay Substrates………53
Table 3.2 Thermal Stability of the pCU1 TraI Relaxase………...54
Table 3.3 DNA Nicking and DNA Cross-over Assay Substrates……….55
Table 3.4 Summary of Metal Ion Data………..………57
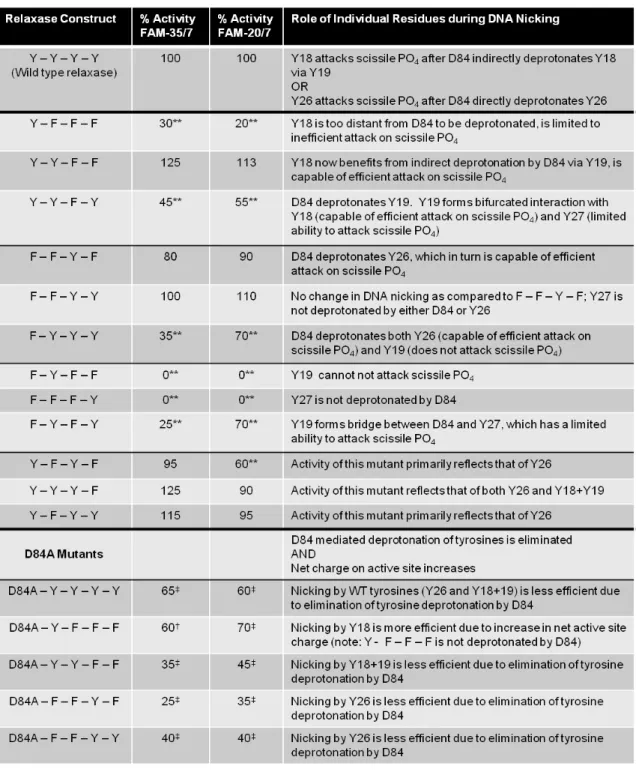
Table 3.5 Contribution of Individual Tyrosine and Aspartic Acid Residues to DNA Nicking………58
Chapter 4 Table 4.1 Conserved SF1/SF2 Helicase Motifs………94
Table 4.2 pCU1 TraI Oligomerization and DNA Binding………95
Table 4.3 DNA Substrates for DNA Binding and ATPase Activity Assays……….96
Table 4.4 Impact of NADH-coupled ATPase Activity Assay Conditions on pCU1 TraI ATPase Activity………..98
Chapter 5 Table 5.1 Minimal Inhibitory Concentration of Antibiotics for Selected Cell Lines………..…125
xi List of Figures Chapter 1
Figure 1.1 The Classification of Transmissible Plasmids………...7
Figure 1.2 The Mechanism of Conjugative Plasmid Transfer………8
Figure 1.3 DNA Nicking Mechanism of the Relaxase Motif 3 Tyrosine………...…..10
Chapter 2 Figure 2.1 The Structure of the Conjugative Relaxase in Complex with Plasmid oriT DNA………..22
Figure 2.2 Structure of the pCU1 TraI Relaxase………...23
Figure 2.3 Structural Comparison of Relaxase Enzymes………..24
Figure 2.4 Amino Acid Sequence Alignment and Secondary Structure of the pCU1 TraI Relaxase……….………25
Figure 2.5 SDS-PAGE of Purified pCU1 TraI Relaxase………..26
Figure 2.6 Size Exclusion Chromatography of the pCU1 TraI Relaxase……….…….26
Figure 2.7 Structural Comparison of the Relaxase N-terminus………27
Chapter 3 Figure 3.1 Circular Dichroism Spectra of the pCU1 TraI Relaxase………..59
Figure 3.2 DNA Binding by the pCU1 TraI Relaxase………..60
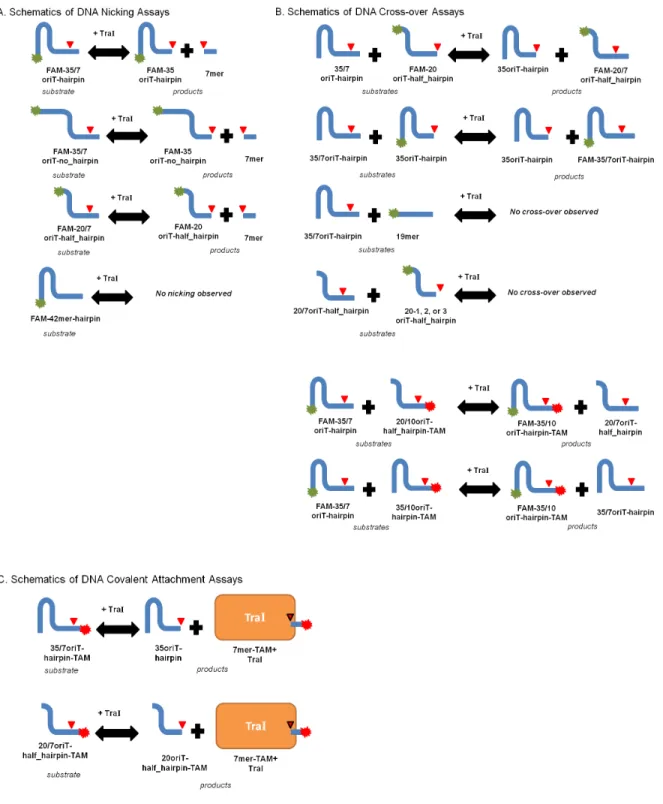
Figure 3.3 Schematics of DNA Nicking and Cross-over Experiments……….61
Figure 3.4 Effect of Metal on the DNA Nicking Activity of the pCU1 TraI Relaxase……..………..62
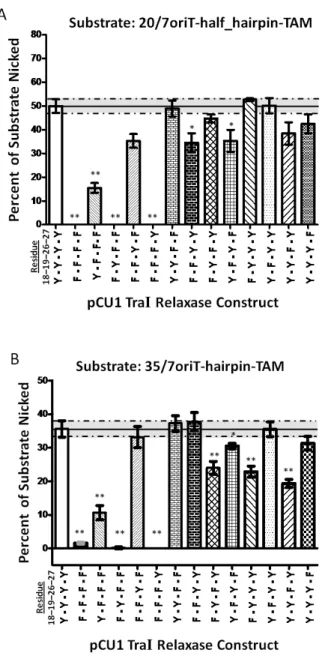
Figure 3.5 DNA Nicking Activity of pCU1 TraI Relaxase Tyrosine Mutants……….63
Figure 3.6 DNA Covalent Attachment Activity of pCU1 TraI Relaxase Tyrosine Mutants…………64
Figure 3.7 DNA Nicking Activity of pCU1 TraI Relaxase Aspartic Acid Mutants……….65
Figure 3.8 Model of DNA Nicking by the pCU1 TraI Relaxase Active Site………66
Figure 3.9 Representative Gels Illustrating the DNA Nicking and Ligation Activities of the pCU1 TraI Relaxase………...67
Figure 3.10 Four Regions of the pCU1 oriT DNA Sequence………...…68
xii Chapter 4
Figure 4.1 Classification of Helicases………...99
Figure 4.2 Four Models of Helicase DNA Unwinding Mechanisms (from Matson, 2003)……...….100
Figure 4.3 Structures of Representative Helicases and the Conserved RecA Core (from Caruthers, 2002)...………...………..101
Figure 4.4 Predicted Structure of the pCU1 TraI Helicase……….102
Figure 4.5 DNA Binding Curves……….106
Figure 4.6 Representative DNA Binding Density Curves………...108
Figure 4.7 Average Degree of Binding as a Function of Fluorescence Anisotropy………109
Figure 4.8 Maximum Average Degree of Binding as a Function of Substrate Length, Structure……….110
Figure 4.9 Design of the NADH-coupled ATPase Activity Assay……….111
Figure 4.10 pCU1 TraI ATPase Activity as a Function of ssDNA Length, NTP Concentration………..112
Figure 4.11 Impact of pCU1 TraI Construct Length and Mutagenesis of the Walker A and B Motifs on pCU1 TraI ATPase Activity………113
Figure 4.12 Design of the ADP Quest ATPase Activity Assay………..115
Figure 4.13 Validation of the ADP Quest ATPase Activity Assay Design………116
Figure 4.14 High Throughput Screening of the LOPAC against pCU1 TraI ATPase Activity………..117
Figure 4.15 Putative Inhibitors of the pCU1 TraI ATPase Identified through High Throughput Screening……….………..118
Chapter 5 Figure 5.1 Oxygen Biosensor Technology………..126
Figure 5.2 Detection of Cell Population Size using the Oxygen Biosensor Plate Method………127
xiii
List of Abbreviations and Symbols
% percent
° degree
Σvi average degree of binding
6FAM fluorescein
6-His 6xhistine affinity tag
Å angstrom
ADPNP 5'-adenylyl-ß,γ-imidodiphosphate
AI arabinose inducible
Ala, A alanine
Amp ampicillin
App. KD apparent dissociation constant
APS Advanced Photon Source
APS ammonium persulfate
Asn, N asparagine Asp, D aspartic acid
ATP adenosine triphosphate
AU asymmetric unit
BME β-mercaptoethanol
bp base pairs
BSA bovine serum albumin
C Celsius
44Ca isotope calcium-44
Cα alpha carbon
xiv CCD charge-coupled device
CCP4 Collaborative Computing Project No. 4
CD circular dichroism
CFU colony forming unit
CICBDD Center for Integrative Chemical Biology and Drug Discovery
cm centimeter
CNS Crystallography and NMR System CPT conjugative plasmid transfer CSS complexation significance score C-terminus, C-term carboxy terminus
CTP cytidine triphosphate Cu2+ copper cation
ddH20 double distilled water
δN delta nitrogen
dmol decimole
DMSO dimethyl sulfoxide DNA deoxyribonucleic acid dsDNA double-stranded DNA Dtr DNA-transfer replication DTT D,L-dithiothreitol E. coli Escherichia coli
EDTA ethylenediaminetetraacetic acid EMSO electrophoretic mobility shift assays
εN epsilon nitrogen
F plasmid fertility plasmid
xv Fe2+ iron cation (ferrous)
Fe3+ iron cation (ferric) 57Fe isotope iron-57
FPLC fast protein liquid chromatography
g gram
g gravitational acceleration Gln, Q glutamine
Glu, E glutamic acid
GTP guanosine triphosphate HGT horizontal gene transfer
HIC-Up Hetero-compound Information Center Uppsala His, H histidine
HPLC high performance liquid chromatography
h hour
HTS high throughput screening
HUH histidine residue-hydrophobic residue-histidine residue ICP-MS inductively coupled plasma mass spectroscopy
IC50 concentration of compound required for 50% inhibition of enzyme activity
ID insertion device
IDT Integrated DNA Technologies
IMPACT Intein Mediated Purification with an Affinity Chitin-binding Tag IPTG Isopropyl β-D-1-thiogalactopyranoside
IR inverted repeat
K Kelvin
KD dissociation constant
xvi Kpath molar absorption coefficient
L liter
LB luria broth
LDH lactate dehydrogenase LIC ligation independent cloning
LOPAC library of pharmaceutically active compounds
M molar
MBP maltose binding protein
µ micro
µg microgram
µL microliter
µM micromole
µm micron
mdeg millidegrees
mg milligram
Mg2+ magnesium ion
24Mg isotope magnesium-24
MIC minimum inhibitory concentration
min minutes
mL milliliters
mm millimeter
mM millimole
Mn2+ manganese cation 55Mn isotope manganese-55
MOB mobility
xvii
mol mole
MOPS 3-(N-morpholino)propanesulfonic acid MPF mating pair formation
MRE mean residue ellipticity
MW molecular weight
NADH nicotinamide adenine dinucleotide NEB New England Biolabs
ng nanogram
Ni nickel
Ni2+ nickel cation 60Ni isotope nickel
nL nanoliter
nm nanometer
nM nanomole
N-terminus, N-term amino terminus
NTP nucleoside triphosphate
OD optical density
O/N overnight
oriT origin of transfer
PAGE polyacrylamide gel electrophoresis PDB Protein Data Bank
PEG polyethyleneglycol PEP phosphoenolpyruvate
pH negative log (base 10) of the molar concentration of hydronium ions Phe, F phenylalanine
xviii
PK pyruvate kinase
pKa negative log (base 10) of the acid dissociation constant
pM picomolar
ppb parts per billion R plasmid resistance plasmid
R2 coefficient of determination
Rep replication
Rif rifamycin
RMSD root mean square deviation RP4 replication protein 4 rpm revolutions per minute SDS sodium dodecyl sulfate
S seconds
SEC size exclusion chromatography
Ser, S serine
SER-CAT Southeast Regional Collaborative Access Team
SF superfamily
SLS static light scattering
SN2 bimolecular nucleophilic substitution
Spec spectinomycin ssDNA single-stranded DNA
SSRL Stanford Synchrotron Radiation Laboratory Strep streptomycin
xix
TAM TAMRA
TBE Tris-Borate-EDTA
TEMED tetramethylethylenediamine
Tet tetracyclin
TEV tobacco etch virus Tm melting temperature
TM template modeling
TraI transfer initiation T-strand transferred strand TTP thymidine triphosphate Tyr, Y tyrosine
U hydrophobic residue
UNC-CH University of North Carolina at Chapel Hill
v volume
w weight
WT wild type
XDS X-ray Detector Software Zn2+ zinc cation
Chapter 1: Introduction to Conjugative Plasmid Transfer 1.1 An Overview of the Replication and Transfer of Genetic Material in Bacteria
Bacteria store genetic information on chromosomes and extra-chromosomal elements. Extra-chromosomal elements are often mobile, capable of moving between bacterial hosts and occasionally into and out of bacterial chromosomes; they include gene cassettes, bacteriophages, single-stranded and double-stranded plasmids, and transposons 1-3. Bacterial chromosomes are themselves mosaics of
stable elements and mobile elements such as prophages, integrating conjugative elements (ICEs or conjugative transposons), and mobilizable genomic islands 4.
Bacteria replicate and then disseminate genetic information using a variety of mechanisms, which are classified into two groups, based upon the direction of the transfer. During vertical gene transfer, a parent bacterium duplicates its genetic information and then divides into two daughter bacteria, donating a copy of its genetic material to each of its progeny. In this case, both extra-chromosomal elements and extra-chromosomal material are duplicated and disseminated. During
horizontal gene transfer (HGT), a parent bacterium replicates and transfers a mobile genetic element to another parent bacterium. HGT can occasionally result in the dissemination of chromosomal material, if this material is part of a mobile element, or if the material conscripts the transfer machinery of a mobile element. However, HGT is the primary route of transfer for extra-chromosomal elements 1-3.
An entire population of bacteria can quickly acquire new genetic elements through the process of HGT. As a result, HGT is the major route by which bacteria increase their genetic
2
we became interested in the underlying mechanism controlling this type of transfer between bacteria. In particular, we chose to focus on the horizontal transfer of double-stranded DNA (dsDNA)
plasmids.
1.2 The Classification of Transmissible Plasmids
Horizontal gene transfer of double-stranded DNA (dsDNA) plasmids between bacterial cells is specifically referred to as conjugative plasmid transfer (CPT). Transmissible dsDNA plasmids are divided into two broad classes based upon their ability to move between bacterial hosts (Figure 1.1). The first class, referred to as conjugative plasmids, encode all the factors necessary for their own transfer, while the second class, the mobilizable plasmids, require the presence of a second
conjugative element for transfer. Both conjugative and mobilizable plasmids contain genes encoding the mobility (MOB) set of enzymes, which are required for plasmid replication. In addition to these MOB elements, conjugative plasmids contain genes encoding a Type 4 secretion system (T4SS). The T4SS forms the pore through which DNA can move from the donor bacterium to the recipient. A type 4 coupling protein (T4CP) links the MOB replication apparatus to the T4SS transfer apparatus. All conjugative, and a limited number of mobilizable, plasmids encode their own T4CP. Even though the nomenclature would suggest otherwise, the physical transfer of both conjugative and mobilizable plasmids is referred to as conjugation 2, 3, 8, 10, 11.
The relaxase enzyme is the only highly conserved member of the MOB family of proteins, and it is necessary for the transfer of both mobilizable and conjugative plasmids. Therefore, the presence of a relaxase allows for the identification and classification of bacterial DNA plasmids that undergo CPT. The relaxase enzyme is defined by the presence of a limited number of amino acid motifs. The HUH motif, also referred to as motif 2, consists of a histidine-hydrophobic residue-histidine and is the most highly conserved relaxase motif. Often a third residue-histidine, found slightly upstream of motif 2 in amino acid sequence, forms a triad with the two histidines of the HUH motif. Together, the three histidines are referred to as the Histidine Triad or HUH(+H) motif. The
3
found upstream of motif 2 in amino acid sequence, consists of one or more tyrosines and is
responsible for relaxase-mediated DNA plasmid nicking and ligation. Of note, some papers refer to this tyrosine-dominated motif as motif 1; in this manuscript we will use the original nomenclature which refers to the motif as motif 3 8, 10, 12, 13. Both of these motifs were first identified in a related
class of enzymes, the Rep class of enzymes. In Rep enzymes, the motifs are found in numerical order in amino acid sequence (the HUH motif 2 is followed by the tyrosine-dominated motif 3) and a highly variable 3rd motif, motif 1 (futLt, U[VL][VL]YP, FLTY(P), or FLTLT) is found N-terminal of
both motifs 2 and 3 12, 14, 15.
Based upon the sequence of their respective relaxase enzymes, and in particular the sequence surrounding motifs 2 and 3, mobilizable and conjugative plasmids have been classified into six families. These families are MOBF, MOBH, MOBC, MOBQ, MOBP, and MOBV (Figure 1.1). The
MOBQ, MOBP, and MOBV plasmid families encode relaxases containing only one motif 3 tyrosine.
The well characterized plasmid R1162 MobA relaxase (MOBQ) and plasmid RP4 TraI relaxase
(MOBP) are representative single tyrosine relaxases 16-22. Relaxases encoded by the MOBH and
MOBC plasmids are not well characterized, and it is still unclear how many tyrosines these enzymes
typically include within motif 3. The MOBF family is the best characterized of the six plasmid
families and has been subdivided into two clades (MOBF1, MOBF2) and numerous subclades. For all
six MOB families of plasmids, the plasmid-encoded relaxase enzyme is often found at the N-terminus of a multidomain transfer-initiation protein. A helicase or primase domain can be located
downstream of the relaxase, and in some cases additional protein-protein interaction domains are present 3, 8, 10, 23-25.
In 1947, Lederberg and Tatum reported the transfer of a MOBF1 plasmid, the F plasmid,
between bacterial cells; their work represented the first description of the horizontal transfer of genetic material between bacteria. Since then, the F plasmid and its relaxase have been extensively studied, and the F plasmid has served as the best characterized model of CPT 5, 13, 26-35. Recently,
4
plasmid R388 TrwC and its relaxase 36-44 and, as reported here, the plasmid pCU1 and its TraI
relaxase 45, 46. By characterizing these and other conjugative plasmids, the general mechanism of
plasmid transfer can be determined, as well as the role that the relaxase plays during transfer. 1.3 The Mechanism of Conjugative Plasmid Transfer
During CPT, a donor bacterium transfers one strand of a double-stranded DNA plasmid to a neighboring recipient bacterium 47. As detailed above, each conjugative plasmid contains genes for a
MOB protein complex, aT4SS protein complex, and a T4CP, all of which are necessary for its transfer (Figure 1.1). The MOB, or Dtr (DNA-transfer replication), set of proteins forms a large complex called the relaxosome in concert with the host-encoded Integration Host Factor (IHF). The relaxosome includes the relaxase and is the replication machinery of the plasmid. The T4SS complex, which forms a secretion system through which DNA travels to the recipient, can also be referred to as the mating pair formation (MPF) complex. The coupling protein that links these two complexes is the type 4 coupling protein (T4CP) and is considered by some to be one of the MOB proteins, though this designation is not universally accepted 3, 11, 48.
Within the relaxosome, the relaxase initiates plasmid transfer by creating a single-stranded break at a nic site in the transferred strand (T-strand) of the dsDNA plasmid (Figure 1.2). This nic site is found within a larger segment of the T-strand called the origin of transfer, or oriT. The oriT serves as the binding site for the relaxase and other members of the relaxosome. The relaxase cleaves the T-strand at the nic site with one of its motif 3 tyrosines. In particular, the tyrosine initiates a bimolecular nucleophilic substitution-type (SN2) attack on the scissile phosphate linking the two
5
1.2, right-sided path). In this case, a second relaxase-helicase protein in the donor is required to unwind the T-strand and terminate transfer. A DNA polymerase within the donor bacterium replaces the T-strand as it is transferred to the recipient, starting at the free 3′ hydroxyl at the nic site, thus generating the T′-strand. As a result, a hybrid T/T′ strand nic site is created, and no genetic information is lost by the donor 2, 11, 23, 28, 47-49.
Once the T-strand is completely separated from the parent strand, it must be severed from the newly synthesized T′-strand at the hybrid nic site in order to release it to the recipient (Figure 1.2). This second DNA-nicking step is accomplished by a nucleophilic group capable of initiating an SN2
attack on the hybrid nic site’s scissile phosphate. If the relaxase has traveled into the recipient, or if the relaxase contains only one motif 3 tyrosine, then a second relaxase enzyme in the donor could provide a nucleophilic DNA nicking tyrosine. If the relaxase remains in the donor, and it contains multiple tyrosines within motif 3, then it could provide the required nucleophile itself. Alternatively, transfer could stall until the host polymerase completes synthesis of the T′-strand, and the free 3′ hydroxyl at the end of the T′-strand could act as the attacking nucleophile. Most conjugative systems characterized to date utilize either multi-tyrosine relaxases or synthesize multiple relaxases during CPT. Regardless of the mechanism employed, following the second nick, a series of ligation reactions re-circularizes the original T-strand and the new T′ strand, and the relaxase(s) is(are) released from the plasmids 2, 23, 28, 47, 49, 50.
6
activity of the TraI protein could be inhibited. By blocking either the relaxase or helicase activity of pCU1 TraI, spread of this antibiotic resistance-encoding plasmid would be prevented.
1.4 Figures
Figure 1.1 The Classification of Transmissible Plasmids Figure 1.2 The Mechanism of Conjugative Plasmid Transfer
7 Figure 1.1 The Classification of Transmissible Plasmids
Transmissible plasmids are classified as either conjugative or mobilizable based upon the number of gene clusters they contain and the method by which they are transferred. Mobilizable plasmids contain the MOB gene cluster, while conjugative plasmids contain the MOB gene cluster as well as the Type 4 coupling protein (T4CP) and the type 3 secretion system (T4SS) gene clusters.
Transmissible and conjugative plasmids have been classified into 6 families (MOBF, MOBH, MOBQ,
MOBP, MOBV, MOBC) based upon the sequence of their relaxase enzyme, a conserved member of
9
Figure 1.2 The Mechanism of Conjugative Plasmid Transfer
Plasmid transfer is dependent on the activities of a conjugative relaxase and helicase. Conjugative relaxases contain one to four DNA nicking tyrosines and are often located at the N-terminus of a multidomain protein with a C-terminal helicase or primase domain. Plasmid pCU1 TraI is a
10
Figure 1.3 DNA Nicking Mechanism of the Relaxase Motif 3 Tyrosine
The tyrosine residue of the relaxase initiates an SN2 attack on the scissile phosphate at the plasmid nic
Chapter 2: The Structure of the Plasmid pCU1 TraI Relaxase 2.1 Introduction to the Structure of the Relaxase
As discussed in Chapter 1, a relaxase is found encoded on all transmissible plasmids and is required for conjugative plasmid transfer (CPT) 8, 10. Analysis of relaxase structure and function will
provide insight into the crucial steps this protein accomplishes during CPT. To date, structures of the F plasmid TraI relaxase (subclade MOBF12), the plasmid R388 TrwC relaxase (subclade MOBF11),
and the plasmid R1162 MobA relaxase (MOBQ) have been described 5, 16, 26, 36, 39, 51. In addition, the F
and R388 relaxase structures have been solved in complex with a portion of their respective plasmid’s oriT sequence. These relaxase-DNA complexes reveal that the relaxase binds the oriT as a partial
DNA hairpin (Figure 2.1) 36, 39. The 5′ end of the bound oriT forms a hairpin, while the 3′ end extends
as a single strand and forms a U-turn around the protein N-terminus, before entering the active site of the enzyme 5, 29, 36, 39. As seen in the structures of these three relaxases, the enzyme active site consists
of the HUH motif’s triad of histidines, which are located on two strands of a central ß-sheet. As described in Chapter 1, this motif coordinates a metal cation, the identity of which is plasmid-specific
5, 17, 36, 51. In DNA-bound structures of the relaxase, the DNA scissile phosphate is positioned above
the coordinated metal. As a result, the metal cation withdraws electron density from the phosphate center to promote nucleophilic attack on the scissile phosphate by one of the enzyme’s conserved motif 3 tyrosine residues 5, 36, 51.
We have determined the atomic structure of the relaxase enzyme responsible for the transfer of conjugative plasmid pCU1 (subclade MOBF11) (Figure 2.2). Our goal is to correlate the pCU1
12
resistance to the antibiotics ampicillin, streptomycin and spectinomycin 45, 46, 52-54. The relaxase
activity encoded by pCU1 is located within the N-terminal 299 residues of a multifunctional TraI enzyme, and productive, plasmid-specific transfer is dependent upon TraI 45, 46. Briefly, our analysis
of the pCU1 TraI relaxase structure identified features unique to the pCU1 relaxase (Figure 2.3) that allowed us to advance our understanding of the general mechanism of relaxase-mediated DNA binding and cleavage, as well as to highlight distinctive features of the pCU1 plasmid system. 2.2 Construct Design and Cloning of the pCU1 TraI Relaxase
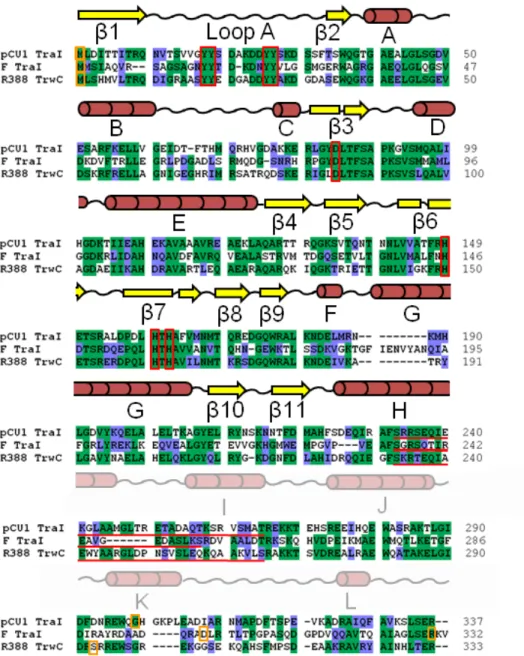
As stated above, the relaxase of plasmid pCU1 is located within the plasmid-encoded TraI protein 45, 46. To determine the extent of the relaxase domain within pCU1 TraI, we aligned the
pCU1 TraI amino acid sequence (GenBank: AAD27542) with that of R388 TrwC (GenBank: CAA44853) and F TraI (GenBank: BAA97974) (Figure 2.4). Sequence alignments were performed using AlignX or ContigExpress, both of which are components of Vector NTI Express 10.0.1
(Invitrogen, 2005), or using ClustalW within the BioEdit Sequence Alignment Editor (version 7.0.9.0, Tom Hall, 2007) 55, 56. When using ClustalW, default parameters were used, except for the gap open
penalty which was adjusted to 5.0 for both pairwise and multiple alignment steps. The Blossum62 similarity matrix was used during alignments, when calculating percent sequence identity, and when annotating the alignment. The sequence identity between the full length pCU1 TraI and R388 TrwC was 42%, and the sequence identity between the full length pCU1 TraI and F TraI, 16%; these values increased to 48% and 33%, respectively, when restricting evaluation of the sequences to the N-terminal 330 residues of each enzyme. Residues 1 to ~300 of pCU1 TraI were found to encapsulate the regions of highest sequence homology among these three sequences, and contained all conserved, relaxase-specific motifs. Therefore, we determined that residues 1 to ~300 of pCU1 TraI
corresponded to the relaxase domains of F TraI and R388 TrwC. Figure 2.4 (sequence alignment) was created in BioEdit.
13
residue 1 to 299 was chosen as the final construct (Figure 2.4). Primers were designed to isolate residues 1-299 of pCU1 TraI using the Vector NTI Express 10.0.1 suite of programs (Invitrogen, 2005) and were then commercially synthesized (Integrated DNA Technologies (IDT)). All cloning and mutagenesis was verified by sequencing at the UNC-CH Genome Analysis Facility. Residues 1-299 of pCU1 TraI were cloned into the vector pTYB2 (IMPACT system, New England Biolabs), between NdeI and SmaI restriction sites in order to C-terminally fuse the relaxase to an intein and a chitin binding domain (CBD) affinity tag and thus generate the construct WT_299. Using ligation independent cloning, residues 1-299 of the relaxase domain were inserted into vector pMCG9 57 to
create the mutant construct Nterm_299. In vector pMCG9, the relaxase was N-terminally fused to a maltose binding protein (MBP) affinity tag and a 6-His (MBP-HIS) affinity tag with a tobacco etch virus (TEV) protease cleavage site located between the protein sequence and the affinity tags 57.
During purification, these affinity tags were removed by the TEV protease, leaving three non-native residues (serine-asparagine-alanine) at the N-terminus of Nterm_299.
2.3 Expression and Purification of the pCU1 TraI Relaxase
All proteins were over-expressed in BL21(DE3) Escherichia coli. One liter of LB broth was inoculated at a ratio of 1:50 or 1:100 with a saturated overnight culture of BL21(DE3) Escherichia coli containing the expression plasmid. Cells (1 L) were grown under antibiotic selection (ampicillin,
100 µg/mL) at 37°C with vigorous shaking until the cell density reached an OD600 of 0.6. Isopropyl
β-D-1-thiogalactopyranoside (IPTG) was then added to a final concentration of 0.1 mM and the temperature was dropped to 18°C. The protein was overexpressed at 18°C for 16 h, after which the cells were harvested by centrifugation (15 min at 4,500 rpm at 4°C) and resuspended in 10mL Buffer C (WT_299) (500 mM NaCl, 20 mM Tris-HCl pH 7.5, 10% glycerol, 0-5 mM EDTA, 0.01% azide) or Buffer A (Nterm_299) (500 mM NaCl, 20 mM dibasic Na2(PO4), 10% glycerol, 5 mM imidazole,
14
1 table per 50 mL resuspended cells), lysed on ice using a Sonic Dismembrator, Model 500 (Fisher Scientific) (2 min of 0.5 s pulses at 60% intensity), and centrifuged (70 min at 17,000 rpm at 4°C) to isolate the soluble fraction. All purification steps were performed on ice or at 4°C.
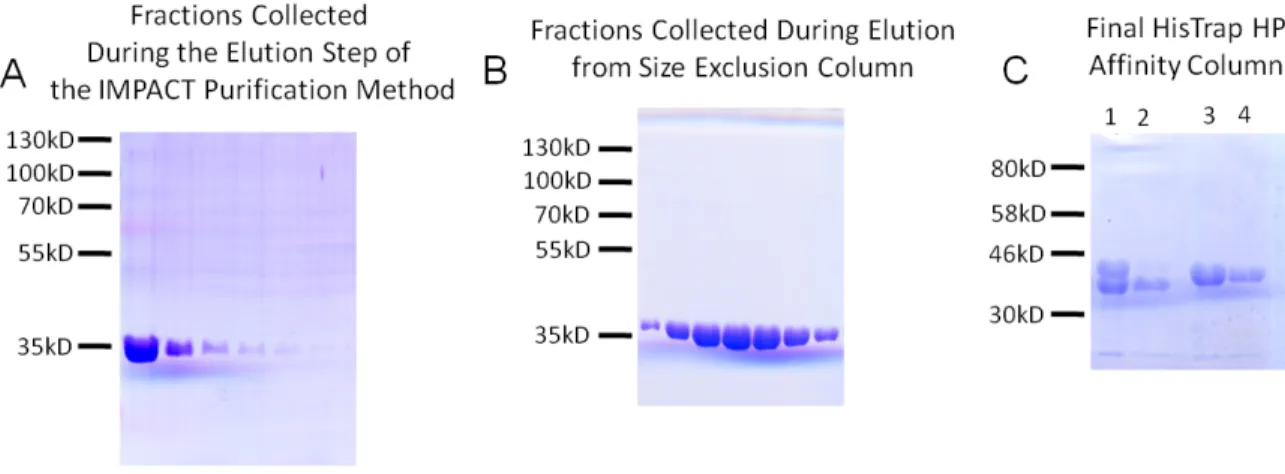
WT_299 was purified on chitin resin (NEB) using a batch bind method followed by an extended wash step in Buffer C, as described by the manufacturer. Cleavage of the intein and CBD tags, and subsequent release of WT_299 from the chitin resin, was induced by incubating the chitin resin with 50 mM D,L-dithiothreitol in Buffer C for 16 h. WT_299 was then eluted from the chitin resin in Buffer C by gravity column chromatography. Purification of one liter growth resulted in approximately 5 mg purified protein. WT_299 samples were separated by SDS-PAGE, stained with Coomassie Brilliant Blue, de-stained, and found to be >95% pure (Figure 2.5A, Figure 2.6).
Nterm_299 was purified over a 5 mL HisTrap HP column (GE Healthcare) on an
AKTAxpress FPLC (GE Healthcare) pre-equilibrated in Buffer A. Fusion protein was eluted with a high imidazole Buffer B (500 mM NaCl, 20 mM dibasic Na2(PO4) pH 8.0, 10% glycerol, 500 mM
imidazole, 0-1 mM EDTA, 0.01% azide) after washing the column to baseline, as monitored by A280,
with Buffer A. The affinity tags were removed by cleavage with 4% (w/w) TEV protease during dialysis overnight into Buffer A at 4°C. The protein was then concentrated to ~ 2 mg/mL and further purified over two sequential 5 mL HisTrap HP gravity columns. Columns were pre-equilibrated in Buffer A. Protein was loaded on to the first column and eluted in Buffer A. Elutent was monitored for the presence of protein using a Bradford reagent. The initial flow-through was collected and then immediately loaded onto a second column. Again, the initial flow-through was collected and
concentrated. Purification of one liter growth resulted in approximately 5 mg purified protein. Nterm_299 samples were separated by SDS-PAGE, stained with Coomassie Brilliant Blue, de-stained, and found to be >95% pure (Figure 2.5C).
15
crystallization. All water was obtained from the laboratory Barnstead E-pure water filtration system, at > 17 megaohm-cm.
2.4 Crystallization, Data Collection, and Data Processing of the pCU1 TraI Relaxase Crystals of WT_299 and Nterm_299 were grown at 20°C by the hanging-drop vapor
diffusion method. Equal volumes of purified protein (WT_299 or Nterm_299) and well solution (250 mM triNa citrate, 22% PEG 3350 (untitrated)) were mixed and crystals grew over a course of 4-5 weeks. Crystals were initially small and hexagonal, but following seeding and the addition of 5 mM MgCl2 to the purified protein sample, larger tetragonal crystals were obtained. The crystals were
cryoprotected in 250 mM triNa citrate, 26% PEG 3350, and 10% ethylene glycol and flash frozen in liquid nitrogen for data collection at 100 K.
Crystals were initially screened at the UNC Biomolecular X-ray Crystallography Facility with a Rigaku R-Axis IV++ and CCD, while full data sets were collected at two different synchrotron sources. For crystals of WT_299, x-ray diffraction data were collected at Southeast Regional
Collaborative Access Team (SER-CAT) Sector 22-ID beamline at the Advanced Photon Source (APS), Argonne National Laboratory. Two second exposures, with a 1.0 degree rotation between exposures were used to collect 180 degrees of data for each of six crystals. Data from the best diffracting crystals were then indexed and scaled with X-ray Detector Software (XDS, MPI for Medical Research, Heidelberg, 2009, http://xds.mpimf-heidelberg.mpg.de/). For crystals of Nterm_299, x-ray diffraction data were collected at the Stanford Synchrotron Radiation Laboratory (SSRL) using remote access of beamline 9-2 ID. Ten second exposures, with a 1.0 degree rotation between exposures, were used to collect 360 degrees of data for each of four crystals. Data from the best diffracting crystals were then indexed and scaled with HKL2000 (HKL Research, Inc., 2005, http://www.hkl-xray.com). Initial phases of data from both constructs were determined by molecular replacement in Phaser (http://www-structmed.cimr.cam.ac.uk/phaser), a component of the
16
DNA substrate and TrwC protein residues 234-271 were removed from the PDB file (1OMH), and the side chains of nonconserved residues were mutated to alanines using Chainsaw 58, 59, a component
of CCP4. Data were refined using refmac (http://www.ysbl.york.ac.uk/~garib/refmac/), a component of CCP4, CNS (version 1.2, http://cns.csb.yale.edu/v1.2), and Phenix (version 1.6,
http://www.phenix-online.org), and model building was performed in Coot
(http://biop.ox.ac.uk/coot). Ligands were found in the standard monomer library in CCP4, on the HIC-Up server (release 12.1, http://xray.bmc.uu.se/hicup/), or were constructed using the Dundee PRODRG2 server (http://davapc1.bioch.dundee.ac.uk/prodrg/). Data were verified using MolProbity (http://molprobity.biochem.duke.edu). Figures were constructed in PyMOL (DeLano Scientific LLC, San Carlos, CA, USA, http://www.pymol.org, 2009). AreaIMol, a component of CCP4, was used to calculate the solvent exposed surface area of each monomer within the asymmetric unit of the crystal. The character of the dimer interface was analyzed using the Protein Interfaces, Surfaces and
Assemblies service (PISA) (version 1.18, calculate the average thermal displacement parameters (B values), Baverage, a component of the CCP4, was used. Structural alignments were performed with TM-align
(http://zhanglab.ccmb.med.umich.edu/TM-align), using the ProCKSI-Server (version procksi-8.7, www.procksi.net), to generate the root mean square deviation (RMSD) of Cα positions of the proteins analyzed. Within Coot, the OptAlign command, using the Kabsch algorithm
(http://pymolwiki.org/index.php/Kabsch), was used to generate the RMSD of atoms within the histidine triad of the proteins analyzed. The coordinates of WT_299 and Nterm_299 have been deposited in the PDB (accession codes 3L57, 3L6T).
2.5 Analysis of the pCU1 TraI Relaxase Structure 2.5.1 The Dimer in the Asymmetric Unit
17
space group P21. Upon analysis of the structural data describing WT_299, the two monomers were
determined to have a combined 20,600 Å2 of solvent accessible surface area of which 1,670 Å2 was
buried upon dimerization. While this analysis could suggest a physiologically relevant dimer 60, only
18 potential hydrogens bonds and 4 potential salt bridges could be formed at the dimer interface, and the structure’s Complexation Significance Score (CSS) of 0.000 indicated that the dimer was most likely to be a result of crystal packing 61. An analysis of Nterm_299 yielded similar results, with only
12 potential hydrogen bonds, 4 potential salt bridges and an equally weak CSS score. In addition, the WT_299 and Nterm_299 proteins were determined to be monomers by size exclusion
chromatography (SEC) (Figure 2.5B, Figure 2.6; see Section 3.2 for details concerning purification by SEC; Nterm_299 data not shown). For both WT_299 and Nterm_299, the electron density of monomer A was consistently higher in quality than that of monomer B. As a result, 223 (WT_299) or 226 (Nterm_299) of the 299 residues were confidently modeled into the electron density of monomer A, while only 203 (WT_299 and Nterm_299) were placed into the electron density of the B monomer (Table 2.1).
2.5.2 The Overall Fold and the Active Site HUH Motif of the pCU1 TraI Relaxase
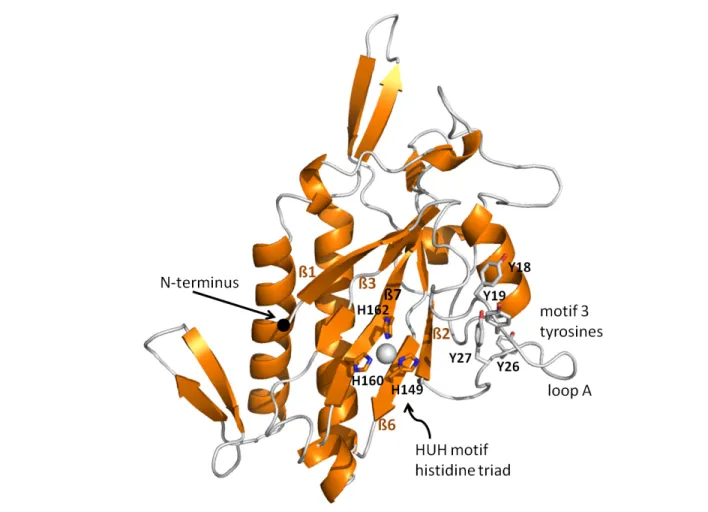
The overall fold of the pCU1 TraI relaxase domain resembles that of a human hand (Figure 2.2) as previously described for homologous relaxase structures (Figure 2.1) 5, 16, 26, 36, 39, 51. The palm
consists of five central anti-parallel β-strands; the surrounding α-helices and β-sheets form the
fingers, back of the hand and bottom edge of the palm. The N-terminus is located at the beginning of the first β-strand (β1), and the remaining strands that compose the palm are in the order β1-β3-β7-β6-β2, when looking at the “palm side” of the protein. The C-terminal 44 (monomer A) and 46
(monomer B) residues of WT_299 are disordered, but are predicted to be α-helical (Figure 2.4). Many of these residues have been placed in structures of homologous proteins, but the entire region has only been observed when the relaxase is in complex with its DNA substrate 5, 36.
18
the HUH(+H) motif and coordinate a divalent metal cation, occupying three of the bound metal’s coordination sites. The remaining coordination sites surrounding the divalent cation are satisfied by a variety of compounds, such as water molecules or components from the cryoprotectant or well solution. For example, in the structure of WT_299, these remaining sites were occupied by the small molecule citrate (monomer A), or a water molecule and ethylene glycol (monomer B). Initially, several divalent metals were sequentially modeled into the active site of WT_299 to fulfill the electron density bound by the histidines. Mn2+, Ni2+, Zn2+, Fe2+, and Cu2+ all satisfied the electron
density as assessed by difference density and R-factors. Mn2+ was later determined to be the most
likely metal in the active site based on a series of activity assays and analysis by inductively coupled plasma mass spectrometry (ICP-MS), as described in Chapter 3. In both monomers of Nterm_299, Ni2+ was placed within the enzyme active site due to its ability to satisfy the electron density as
assessed using difference density maps and R-factors, the use of a Ni-containing column during the purification of Nterm_299, and corroborating results from ICP-MS analysis of the protein. Other than a difference in the identity of the active site metal and the presence of three non-native residues at the N-terminus of Nterm_299 (serine-2, asparagine-1, and alanine0), the overall structures of the two constructs were highly similar with an 0.33 Å RMSD over 220 equivalent Cα positions and a TM score of 0.97454 62, 63.
2.5.3 The N-terminus of the pCU1 TraI Relaxase
To consider the impact the three non-native N-terminal residues could have on the function of Nterm_299, the structures of WT_299, Nterm_299, and the DNA-bound relaxase domain of plasmid R388 TrwC 36 (PDB code 2CDM) were compared (Figure 2.7). The overall folds of the three
19
relaxase as a partial hairpin. The DNA hairpin covers the surface of the of the relaxase above the active site, while a downstream single-stranded segment then wraps around the N-terminus of TrwC, making a hard U-turn into the active site (Figure 2.1). In Figure 2.7c and d, serine-2 of Nterm_299 clashes sterically with thymidine25 of the bound TrwC substrate, aspartic acid-1 clashes with the base and sugar of cytosine24, and alanine0 clashes with the base of guanine22 (all nucleotide base
numbering reflects that of the TrwC structure, PDB code 2CDM ). These clashes predict that Nterm_299 should be incapable of binding its plasmid’s oriT without either physically moving its own N-terminus out of the way, or by binding the DNA in a novel orientation. Both options would disrupt sequence-specific interactions formed between the enzyme and the oriT DNA, in particular those between the N-terminus of the protein and the U-turn of the bound DNA. A series of DNA nicking assays, as described in Chapter 3, validated these structural implications. The importance of such DNA-protein contacts has also been illustrated during DNA binding and nicking assays
involving the F TraI relaxase 29.
2.5.4 The Motif 3 Tyrosines of the pCU1 TraI Relaxase
The four tyrosines of WT_299 and Nterm_299 that are implicated in DNA nicking (Y18, Y19, Y26, and Y27) are located on Loop A, adjacent to the active site of the enzyme (Figure 2.2). In monomer B, only the first few residues of the loop were sufficiently ordered to be modeled into the structure, but in monomer A the entire loop was observed. On the loop, Y18 and Y19 were found displaced from the active site, flipped out and pointing away from the bound metal cation (Figure 2.2, 2.3). In the F TraI relaxase structure, the equivalent tyrosine residues (Y16, Y17) are oriented towards the active site, with Y16 (equivalent to pCU1 TraI relaxase Y18) positioned to attack the scissile phosphate of the DNA substrate 5, 26, 51. The equivalent tyrosines (Y18, Y19) in the R388
TrwC relaxase are also directed towards the active site, with Y18 shifted slightly behind the scissile phosphate, relative to Y16 of the F TraI relaxase 26, 36, 39. When the structure of WT_299 monomer A
20
Y18 of WT_299 was displaced 14.2 Å away from the histidine triad as compared to Y16 of F relaxase and 12.4 Å as compared to Y18 of R388 relaxase.
2.6 Conclusions
Four conclusions are drawn from a structural analysis of the pCU1 TraI relaxase. First, the pCU1 TraI relaxase maintains the conserved fold of the MOB family of relaxase enzymes. Second, Loop A of the pCU1 TraI relaxase, and its accompanying four catalytic tyrosines, assume a unique orientation as compared to that of homologous relaxases. In particular, the DNA nicking tyrosines of Loop A are rotated away from the active site and are displaced from the metal-bound histidine triad (Figure 2.3). Third, the extended N-terminus of Nterm_299 is predicted to clash with DNA bound by the enzyme (Figure 2.7). In fact, as will be seen in Chapter 3, extension of the N-terminus inhibits nicking and elicits mis-nicking by the mutant enzyme. Finally, this structural data, in combination with ICP-MS analysis of WT_299 (see Chapter 3, Table 3.4), and DNA nicking data describing WT_299 (see Chapter 3, Figure 3.4), identifies Mn2+ as the metal most likely bound by the HUH
motif of the pCU1 TraI relaxase. 2.7 Tables and Figures
Table 2.1 Crystallographic Statistics
Figure 2.1 The Structure of the Conjugative Relaxase in Complex with Plasmid oriT DNA Figure 2.2 Structure of the pCU1 TraI Relaxase
Figure 2.3 Structural Comparison of Relaxase Enzymes
Figure 2.4 Amino Acid Sequence Alignment and Secondary Structure of the pCU1 TraI Relaxase Figure 2.5 SDS-PAGE of Purified pCU1 TraI Relaxase
22
Figure 2.1 The Structure of the Conjugative Relaxase in Complex with Plasmid oriT DNA The structure of the plasmid R388 TrwC relaxase was solved in complex with 27 nucleotides of the R388 oriT (PDB code 2CDM 36). The relaxase is shown in green, the DNA in orange and blue. The
DNA is bound as a partial hairpin, with the 3′ end of the partial hairpin extending as single-stranded DNA (ssDNA). The ssDNA wraps around the N-terminus of the relaxase (shown as a black sphere) and then enters the active site. The active site contains the HUH motif. The three histidines
23
Figure 2.2 Structure of the pCU1 TraI Relaxase
24 Figure 2.3 Structural Comparison of Relaxase Enzymes
25
Figure 2.4 Amino Acid Sequence Alignment and Secondary Structure of the pCU1 TraI Relaxase
The initial 337 amino acids of pCU1 TraI (GenBank ID AA27542) were aligned with R388 TrwC (GenBank ID CAA44853) and F TraI (GenBank ID BAA97974) using the Clustal X program in BioEdit. Identical residues are shaded green, similar residues are shaded blue. Orange boxes indicate the first and last residues of the relaxase domains of each protein. Two constructs of the F TraI relaxase domain have been crystallized 5, 51; therefore the terminal residues of both are boxed. Red
26 Figure 2.5 SDS-PAGE of Purified pCU1 TraI Relaxase Molecular weight of WT_299 and Nterm_299 = 34 kD.
A) Lanes represent fractions collected during elution of WT_299 with Buffer C from chitin resin. B) Lanes represent 2 mL fractions collected during elution of WT_299 with Buffer S from a HiLoad 16/60 Superdex 200 column (GE Healthcare).
C) Lanes represent samples of Nterm_299 prior to and following the final affinity purification step using HisTrap HP column. Lane 1 – column load (bands represent cleaved protein and Nterm_299-TEV fusion); Lane 2 – purified Nterm_299 eluting in the flow-through with Buffer A and
subsequently collected; Lanes 3,4 – uncleaved Nterm_299-TEV fusion eluting in Buffer B and subsequently discarded.
Figure 2.6 Size Exclusion Chromatography of the pCU1 TraI Relaxase
WT_299 was eluted with Buffer S from a HiLoad 16/60 Superdex 200 column (GE Healthcare) during the final purification step. MW of WT_299 is 33.9 kD; Void Volume (V0) = 47.5 mL;
Column Volume (VT) = 118.5 mL; Elution Volume (Ve) = 86 mL. Calculated MW from elution
volume = 21.4 kD where Log MW = y = -3.1x + 6.0051 and x = Kav = (Ve – V0)/(VT – V0).
28
Figure 2.7 Structural Comparison of the Relaxase N-terminus
The structures of the wild type pCU1 TraI relaxase (WT_299, PDB code 3L57, shown in orange), N-terminal mutant pCU1 TraI relaxase (Nterm_299, PDB code 3L6T, shown in yellow), and plasmid R388 TrwC relaxase (PDB code 2CDM, shown in green) are compared.
A, B) The overall folds of the three proteins are similar. The R388 TrwC relaxase was solved in complex with 27nts of the R388 oriT DNA (DNA is seen in tiles B,C, and D with an orange sugar-phosphate backbone and green and blue bases); therefore, the C-terminus of this protein was ordered, while it remained disordered in the structures of the two other relaxases. The N-terminal bases of each relaxase and the bound oriT DNA of the R388 TrwC relaxase are shown in detail in C, and D. C) The N-terminal methionines of each protein, as well as the N-terminal non-native residues Ser-2, Asn-1, and Ala0 of Nterm_299 are shown as sticks.
Chapter 3: DNA Binding and DNA Nicking Activities of the Plasmid pCU1 TraI Relaxase 3.1 Introduction to Relaxase Function
As detailed in Chapter 1, the relaxase enzyme functions within a multi-protein complex called the relaxosome to initiate and terminate conjugative plasmid transfer (CPT) (Figure 1.2). Despite the wide variety of conjugative plasmids and relaxase enzymes, all relaxases contain a conserved HUH motif and tyrosine-dominated motif 3. Therefore, it is predicted that all relaxases will incorporate a series of conserved basic mechanistic steps during initiation and termination of plasmid transfer. Structural and functional analyses of a limited number of relaxases have illustrated how these enzymes process the oriT and nic site of their respective plasmid 2, 23, 49. For example, the
DNA-bound structure of the TrwC relaxase reveals that this relaxase binds its plasmid’s oriT as a partial hairpin (Figure 2.1) 36, 39. DNA binding and nicking assays performed with the F TraI relaxase
have determined that the most important protein-DNA interactions for this enzyme are formed between the relaxase and 8-10 nucleotides located immediately upstream of the nic site. All the relaxases characterized to date bind and nick their respective DNA substrate with high affinity and sequence specificity. In fact, DNA nicking by the F TraI relaxase can be eliminated upon mutation of a single base upstream of the nic site 19, 32, 35, 39.
30
conjugative relaxases. In particular, the third tyrosine, Y26, and a combination of the first and second, Y18+Y19, are both able to nick DNA at wild type levels.
3.2 Construct Design, Mutagenesis, Expression, and Purification of the pCU1 TraI Relaxase As described in Chapter 2, the pCU1 TraI relaxase domain is located at the N-terminus of the TraI protein, extending from residues 1 to 299. The wild type relaxase (WT_299) was cloned into the pTYB2 vector of the IMPACT system (New England Biolabs, NEB), and an N-terminal mutant relaxase construct (Nterm_299) was cloned into the vector pMCG9 using ligation independent cloning 57 (see Section 2.2 for details). Tyrosine and aspartic acid mutations were made within the
WT_299 construct in the IMPACT system pTYB2 vector using QuikChange site directed
mutagenesis (Stratagene). All cloning and mutagenesis was verified by sequencing at the UNC-CH Genome Analysis Facility.
Both wild type and mutant proteins cloned into the IMPACT system were expressed in Escherichia coli BL21(DE3), and each protein was then purified on chitin resin (NEB) (see Section
2.2 for details). A final size exclusion chromatography purification step was then performed at 4°C. After concentrating each protein to ~7 mg/mL, 5 mL of each was loaded onto a HiLoad 16/60 Superdex 200 column (GE Healthcare) pre-equilibrated with Buffer S (500 mM NaCl, 20 mM Tris-HCl pH 7.5, 5% glycerol, 5 mM EDTA, 0.01% azide) on an ATKAxpress FPLC (GE Healthcare). TraI was eluted from the column in Buffer S and collected in 2 mL fractions at a 1.2 mL/min flow rate. N-terminal mutant protein (Nterm_299) was expressed in Escherichia coli BL21(DE3) and then purified using a combination of affinity chromatography and affinity tag cleavage by TEV protease, as detailed in Section 2.2.
31
EDTA present. For inductively coupled plasma mass spectrometry (ICP-MS) analysis, a separate expression and purification of WT_299 and Nterm_299 was performed in order to prevent
contaminating the protein sample with metals from outside sources. During this separate purification, the use of all metal-containing devices was avoided. Following purification, the samples were then dialyzed into Buffer ICP (20 mM NaCl, 10 mM Tris-HCl pH 7.5, 0.01% azide). For all applications, samples were flash frozen in liquid nitrogen and stored in 60 µL aliquots at -80°C; water was
obtained from the laboratory Barnstead E-pure water filtration system, at > 17 megaohm-cm (ddH2O).
All protein was separated by SDS-PAGE, stained with Coomassie Brilliant Blue, de-stained, and found to be >95% pure (Figure 2.5).
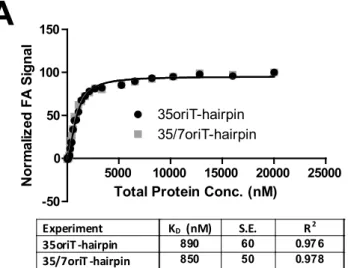
3.3 Characterization of pCU1 TraI Relaxase Stability by Circular Dichroism Spectroscopy The secondary structure and stability of the wild type and N-terminal mutant relaxase domain of pCU1 TraI, both in the presence and absence of a saturating (6-fold molar excess) concentration of a DNA substrate, were determined by circular dichroism (CD) spectroscopy. The DNA substrate, 35oriT-hairpin, was commercially synthesized and HPLC purified (IDT) (see Table 3.1 for sequence). It consisted of the first 35 nt of the pCU1 oriT found upstream of the plasmid’s nic site and was predicted to form a partial hairpin. DNA secondary structure predictions were performed using the M-fold server (http://mfold.bioinfo.rpi.edu/cgi-bin/dna-form1.cgi). The DNA was resuspended in Buffer R (50 mM NaCl, 10 mM Tris-HCl pH 7.5, 0.05 mM EDTA, 0.01% azide), heated to 95°C for 10 min, and then allowed to slow cool to room temperature. Each experimental sample (total volume 400uL) contained a final protein concentration of 6 µM; a final DNA concentration of 0 µM, 24 µM or 36 µM; and 100 mM NaF, 21 mM Tris-HCl pH 7.5, 4.65-5.8 mM NaCl, and 5% glycerol. For each experimental sample, the corresponding blank sample was identical to the experimental sample, minus the protein component.
32
25°C. Due to significant noise at lower wavelengths, only data between 200 nm and 260 nm were processed using Excel 2007 (Microsoft, 2006) and SigmaPlot 8.02a (Systat, 2004). Data were initially collected as ellipticity (mdeg) vs. wavelength (nm), and were then converted to MRE (mdeg*cm2/dmol) vs. wavelength (nm) using Equation 3.1:
Equation 3.1: MRE =𝐸∗𝑀𝑊∗0𝐶∗𝑙∗#.1
where: E, ellipticity; MW, molecular weight of protein construct (g/mol); C, concentration of protein construct in g/cm3; l, path length in cm; and #, number of residues in construct. The same formula
was then applied to the error associated with each data point. CD spectra were then plotted as mean residue ellipticity (MRE, mdeg*cm2/dmol) vs. wavelength (nm). Each data point is the average of
three background subtracted (experimental sample signal – control sample signal) MRE values, and each error bar represents the standard error of the variance of three background subtracted MRE data points.
The resulting spectra were indicative of well folded proteins, with minima at 208 nm and 220 nm for both WT_299 and Nterm_299, though the average signal of the Nterm_299 spectrum was weaker than that of WT_299 (Figure 3.1). When comparing CD spectra of WT_299 collected before and after addition of 35oriT-hairpin, the observed minimum at 220 nm increased in intensity, while the observed minimum at 208 nm weakened in intensity. These shifts may reflect the ordering of the alpha-helical “thumb” region of the protein, which is only seen fully ordered in structures of the relaxase solved in complex with DNA (Figure 2.1).
33
error reported is the standard error as calculated when fitting the data. Upon the addition of the DNA substrate 35oriT-hairpin, the estimated melting temperature (Tm) of WT_299 and Nterm_299 shifted
from 42.7°C to 61°C and from 44.6°C to 54.6° (Table 3.2), respectively, and the transition between folded and unfolded states became significantly sharper. This shift reflected an increased stability of the protein when bound to DNA.
3.4 Characterization of DNA Binding by the pCU1 TraI Relaxase 3.4.1 Introduction to DNA Binding by the pCU1 TraI Relaxase
The relaxase binds a portion of its plasmid’s T-strand oriT prior to cleaving the T-strand nic site 32, 35, 39. We determined the binding affinity and specificity of the pCU1 TraI relaxase for a panel
of DNA substrates (Table 3.1). The effect of DNA substrate length, secondary structure, and sequence on relaxase binding affinity was investigated. In contrast to the high affinity, sequence-specific DNA binding by the F TraI and R388 TrwC relaxase enzymes 32, 35, 39, the pCU1 TraI
relaxase bound DNA in a nonspecific manner and with low affinity (Figure 3.2, Table 3.1). 3.4.2 Methodology
The affinity of WT_299 and Nterm_299 for a panel of DNA substrates (Table 3.1) was measured by fluorescence anisotropy-based DNA binding assays. 5′ fluorescein (FAM)-labeled DNA substrates were commercially synthesized and HPLC purified (IDT). Each substrate was resuspended in Buffer R (50 mM NaCl, 10 mM Tris-HCl pH 7.5, 0.05 mM EDTA, 0.01% azide) heated to 95°C for 10 min, and then allowed to slow cool to room temperature. Each stock was then diluted to 0.1 µM in Buffer R prior to use. For each assay, purified protein was diluted to 2X assay concentration in a final buffer of 50 mM NaCl, 20 mM Tris-HCl pH 7.5, 5% glycerol, 5 mM EDTA 0.01% azide (Buffer B) and then serially diluted, in Buffer B, in a 96- or 384-well black assay plate (Costar) to generate 8 or more unique concentrations of protein, in triplicate. An equal volume of 0.1 µM
34
mixed in three wells. The final buffer concentration during each assay was: 50 mM NaCl, 15 mM Tris-HCl pH 7.5, 2.5 mM EDTA, 2.5% glycerol. To determine the role of metal during DNA binding, the final assay buffer contained either 2.5 mM EDTA or 4 mM metal.
To detect changes in DNA binding as a function of protein concentration, the fluorescence anisotropy (FA) of the fluorescently-labeled substrate at 520 nm was monitored following excitation at 485 nm, using a PHERAstar fluorescence plate reader (BMG Labtech) in a T format, as the protein concentration increased. To generate binding curves and calculate the dissociation constant (KD) for
each experiment, normalized data were plotted as average FA vs. total protein concentration and fit to Equation 3.2:
Equation 3.2 𝑓=𝑚𝑖𝑛+ (𝑚𝑎𝑥 − 𝑚𝑖𝑛)�(𝑇+𝑥+𝐾)−�(−𝑇−𝑥−𝐾)
2−4𝑇𝑥�12�
2𝑇
using nonlinear regression in Graphpad PRISM v5.03 (Graphpad, 2010), where f, average FA signal detected; T, total DNA conc. (set to 50 nM); x, total protein concentration; K, KD; min, average FA
signal of no protein control; and max, average FA signal of sample at a saturating concentration of protein. Each data point is the average of at least three replicates, with error bars representing the standard error of these replicates. For each substrate, the binding affinity and associated standard error, as calculated by Equation 3.2, are provided in Figure 3.2 and Table 3.1.
3.4.3 pCU1 TraI Relaxase DNA Binding Affinity and Specificity
By calculating the affinity of pCU1 relaxase for a panel of DNA substrate (Table 3.1), we determined that both WT_299 and Nterm_299 bound DNA substrates in an oriT- and hairpin-independent manner. The binding affinities of both WT_299 and Nterm_299 were similar for all substrates investigated, and varied between 300 nM and 1.2 μM (Table 3.1, Figure 3.2, Nterm_299 data not shown).
This low affinity, sequence-independent DNA binding was unexpected, given the highly sequence-specific and high affinity DNA binding reported for similar relaxase enzymes 19, 32, 35, 39.
35
spectroscopy (Figure 3.1, Table 3.2), and the design of WT_299 and Nterm_299 incorporated the full extent of the predicted relaxase domain of pCU1 TraI (Figure 2.4). To determine, however, if a longer protein construct would bind DNA with higher affinity or greater sequence specificity, the pCU1 TraI construct WT_411 was cloned, expressed, and purified, as described for WT_299. WT_411 consists of the first 411 residues of pCU1 TraI; its C-terminus was chosen based upon sequence alignments and secondary structure predictions. However, WT_411 bound DNA with an affinity and lack of sequence selectivity similar to that of WT_299.
Therefore, the design of the DNA binding assay was next modified to determine if the experimental conditions could be further optimized for DNA binding. First, the design of the DNA substrate was modified to include the oriT sequence downstream of the nic site (35/7oriT-hairpin), to
determine if this sequence was important for pCU1 TraI relaxase binding. However, no improvement in DNA binding affinity or selectively was observed when determining the binding affinity of
Y18,19,26,27F_299 for this substrate (Figure 3.2a). Second, binding experiments were supplemented with a final concentration of 4 mM MnCl2. This change yielded a modest 2-3 fold increase in DNA
binding affinity (Figure 3.2b). Third, DNA binding was measured over a range of temperatures (22 to 37°C), but this temperature change had no effect on binding affinity. Finally, the total concentration of chloride ions was limited to 45 mM, taking into account contributions from the buffer components Tris-HCl and MnCl2, but still no enhancement in binding affinity was observed.
To determine if the best equation had been used to fit the experimental data, data were also fit by two additional equations using the Graphpad PRISM software (two-sites specific binding, and one-site specific binding with Hill slope). The data were ambiguously fit when assuming two binding sites. When fitting the data with the Hill parameter, the calculated KD did not improve, while the
goodness-of-fit parameters (dependency and R2) showed slight or no improvement. These results did
not justify the use of an additional parameter.