Third Party Candidates for President:
Three Case Studies of Third Party Support
Daniël Scholte 1148192
daniel.scholte@gmail.com Master Thesis
Dr. M.S. Spirova 12 January 2016 9,179 words
Abstract
Despite operating in a firm two-party system, third party candidates in the U.S. have occasionally achieved some level of electoral success in presidential elections. In the 1980, 1992 and 1996 elections, third party candidates have managed to win at least 5 percent of the popular vote. Furthermore, in 2000, a third party candidacy managed to impact the outcome of the election, despite winning only a small share of the vote. By looking into the Anderson, Perot and Nader candidacies, I attempt to find what factors motivate voters to support third party candidates. This analysis is primarily focused on the potential effects of the election year economy and of voters’ legitimacy perceptions of the traditional parties. While economic conditions are believed to have no significant effect on third party support, dissatisfaction with the traditional parties and their candidates did seem to influence voter choice in two of the cases. A brief quantitative analysis of third party support over a forty year period confirm some of these results, but not all.
The American electoral system makes it incredibly difficult for third party presidential candidates to
win significant levels of electoral support (Abramson et al. 1995: 349). Yet, this does not prevent these
candidates from attracting some support in every election (Rosenstone et al. 1984: 4). A few of them
have actually managed to truly captivate the minds of the American people. By far the most noteworthy
example is the Ross Perot candidacy in 1992. In a time characterized by widespread dissatisfaction with
the traditional parties and the political process, a considerable share of the electorate felt attracted to
an outsider who presented them an opportunity to vote against “politics as usual”. Perot ended up with
an admirable share of the popular vote of nearly 19 percent. Due to disappearing partisan attachments,
which makes voters more susceptible to third parties, it is not unthinkable that, at some point, the
two-party system will be seriously challenged by a third two-party contestant. As the level of trust in government
hits an historic low1 and favorability ratings of the two traditional parties remain somewhere well below
the 50 percent mark2, the time seems ripe for the rise of a strong minor party candidate.
The persistent support for third party candidates, while on average quite low, seems surprising, as
1 From a 2015 publication by the Pew Research Center, it appears that a meager 19 percent of Americans have
solid faith in their government. The full report can be found online: http://www.people-press.org/2015/11/23/ beyond-distrust-how-americans-view-their-government/.
voting third party is deemed “an extraordinary act” for American citizens (Rosenstone et al. 1984: 3).
An interest in solving this puzzle is one of the causes of this study. Because of their location outside the
traditional two-party system, third party candidates could very well be considered political outsiders.
Political actors who are commonly referred to as outsiders either lack previous experience in politics
or operate outside the established party system, or both. A more profound definition shall be provided
later on. As a “global tide of anti-political feelings” rises, outsiders are likely to emerge or already have
emerged all around the world (Carreras 2014: 13). The emergence of outsiders in certain regions has
been studied already, e.g., in Latin America which has seen the rise of outsider presidents (Carreras
2012; Mayorga 2006). Beyond this continent, however, the study of outsiders seems to be quite limited.
As a result, the question remains what factors explain the electoral support for outsiders in the more
robust Western democracies. By focusing on minor party candidates, the most common outsiders in
American politics, I hope to achieve a better understanding of outsiders in consolidated democracies
and the circumstances in which these actors are most likely to be electorally successful. As has already
been noted, what makes the case of the U.S. particularly interesting is that the single-member district
plurality system as well as the electoral college make third party support quite unlikely (Rosenstone et
al. 1984: 143). Therefore, the U.S. can be identified as a least-likely case. For this research, presidential
elections are selected as the locus of attention. Linz has argued that “the personalized character of a
presidential election makes possible … the access to power of outsiders” (1994: 26-27). Hence, I suspect
that it is these elections in which third party candidates have most chance of succeeding.
The purpose of this study is to explain what motivates voters to support third party candidates in
presidential elections. Analyzing the candidacies of three quite successful non-major party candidates
should help to gain a better understanding of what explains third party support. This study is primarily
concerned with the potential impact of two factors on third party support: the health of the economy
and voters’ legitimacy perceptions of traditional parties. Subsequently, a limited quantitative analysis
is employed to check whether the findings match possible patterns of third party support. I conclude
that economic conditions are of little influence on the decision to vote third party. By contrast, some
relationship exists between legitimacy perceptions and third party support, although its causality is not
clear. Lastly, it should be noted that the terms ‘third party candidate’, ‘minor party candidate’ and
‘non-major party candidate’ are used interchangeably and also refer to independent candidates.
Theoretical framework
As I consider third party candidates as a manifestation of a broader phenomenon of political outsiders,
first, a definition of outsiders should be provided. However, who exactly classifies as a political outsider
outsiders in terms of the politician’s … experience with the party system” (2009: 33). The politician’s
location with respect to the party system determines whether he is an outsider, an insider or something
in-between, i.e., a maverick – a person who “rises to prominence within an established, competitive
party but then either abandons his affiliations to compete as an independent or in association with an
outsider party, or radically reshapes his own party” (2009: 34). Some nuances have been added to this
categorization later on. Carreras notes that “[Barr’s categorization] leaves out of the analysis candidates
who are new to politics but run on the ticket of a traditional party or in an alliance of many existing
parties” (2012: 1455). Instead of holding on to a hard divergence of insiders and outsiders, he argues
that there are various degrees of “outsidership”. This allows for a distinction of three sorts of outsiders.
Whether someone is a full outsider, a maverick or an amateur depends on his previous experience in
politics and the sort of party he is affiliated with (2012: 1456). Carreras’ definition of a maverick is the
same as Barr’s; a full outsider has no political experience and competes in elections with a new party;
and an amateur lacks a previous career in politics as well, but resorts to established parties (ibid.). Two
indicators have now been identified in the literature: previous experience in politics and location with
respect to the party system. As has been stated earlier, third party candidates qualify as outsiders in
the sense that they fall outside the traditional two-party system. Because of the challenges which the
electoral system poses to minor party candidates, they often find it incredibly difficult to gain electoral
support (Lee 2012: 268). As a result, Congress, for example, is almost fully made up of members who
belong to the two dominant parties. The enduring absence of minor parties in U.S. political institutions
justifies the labeling of minor party candidates as outsiders in American contemporary politics.
Now that some light has been shed on outsiders and the way in which third party candidates fit this
image, the phenomenon of third party voting should be further looked into. Rosenstone et al. have
distinguished two motivations to vote for a minor party (1984: 126). First, citizens are believed to be
more likely to vote third party, when they think the dominant parties have “deteriorated so much that
they no longer function as they are supposed to” (ibid.). Such circumstances occur when the traditional
parties hold different positions on certain issues than a considerable share of the public, or when they
neglect issues which are deemed important by the electorate (Rosenstone et al. 1984: 128-133); when
economic conditions have worsened, although evidence for this is mixed (Rosenstone et al. 1984: 138);
and when voters deem the major party candidates as incapable (ibid.). Second, voters are more likely
to vote for minor party candidates when they perceive these candidates as viable choices (1984: 139).
On the contrary, the likelihood of third party support decreases when loyalty to the major parties or to
the political system as a whole is strong (Rosenstone et al. 1984: 143). Furthermore, third party support
is constrained by structural barriers, such as ballot access restrictions, campaign funding difficulties,
limited media coverage, and anti-third party sentiment (Rosenstone et al. 1984: 144-150).
academic literature on economic voting as well as on citizen’s opinions regarding political parties. The
hypotheses on third party support central to this study are derived from these literary bodies.
First, economic conditions have been identified as a substantial factor that influences voter choice.
In an influential study (1971), Kramer demonstrated a relationship between economic conditions and
electoral outcome. He concluded that incumbents were more likely to win a greater share of the vote
in election years in which economic conditions were good (Kiewiet & Udell 1998: 219). Kramer tested
the effects of inflation, unemployment and change in personal income in the election year and found
that the latter was of most influence on voter choice, which has, since then, located increased attention
on the recent economic performance (ibid.). The theory that voters motivate their choice by reflecting
on recent economic conditions is referred to by Fiorina as “economic retrospective voting” (1978: 428).
However, Kramer’s findings have not remained without controversy and the evidence for the effects of
economic conditions on voter choice remain mixed (Kiewiet & Udell 1998: 221). With regard to third
party voting, it has been argued that minor party candidates are more likely to attain electoral support
when economic conditions are becoming worse (Chressanthis & Shaffer 1993: 264). Gold seconds this,
arguing that “economic anxiety makes support for third-party candidates more likely ... [as] in times of
economic adversity, voters are more willing to gamble on a third-party candidate” (2005: 524). Corrales
has argued that higher levels of economic anxiety help the cause of outsiders (2008: 2). Rosenstone et
al. argue that “citizens may view economic downturns as a failure of the two major parties, which leads
to a higher probability for a third party vote”; however, they also note that “evidence for this is mixed
at best” (1984: 138). While definitely no consensus exists that economic conditions are directly related
to the probability that voters pick the “third party route”, based on the existing literature, I formulate
the following hypothesis regarding third party support in American presidential elections:
H1: Third party support increases when economic conditions have become worse.
Second, a literary body exists that is mainly concerned with demonstrating a relationship between
voters’ political trust and the probability of third party candidate support. Peterson & Wrighton argue
that “voters may translate feelings of distrust into support for candidates outside the traditional
two-party system” (1998: 19). This belief is based on results which indicate that voters with low levels of
trust were more likely to vote for a third party candidate in the 1968, 1980 and 1992 elections (Peterson
& Wrighton 1998: 27). Negative attitudes toward the traditional parties have even been deemed crucial
for third party support: as was noted earlier, Rosenstone et al. have argued that “severe deterioration
of the major parties must take place before significant third party activity occurs” (1984: 127). At the
time such circumstances occur, it is possible that the major parties do no longer reflect the ideas and
opinions of the electorate about certain issues. This is called issue alienation and it might drive voters
has been dubbed a fertile breeding ground for non-major party candidates including Wallace and Perot
(Gold 2005: 524). However, it should be noted that the assumed causality here is not undisputed. Koch,
for instance, has argued that low levels of trust are, in fact, produced by third party candidates (2003:
48). This is further demonstrated by Zaller & Hunt’s (1995) analysis of the Ross Perot candidacy. Thus,
while the causality of the relationship between trust and third party support is far from certain, I come
to the following formulation of the hypothesis on voters’ legitimacy perceptions.
H2: Third party support increases when voters perceive the dominant parties as less legitimate.
Naturally, economic conditions and legitimacy perceptions are not the only factors that might explain
third party candidate support. A vast number of other factors have been identified. First, a candidate’s
personality might be helpful in terms of attracting voter support. For example, it has been argued that
Perot won many votes due to his “engaging personality and plain-speaking manner”, which contrasted
with the negative ratings both Clinton and Bush received (Gold 1995: 755). Furthermore, minor party
success depends on media coverage and access to televised debates (Gold 2005: 525). Third, resources
to finance the third party candidate’s campaign are possibly even more fundamental (ibid.). Finally, the
level of partisanship has been identified as an important factor; it is believed that all other factors have
a much smaller impact on third party support when partisanship is strong (Gold 1995: 753). In addition,
there may be many other alternative explanations for minor party support. However, in the remainder
of this research paper, the focus shall mainly be on the aforementioned factors.
Methodology and case selection
To gain an understanding of how third party support is influenced by the factors mentioned previously,
a qualitative method is used primarily, combined with a limited quantitative analysis to check whether
the results resemble longitudinal patterns of third party support among a bigger population. The first
takes the shape of a case study which includes three cases of third party candidates, the latter consists
of a number of correlational analyses. Identified as the unit of analysis is the electoral performance of
third party candidates in U.S. presidential elections. This concept is operationalized as the percentage
of the popular vote gained by third party candidates in a single election. Since no minor party candidate
ever managed to win a U.S. presidential election, nor a significant share of the electoral vote, electoral
support should be understood as a relative concept in the context of this study. To illustrate this, in
1980, independent candidate John B. Anderson won approximately 7 percent of the popular vote. At
first glance, this does not seem to constitute to a relevant amount of support when compared to the
electoral results achieved by Andersons opponents: 41.0 percent (Carter) and 50.75 percent (Reagan)3.
However, it should be taken into consideration that third party contesters generally do not enjoy the
resources to recruit voters as the major party candidates dispose of. Besides, compared to the average
level of third party support, which lies around 1 percent, Andersons results were definitely noteworthy.
The popular vote is employed as an indicator of support, as the electoral vote, due to the nature of the
electoral system, does not accurately reflect the actual support for third party candidates.
The hypotheses are first tested in explorative case studies of three relatively successful third party
candidates: John B. Anderson in the 1980 election, Ross Perot in the election of 1992, and lastly, Ralph
Nader in the notorious election of 2000. The decision to focus on successful candidates only is primarily
motivated by practical reasons, as there is little data available on voter choice with regard to the less
successful candidates. In addition, the hypotheses of this study are tested on a population of nearly
two hundred third party candidates who ran for president in 11 different elections between 1972 and
2012. Most of these candidates achieved between 0 and 1 percent of the vote, while a few managed
to attain a significantly larger share. Among them are the main characters of the case studies.
I operationalize the independent variables, election year economy and legitimacy perceptions, as
follows. The former is measured by considering the mean GDP growth of the last two quarters prior to
the day of the election, as only recent experiences are deemed significant for economic voting (Fiorina
1978: 428). GDP growth rates were obtained from OECD Statistics, which is available online. In addition
to GDP growth, annual inflation and unemployment rates are taken into account. Inflation rates were
obtained from the online U.S. Inflation Calculator, while the data on unemployment was provided by
the U.S. Bureau of Labor Statistics website. This should have the effect of generating an accurate image
of the state of the economy in a given election year. Subsequently, the effects of legitimacy perceptions
are measured in various ways. First, public trust in government is employed as an indicator. The levels
of trust were demonstrated by the percentage of respondents indicating they trusted the government
“just about always” or “most of the time”. The survey data was obtained from Gallup and from the Pew
Research Center. Another indicator is identified as general satisfaction. Respondents were asked the
question: “In general, are you satisfied or dissatisfied with the way things are going in the United States
at this time?”. A final indicator is party image, which was mapped by asking respondents whether they
had a favorable or unfavorable opinion of the traditional parties. Gallup provided the relevant data for
these last two indicators. Unfortunately, Gallup did not begin measuring the party’s favorability ratings
since the 1990s, which precludes the preceding elections, for this indicator at least, from the analysis.
In this manner, it should be possible to determine voters’ overall perceptions of the status quo.
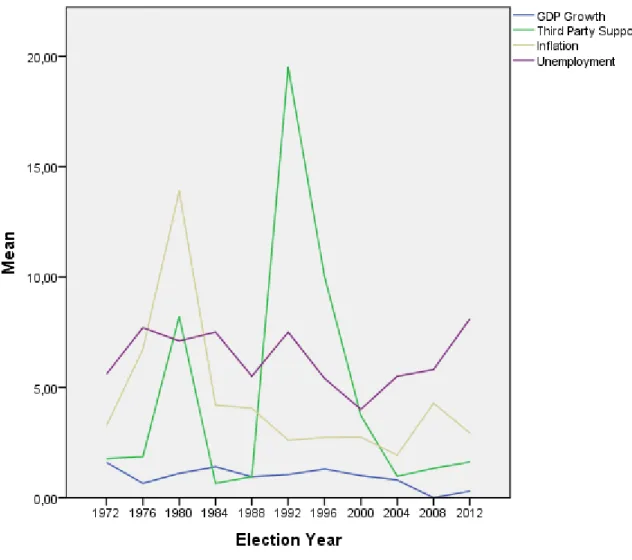
Third party success in the 1972-2012 period
In the period between 1972 and 2012, the overall performance of third party candidates in presidential
candidates in a single election usually varies between 1 and 2 percent. However, in some elections, as
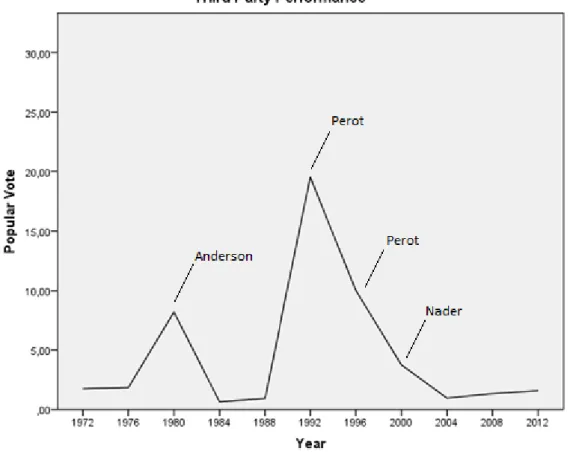
demonstrated in the figure below, this share of the popular vote has been significantly higher. In these
Figure 1. Percentage of the popular vote gained by all non-major party candidates per election.
elections, one candidate is mostly responsible for these peaks. In 1980, independent candidate John B.
Anderson managed to attain 6.61 percent of the popular vote, which amounted to 80.5 percent of all
non-major party votes. In the 1990s, Ross Perot, who started out as an independent as well, was largely
responsible for the best electoral results achieved by third party candidates over the last forty years. In
1992, Perot gained a whopping 18.91 percent of the popular vote, followed up by a more moderate,
although for third party standards still considerable result of 8.40 percent in 1996. 96.8 percent of all
non-major party votes were cast for Perot, the first time he ran for office. In 1996, this number dropped
to a respectable 83.8 percent. The latest peak took place in 2000, mainly due to Ralph Nader winning
2.74 percent of the popular vote; 73.5 percent of all votes cast for non-major party candidates. To put
these numbers in perspective, third party candidates usually operate in a crowded field of participants.
In presidential elections between 1972 and 2012, as many as 17 minor party candidates participated
on average. In all peak years of third party support, the number of third party participants was slightly
above average, with the exception of 2000. What is also worth noting is that this number continues to
Third party success: introducing the candidates
Three cases of third party success will now be discussed, i.e. those of John B. Anderson, Ross Perot and
Ralph Nader. Anderson ran in the 1980 presidential election as an independent candidate. As a member
of the House of Representatives, he first gained prominence with the passing of the Fair Housing Act
of 1968, which earned him national press coverage (Harrison et al. 2010: 361). Nevertheless, prior to
the 1980 election, Anderson was not quite well-known nationally. This would change however quickly
due to an effective campaigning tactic. Anderson started out as a Republican seeking for the Republican
nomination, competing with George H.W. Bush, Ronald Reagan of course, and others. He began strong
in the primaries, nearly securing a first place in Massachusetts and Vermont. However, when it became
clear that the nomination would go to Reagan, Anderson continued as an independent.
In the 1992 election, nearly a fifth of the electorate lent its support to independent candidate Ross
Perot. The dominant parties had not been challenged to that degree in eighty years, since Roosevelt
attained 27 percent of the popular vote. Two days prior to the New Hampshire primary, Perot appeared
on Larry King Live, where he first hinted at a possible candidacy. If the people would make the effort to
register him in all fifty states, he said, he would run for president. Partly thanks to the help of many
so-called volunteers, Perot ended up on the ballot in a every single state. During the spring, he saw his
support grow substantially; and by June, he even surpassed Bush and Clinton in the polls (Abramson et
al. 1994: 40). However, due to increased negative coverage in the media, his support then started to
wane and polls began to hint at a three-way tie. Unwilling to let the election be settled in the House of
Representatives, Perot chose to drop out (Jelen 2001: 20). However, on October 1st, Perot re-entered
the race. What followed was a highly unconventional campaign restricted to commercials and TV show
appearances. Although Perot never again reached the massive level of support he had enjoyed before
his unexpected withdrawal, he still succeeded in winning roughly 19 percent of the popular vote.
The last peak of third party candidate support was caused by Ralph Nader, Green Party candidate
in the 2000 presidential election. Nader only won a modest 2.73 percent of the popular vote, but due
to the incredible closeness of the race, he was able to impact the election outcome like no other third
party candidate had done before him. For that reason, his candidacy has been deemed significant (Allen
& Brox 2005: 627), which is why he is included in this study of successful third party candidates. Nader
has often been referred to as a “spoiler” who cost Gore the presidency (Simmons & Simmons 2006:
230; Hochschild & Wallace 2011: 575). Prior to the election, Nader had been a public figure for years,
having received public attention as early as the 1960s (Ashbee 2001: 159). Thus, in 2000, Nader’s name
was widely recognized by the electorate (Ashbee 2001: 162). His candidacy differed from the Perot and
Anderson candidacies in the sense that Nader was not particularly interested in winning the election.
for federal funding in the forthcoming presidential election (Hochschild & Wallace 2011: 576). Partly
due to his name recognition and vital role in the election, Nader can be considered a viable candidate.
Yet, he was unable of winning a significant share of the vote, nor the 5 percent he hoped to attain.
Third party success: the impact of economic conditions
In this section, the economic conditions in 1980, 1992 and 2000 are looked into in order to find out
whether the election year economy had any influence on the level of third party support. First, the
economic climate is analyzed in the year of Anderson’s campaign. After a couple of prosperous years,
in 1980, real income growth suddenly came to a standstill and workers’ real weekly earnings decreased
by 3 percent (Ferguson & Rogers 1981: 141). Meanwhile, unemployment rose from 5.8 percent in the
previous year to 7.5 percent in mid-1980 (ibid.). Finally, “inflation … was still double digit on election
day”, which must have been really painful for Carter, since the containment of inflation had been an
important target of the Carter administration (Ferguson & Rogers 1981: 141-142). Not surprisingly, in
1980, the electorate punished the Democratic Party for its inability to improve the country’s economic
condition. It has been argued that voters no longer believed that “business and labor” were responsible
for the rising inflation; instead, the government was to be held accountable (Ladd 1981: 19). As a result
of this new thinking pattern, the Democratic Party suffered a heavy electoral defeat and Republicans
won by a landslide. A “throw the rascals out” logic seemed to have driven voters directly into the arms
of Ronald Reagan. The question remains, however, whether a share of these voters turned to minor
party candidates instead, or that virtually all of them ended up voting for Reagan.
Given the bad state of the economy, it is no surprise that Anderson attempted to win over voters
by advocating economic revitalization. Those who did vote for him were even more critical of Carter
than other voters; Anderson voters were also more indifferent towards the major parties, thinking that
neither party would be more capable of handling the country’s problems (Abramson et al. 1983: 180).
For these voters, retrospective evaluations about the Carter presidency and prospective evaluations
about how Republicans would deal with the economy might have driven them to support a viable third
party candidate such as Anderson. However, any effect of Anderson’s economic campaign messages
must have been limited. A substantial share of the electorate knew little about Anderson and what he
stood for. For instance, more than half the electorate failed to rate him on an issue scale, regardless
what issue (Abramson et al. 1983: 178). Furthermore, one out of three voters gave him a 50 point score
on the “thermometer” scale, indicating neutral feelings (Abramson et al. 1983: 174). To conclude, it is
reasonable to assume that economic considerations motivated some voters to support Anderson. Yet,
Anderson’s modest electoral result of 7 percent also indicates the limited success of his campaign.
been hit by a recession and, as a result, unemployment rose from 5.6 percent in 1990 to 7.5 percent in
1992. The inflation rate in 1992 was 3.0 percent, but had been as high as 5.4 percent two years earlier.
Furthermore, the federal government camped with a budget deficit of 413 billion dollars, the highest
deficit since WWII. These conditions plus the enduring pessimism in the wake of the 1987 financial
crash posed some serious challenges to the incumbents. The 1992 election can be characterized by an
unprecedented focus on the economy. It has been stated that Perot was “a major force” behind this
focus and that he thanked his success to it (Jelen 2001: 88). Perot’s campaign revolved around three
issues concerning the economy: the deficit, that had resulted in a debt of 4 trillion dollars; bureaucratic
reform, required to make Washington efficient again; and trade policies that threatened American jobs
(Jelen 2001: 92). Perot’s narrative centered on the deficit proved to be his most successful campaign
theme, as the deficit had become a powerful symbol of the government’s incapacity (ibid.).
Thus, in 1992, there certainly was an economic climate to be exploited by third party candidates.
Indeed, by focusing his campaign on the state of the economy, Perot obviously tried to attract support
on this issue. The question remains whether he succeeded or whether his limited victory was a result
of something else. Voters’ economic motivations in the 1992 election have been studied in the past. In
short, voter choice can be affected by the economy in three different ways: the state of the economy
nationwide can influence a voter’s decision; however, the decision might also depend from a voter’s
own financial situation. A third possibility in which a voter lets economic considerations affect his vote,
is when he takes the long-term economic situation into consideration (Jelen 2001: 108). Jelen has found
that, for the first measure, “support for the incumbent relative to Perot remained quite stable” (ibid.).
For the other two, however, there is evidence that voters preferred Perot over Bush regarding economic
matters. In 1992, voters whose financial situation had worsened compared to 1988 were three times
as likely to cast a vote for Perot than for Bush – compared to twice as likely in the 1996 election (ibid.).
Voters who felt that the economy was in a long-term decline – 54 percent of the electorate – were even
five times as likely to support Perot, relative to the incumbent (Jelen 2001: 108-109). This indicates that
retrospective evaluations about Bush’s handling of the economy motivated voters to favor Perot over
the incumbent president. In addition, based on ANES data, 69 percent of Perot voters considered the
economy as the most important problem facing the country (Abramson et al. 1994: 192). Thus, it may
very well be that economic motivations led a considerable share of voters to support Perot.
From these results, it seems as if Perot’s success was boosted by the poor state of the economy.
However, one should be careful with drawing hasty conclusions. The findings above sketch a somewhat
misleading picture, for they only show support for Perot relative to Bush. When Clinton is included in
the equation, the idea that Perot benefitted from economic conditions does, in fact, not hold up. Based
on ANES data, Alvarez & Nagler find that voters who were most dissatisfied with the national economy
the economy had deteriorated went with Clinton compared to 18.6 for Perot (1995: 718). In addition,
they find that perceptions of the national economy affected voter choice to a greater degree than did
the voter’s own financial situation, but that neither drove voters en masse into the arms of Perot (1995:
731). Of Perot’s campaign themes, only the deficit narrative truly resonated with the public (Alvarez &
Nagler 1995: 737). Despite Perot’s clear economic message to the electorate, voters seemingly believed
Clinton was more likely to have a remedy for the economic situation. In short, it was the economy, that
affected voter choice most visibly in 1992, but not primarily to Perot’s benefit. Voters did punish the
incumbents and “threw the rascals out”, but they simply invited the other dominant party in.
In 2000, economic conditions were quite different than they had been in the early 1990s. The state
of the economy at the start of the new millennium provided little reason for dissatisfaction. GDP growth
in the second quarter of the year constituted to 1.9 percent; in addition, at 4 percent, unemployment
had not been as low in more than thirty years. Furthermore, the budget deficit, which had been such
an important factor in the election of ‘92, had now actually changed into a surplus of 290 billion U.S.
dollars. The sole benefactor of these prosperous conditions should have been Democratic candidate
Gore, heir of the Clinton presidency, but he was not, perhaps because the economy was not identified
as an important issue in the 2000 election (Carter 2007: 14). Given the state of the economy, Nader
was very unlikely to benefit from it. Yet, it is unlikely every single voter was now satisfied with his own
financial situation. Hence, pocketbook voting could still have had some effect. In the past, Nader had
stood up for the economically disadvantaged and had taken a harsh stance against governmental failure
in economic matters. He might have gained support from voters who struggled financially. Hochschild
& Wallace, who studied Nader support in metropolitan areas – identified as main targets of Nader’s
campaign – find that “there is significantly stronger support for Nader in [metropolitan statistical areas]
with higher cost of living and higher levels of income inequality” (584-585). Nonetheless, they also find
that “economic growth nor debt per capita significantly influenced the Nader vote” (585). To conclude,
evidence that economic conditions motivated Nader support in 2000 seems to be sparse.
Third party success: the role of voters’ legitimacy perceptions
In addition to the impact of economic conditions, the role of so-called legitimacy perceptions shall be
looked into. By analyzing the presidential elections of 1980, 1992 and 2000, it should become clear
whether voters’ perceptions of the traditional parties affect the level of third party support.
If there ever was a ‘good’ year for a non-major party candidate to run, it must have been 1980. The
two major party candidates were both not without serious flaws. Jimmy Carter has been characterized
as a “weak, indecisive chief executive” (Rosenstone et al. 1984: 117). Plagued by a worsening economy
found himself in a difficult position. It has been stated that Carter’s incapacity to deal with the country’s
stagflation eradicated all prospects of him being reelected (Ferguson & Rogers 1981: 144). Then, there
was Carter’s main opponent, the GOP nominee Ronald Reagan, “an aging conservative warhorse with
a penchant for foolish statements and a reputation for inactivity” (Rosenstone et al. 1984: 117). Both
Carter and Reagan had favorability ratings that were the lowest “for any pair of major-party candidates
for president” since this measurement was first conducted by Gallup in 1952 (Ladd 1981: 5). Only 30
per cent of respondents awarded Carter a “highly favorable” score, compared to his score of 41 percent
four years earlier, while only 23 percent thought “highly favorable” of Ronald Reagan (ibid.).
Anderson seemed to have a good grasp of his opponents. In a 1981 interview, he stated that:
The feeling seemed to be building up that [1980] was the year to forget about the two old
parties and their candidates that nobody seemed to want. The polls … showed a high degree
of support for me, based on a widespread dissatisfaction with both Carter and Reagan. So I
relied quite heavily on what I thought was this growing sentiment of intense disillusionment
with the old politics, the old parties and their candidates” (Smallwood 1983: 237).
It has been argued that the low approval ratings the traditional party candidates received was a sign of
dealignment and party decay (Ladd 1981: 3). According to several polls and surveys conducted at the
time, up to 40 percent of Americans considered themselves to be independent, as opposed to only 20
percent in the 1950s; among younger Americans this number even rose as high as 50 percent (ibid.).
When dealignment occurs, existing cleavages slowly disappear. Consequently, “a dealigning electorate
becomes increasingly less anchored by group loyalties and attachments to the parties” (Ladd 1981: 11).
Under such circumstances, voters are more likely to ‘defect’ to third parties. In short, given the major
party candidates’ high unpopularity, Anderson’s level of third party support might have been the result
of widespread dissatisfaction with both Carter and Reagan. Yet, it could be reasoned that his election
results would not have been as considerable had the electorate not been so dealigned.
According to Jelen, an electorate deeply dissatisfied with politics and the traditional parties enabled
the success of Ross Perot in 1992 (2001: 64). In the early 1990s, the media devoted increased attention
to “stories of congressional gridlock” portraying the federal government as highly inefficient (Southwell
2003: 100). Furthermore, the worsening economy was a source of deep frustration with the people. In
such conditions, it is no wonder that the public developed a deep-rooted cynicism toward their federal
government and the two major parties. Based on ANES data, it appears that 70 percent of Americans
believed that the government was utterly incompetent; in addition, up to 40 percent believed that at
least a part of the Washington establishment was corrupt (Jelen 2001: 65). ANES data further shows
the public’s indifference and lack of enthusiasm regarding the traditional parties. When asked which
they favored neither of the two parties.4 Their mean “thermometer” rating in the years leading up to
the election is just above 50, indicating neutral feelings.5 It is safe to assume that Perot could not have
wished for a better climate in 1992 – although, of course, he did so publicly in his campaign.
Thus, it could be argued that dissatisfaction enabled a Perot candidacy. However, some evidence
indicates that the causality of this relation might have been reversed; that Perot was responsible for
increasing the electorate’s cynicism with his narratives about the flawed political system. Perot voters
were in fact no more cynical than other voters in 1990 and 1991, but they became far more cynical in
1992, presumably as a result of the Perot campaign (Koch 1998: 146). Furthermore, Alvarez & Nagler
find that so-called “angry voters” – those who were discontent with the political process and aimed for
bureaucratic reform, specifically in the form of term limits for members of Congress – were no more
likely to support Perot than other voters (1995: 732). Although Perot advocated the kind of reform
angry voters hoped for, apparently, that theme of his campaign did not prove to be instrumental in
attracting electoral support. Finally, ANES data show that a mere 5 percent of Perot voters identified
the effectivity of government as the most important problem, compared to 2 percent among traditional
party voters (Abramson et al. 1994: 192). However, while there seems to be little evidence that voters’
negative perceptions of the two traditional parties led them to support Perot, at least some of Perot’s
campaign messages proved to have resonated with a sizeable share of the public on Election Day. This
would have probably not been the case, had the mood of the electorate not been so hostile.
In 2000, the political mood was quite different than it had been a decade earlier. It has been argued
that the anger and distrust that had paved the way for the rise of Perot in 1992 had mostly disappeared
by the turn of the millennium (Ashbee 2001: 167). In early 1998, surveys indicated that only 8 percent
of the public was ‘angry’ with the government (ibid.). The level of trust in government climbed to 40
percent, which was still significantly lower than it had been in the 1950s and 1960s, but nonetheless a
considerable increase (ibid.). These positive developments were likely caused by several changes, such
as a shift of the focus of debate from the government’s handling of the deficit to president Clinton; and
dramatically improved economic conditions (Ashbee 2001: 168). Gallup data shows that, in 2000, only
1 percent of voters perceived federal government finances as the nation’s most important problem,
compared to 15 percent in 1992; likewise, the percentage of voters identifying the economy as the
most important problem had dropped from 46 percent to only 3 percent (ibid.). In sum, it seems that
Nader supporters had much less to be angry about than Perot supporters eight years earlier. In fact,
Nader supporters were not even the voter group where disapproval of the two major parties was most
likely – quite surprisingly, that group consisted of Bush voters (Hillygus 2007: 231). Those who backed
Nader deemed the major party candidates as unqualified for the presidency, but did not per se “[reject]
the policy platforms of the [major] parties” (Hillygus 2007: 232). To conclude, the perceived legitimacy
of the traditional parties appears not to have motivated the Nader vote in the 2000 election.
Patterns of third party support?: the 1972-2012 period
Three examples of third party candidacies have now been analyzed. In order to determine whether the
findings resemble patterns inherent to the whole 1972-2012 period, a number of correlational analyses
has been conducted on the research population. The complete results can be found in tables 1 and 2.
First, possible effects of economic conditions on third party candidate support were studied by taking
into consideration the average GDP growth rates of the first two quarters of all election years between
1972 and 2012; the annual inflation rates in those years; and, finally, the annual unemployment rates.
Together, these factors should be sufficient to provide an accurate image of the state of the economy
in a given election year. When total third party support per election year is correlated with the mean
GDP growth rate in the first two quarters of the election year, results demonstrate little correlation –
the correlation coefficient is determined as 0.24. Analyses which include inflation and unemployment
rates show even less correlation: 0.06 and 0.18 respectively. These results indicate that third party
support in presidential elections between 1972 and 2012 was not significantly motivated by voters’
retrospective evaluations about the economy. This contradicts with theories and assumptions made by
Gold; Rosenstone, Behr and Lazarus; and Chressanthis and Shaffer. All suspected that economic anxiety
increases the likelihood of a third party vote, although with varying degrees of certainty. The results
appear to match with the case study findings of the previous chapters that economic conditions seem
not to have significantly motivated third party support in the 1980, 1992 and 2000 elections.
GDP Growth
Pearson Correlation 0.242Sig. (2-tailed) 0.473
N 11
Inflation
Pearson Correlation 0.063Sig. (2-tailed) 0.853
N 11
Unemployment
Pearson Correlation 0.177Sig. (2-tailed) 0.603
N 11
Table 1. Results correlational analyses of third party support and economic conditions.
Thus, while evidence strongly points in the direction that economic conditions and the level of third
the factors selected here to measure economic health do not accurately reflect economic discontent
among the electorate in some of the election years. In other words, voters sometimes might perceive
the economy as worse than it actually is because they might be influenced by campaign messages. For
instance, it could be the case that economic discontent is more common in years in which the economy
was a major election theme. In 1992, for example, Ross Perot directed much attention to the nation’s
economy. By criticizing the government for letting the budget deficit increase to unusual heights, the
economy became the main focus of the election. This focus grew even stronger when the Democrats
started their own offensive on incumbent president Bush by adopting the now famous phrase It’s the
economy, stupid. Yet, it is not quite clear how frequent the economy actually dominates presidential
elections. In fact, the economic focus of the 1992 election has been called “extraordinary” (Jelen 2001:
87). In addition, it should be noted that voters might look at other factors to evaluate the state of the
economy than the ones selected here. A 2016 study by the NORC at the University of Chicago6 indicates
that voters consider personal finances, wages keeping pace with cost of living, and cost of housing as
more important economic indicators than unemployment rate and national GDP. The first three factors
were regarded extremely or very important by respectively 81, 78 and 68 percent of respondents, while
only 65 and 56 percent granted the more traditional indicators that degree of importance. The question
remains whether voters in the 1972-2012 period resemble the voter of 2016 in this regard.
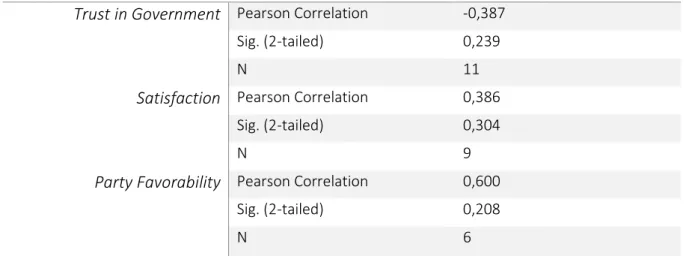
In addition to the role of the economy, effects of voters’ legitimacy perceptions of the two dominant
parties have been tested on the population. For this purpose, survey data from Gallup and the Pew
Research Center were used. Trust in government was operationalized as the percentage of respondents
indicating they trusted government “just about always” or “most of the time”. It seems, at least to some
degree, to be negatively correlated with the level of third party support; the correlation coefficient is
-0.39. This correlation, although being weak, suggests that higher levels of trust in government reduce
the likelihood of a third party vote. However, the significance value hints at a high probability that this
correlation is obtained by chance and is therefore deemed insignificant. Very similar results are gained
when “satisfaction with the way things are going in the U.S.” is correlated with third party support.
Satisfaction and third party support appear to be weakly correlated at first glance, but again, the
p-value suggests too little significance. Third party support was also correlated with the major parties’
favorability ratings. It should be noted here that Gallup only began measuring satisfaction since 1979
and party favorability since the 1990s, which, unfortunately, leaves a number of the elections in the
1972-2012 period out of the analysis. For this last analysis, the mean favorability was used of the two
traditional parties combined. A correlation coefficient is discovered of 0.60, which suggests moderate
correlation. However, once again, the significance value of 0.21 indicates insignificance. These results
are somewhat difficult to compare with the case study findings of the previous chapters. Solid evidence
that widespread dissatisfaction with the major parties significantly increased the likelihood of a third
party vote was found in none of the cases. However, deep-rooted discontent was identified as a factor
that at least helped the causes of Anderson and Perot in the elections of 1980 and 1992.
It has been noted that the consistent lack of correlation might be explained by the fact that the
analysis does not sufficiently resemble reality. However, it might also be explained as follows. When
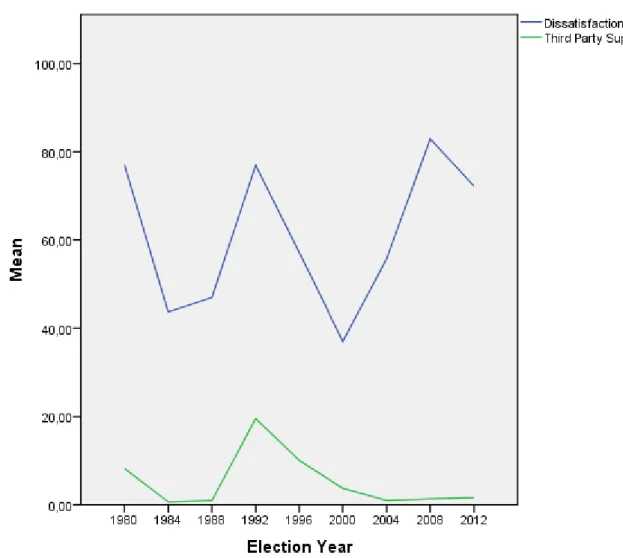
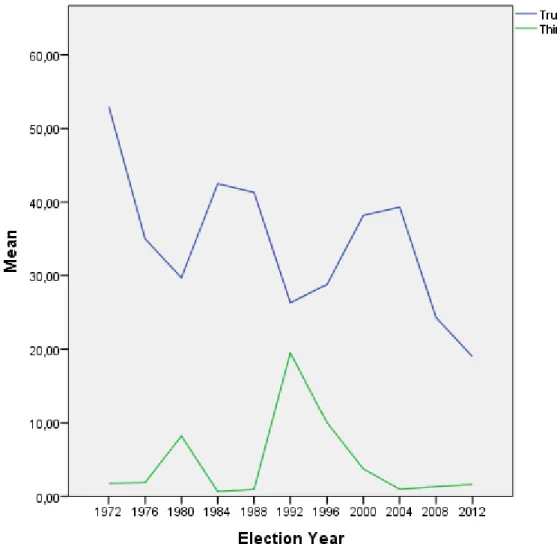
the data is displayed in line charts, a number of observations can be made. These charts are included
in appendix A. First, it appears that the peaks of third party support parallel the peaks of some of the
variables discussed here. For instance, when there is a peak in third party support, there always is a
peak of dissatisfaction. The same applies for trust in government: in 1980, 1992 and 1996, there was
not only a peak of third party support, but also a downward peak of trust in the government. In other
words, when the level of third party support was high, trust in government was low. This has already
been discussed in the chapters that cover the case studies. What is interesting, however, is that some
years do see a peak in, say, dissatisfaction, while third party support remains low. Likewise, there are
years in which trust levels are extremely low, but in which the level of third party support does not
climb above average. Would this have been different, the analyses, of course, would have shown much
stronger correlation. Since 2008, conditions seem quite favorable to third parties: trust in government
has plummeted and dissatisfaction with the way things are going in the U.S. is sky high. Furthermore,
unemployment rates are high and GDP growth is the lowest in forty years. It is remarkable then that,
in 2008 and 2012, no minor party candidate has managed to win a considerable share of the vote. It
could be concluded that a climate favorable to third parties is not always enough to make the rise of a
strong third party contender possible. These candidates still need to overcome substantial barriers,
designed to keep power in the hands of the traditional parties. Besides, there simply might not always
be a candidate with the capabilities and resources to challenge the major party candidates.
Trust in Government
Pearson Correlation -0,387Sig. (2-tailed) 0,239
N 11
Satisfaction
Pearson Correlation 0,386Sig. (2-tailed) 0,304
N 9
Party Favorability
Pearson Correlation 0,600Sig. (2-tailed) 0,208
N 6
To conclude, some confirmation for the case study results is found by quantitatively analyzing third
party support over a period spanning four decades. However, more profound quantitative research is
clearly required to achieve a deeper understanding of the phenomenon of minor party support.
Conclusion
In this study, an attempt was made to shed more light on the causes of third party support – a generally
overlooked topic in the field of electoral studies (Simmons & Simmons 2006: 231). Unfortunately, it
remains uncertain what exactly comprises voters’ motivations to cast a vote for an unlikely winner. Yet,
explorative case studies of the Anderson, Perot and Nader candidacies have pointed out that the state
of the election year economy is of little influence on third party support. This might have already been
predicted by the mixed results of studies that are concerned with explaining economic voting. On the
contrary, there is reason to assume that some relationship exists between voters’ perceptions of the
political status quo and third party support. In two of three qualitatively studied elections, widespread
dissatisfaction with the government, the political process, traditional parties or their candidates existed
among the electorate. It has also become quite clear that the Anderson and Perot candidacies grew
primarily out of this discontent. Without it, these candidates would likely not have been remembered
as well as they are today. Nevertheless, with far less certainty can be stated that the levels of support
they enjoyed were actually caused by voter dissatisfaction. As appears best from the Perot case study,
it might very well have been the third parties’ campaigns that sparked distrust and political cynicism
among the population. The case study findings seem to be supported by the correlational analyses of
third party support; without exception, the conducted analyses were deemed insignificant. Future
research is required to gain a better understanding of the causes of third party support. As levels of
partisanship are expected to decrease further, it seems likely that third party candidates will continue
to challenge the American two-party system in the foreseeable future. Therefore, it is important that
Appendix A.
References
Abramson, Paul R., John H. Aldrich and David W. Rohde. 1983. Change and Continuity in the 1980 Elections. Revised Edition. Washington, DC: Congressional Quarterly Press.
Abramson, Paul R., John H. Aldrich and David. W. Rohde. 1994. Change and Continuity in the 1992 Elections. Washington, DC: Congressional Quarterly Press.
Abramson, Paul R., John H. Aldrich, Phil Paolino and David W. Rohde. 1995. “Third-Party and Independent Candidates in American Politics: Wallace, Anderson, and Perot.” Political Science Quarterly 110 (3): 349-367.
Allen, Neal and Brian J. Brox. 2005. “The Roots of Third Party Voting. The 2000 Nader Campaign in Historical Perspective.” Party Politics 11 (5) 623-637.
Alvarez, R. Michael and Jonathan Nagler. 1995. “Economics, Issues and the Perot Candidacy: Voter Choice in the 1992 Presidential Election.” American Journal of Political Science 39 (3): 714-744.
Ashbee, Edward. 2001. “The Also-Rans: Nader, Buchanan and the 2000 US Presidential Election.” The Political Quarterly 72 (2): 159-169.
Barr, Robert. 2009. “Populists, Outsiders and Anti-establishment Politics.” Party Politics 15 (1): 29-48. Carreras, Miguel. 2012. “The Rise of Outsiders in Latin America, 1980-2010: An Institutionalist Perspective."
Comparative Political Studies 45 (12): 1451-1482.
Carreras, Miguel. 2014. Outsider Presidents, Institutional Performance, and Governability in Latin America. (Unpublished doctoral dissertation). University of Pittsburgh, Pittsburgh, Pennsylvania.
Carter, Amy. 2007. “Did the Gore Campaign Underemphasize the Economy in 2000?” Journal of Political Marketing 5 (4): 1-18.
Chressanthis, George A. and Stephen D. Shaffer. 1993. “Major-Party Failure and Third-Party Voting in Presidential Elections, 1976-188.” Social Science Quarterly 74 (2): 264-273.
Corrales, Javier. 2008. “Latin America’s Neocaudillismo: Ex-Presidents and Newcomers Running for President… and Winning.” Latin American Politics and Society 50 (3): 1-35.
Ferguson, Thomas and Joel Rogers, eds. 1981. The Hidden Election: Politics and Economics in the 1980 Presidential Campaign. New York: Pantheon Books.
Fiorina, Morris P. 1978. “Economic Retrospective Voting in American National Elections: A Micro-Analysis.” American Journal of Political Science 22 (2): 426-443.
Gold, Howard J. 1995. “Third Party Voting in Presidential Elections: A Study of Perot, Anderson, and Wallace.” Political Research Quarterly 48 (4): 751-773.
Gold, Howard J. 2005. “Explaining Third-Party Success in Gubernatorial Elections: the Cases of Alaska, Connecticut, Maine and Minnesota.” The Social Science Journal 42: 523-540.
Harrison, Kimberly, Charlene L. Smith and Jamie Baron Rodriguez. 2010. “John B. Anderson: The Exemplary Dark Horse.” Nova Law Review 34 (2): 347-406.
Hillygus, D. Sunshine. 2007. “The Dynamics of Voter Decision Making Among Minor-Party Supporters: The 2000 Presidential Election in the United States.” British Journal of Political Science 37 (2): 225-244. Hochschild, Thomas R. Jr. and Michael Wallace. 2011. “Three’s a Crowd? The Nader Vote in the 2000
Presidential Election in U.S. Metropolitan Areas.” The Social Science Journal 48 (4): 575:588.
Jelen, Ted G, ed. 2001. Ross for Boss. The Perot Phenomenon and Beyond. Albany, NY: State University of New York Press.
Kiewiet, D. Roderick and Michael Udell. 1998. “Twenty-Five Years After Kramer: An Assessment of Economic Retrospective Voting Based Upon Improved Estimates of Income and Unemployment.” Economics and Politics 10 (3): 219-248.
Ladd, Everett Carll. 1981. “The Brittle Mandate: Electoral Dealignment and the 1980 Presidential Election.” Political Science Quarterly 96 (1): 1-25.
Koch, Jeffrey W. 1998. “The Perot Candidacy and Attitudes toward Government and Politics.” Political Research Quarterly 51 (1): 141-153.
Lee, Daniel J. 2012. “Take the Good With the Bad: Cross-Cutting Effects of Ballot Access Requirements on Third-Party Electoral Success.” American Politics Research 40 (2): 267-292.
Mayorga, René Antonio. 2006. “Outsiders and Neopopulism: The Road to Plebiscitary Democracy.” In Scott Mainwaring, Ana María Bejarano and Eduardo Pizarro Leongómez (eds.), The Crisis of Democratic Representation in the Andes. Redwood City, CA: Stanford UP. 436-455.
Peterson, Geoff and J. Mark Wrighton. 1998. “Expressions of Distrust. Third-Party Voting and Cynicism in Government.” Political Behavior 20 (1): 17-34.
Rosenstone, Steven J., Roy L. Behr and Edward H. Lazarus. 1984. Third Parties in America: Citizen Response to Major Party Failure. Princeton, NJ: Princeton UP.
Simmons, Solon J. and James R. Simmons. 2006. “If it Weren’t for Those ?*!&*@!* Nader Voters we Wouldn’t Be in This Mess: The Social Determinants of the Nader Vote and the Constraints on Political Choice.” New Political Science 28 (2): 229-244.
Smallwood, Frank. 1983. The Other Candidates: Third Parties in Presidential Elections. London: New England UP.