UNCERTAINTIES IN LCA
A pseudo-statistical approach to treat choice uncertainty:
the example of partitioning allocation methods
Angelica Mendoza Beltran1&Reinout Heijungs1,2&Jeroen Guinée1&Arnold Tukker1,3
Received: 12 January 2015 / Accepted: 30 October 2015 / Published online: 12 November 2015
#The Author(s) 2015. This article is published with open access at Springerlink.com
Abstract
PurposeDespite efforts to treat uncertainty due to methodo-logical choices in life cycle assessment (LCA) such as stdardization, one-at-a-time (OAT) sensitivity analysis, and an-alytical and statistical methods, no method exists that propa-gate this source of uncertainty for all relevant processes simul-taneously with data uncertainty through LCA. This study aims to develop, implement, and test such a method, for the partic-ular example of the choice of partitioning methods for alloca-tion in LCA, to be used in LCA calculaalloca-tions and software. Methods Monte Carlo simulations were used jointly with the CMLCA software for propagating into distributions of LCA results, uncertainty due to the choice of allocation method together with uncertainty of unit process data. In this study, a methodological preference is assigned to each partitioning method, applicable to multi-functional processes in the sys-tem. The allocation methods are sampled per process accord-ing to these preferences. A case study on rapeseed oil focusaccord-ing
on three greenhouse gas (GHG) emissions and their global warming impacts is presented to illustrate the method devel-oped. The results of the developed method are compared with those for the same case similarly quantifying uncertainty of unit process data but accompanied by separate scenarios for the different partitioning choices.
Results and discussion The median of the inventory flows (emissions) for separate scenarios varies due to the partitioning choices and unit process data uncertainties. Inventory variations are reflected in the global warming re-sults. Results for the approach of this study vary with the methodological preference assigned to the different allocation methods per multi-functional process and with the continuous distribution of unit process data. The method proved feasible and implementable. However, absolute uncertainties only fur-ther increased. Therefore, it should be furfur-ther researched to reflect relative uncertainties, more relevant for comparative LCAs.
Conclusions Propagation of uncertainties due to the choice of partitioning methods and to unit process data into LCA results is enabled by the proposed method, while capturing variability due to both sources. It is a practical proposal to tackle unre-solved debates about partitioning choices increasing robust-ness and transparency of LCA results. Assigning a methodo-logical preference to each allocation method of multi-functional processes in the system enables pseudo-statistical propagation of uncertainty due to allocation. Involving stake-holders in determining these methodological preferences al-lows for participatory approaches. Eventually, this method could be expanded to also cover other ways of dealing with allocation and to other methodological choices in LCA.
Keywords Allocation . LCA . Methodological choices .
Monte Carlo . Uncertainty Responsible editor: Andreas Ciroth
Electronic supplementary material The online version of this article (doi:10.1007/s11367-015-0994-4) contains supplementary material, which is available to authorized users.
* Angelica Mendoza Beltran [email protected]
1 Institute of Environmental Sciences (CML), Department of Industrial
Ecology, Leiden University, Einsteinweg 2, 2333 CC Leiden, The Netherlands
2
Department of Econometrics and Operations Research, Vrije Universiteit Amsterdam, De Boelelaan 1105, 1081 HV Amsterdam, The Netherlands
3
1 Introduction
Methodological choices are unavoidable in all phases of life cycle assessment (LCA) and are a source of uncertainty (Björklund2002). Methodological choices in LCA refer, among others, to choices about system boundaries (Tillman et al. 1994), functional units, characterization factors (Huijbregts1998), and methods to solve multi-functionality of processes (allocation methods). The latter is one of the most debated topics in the field of LCA (Weidema2000; Pelletier et al.2014; Ardente and Cellura 2012). According to the International Standardization Organization (ISO) 14044 guidelines, the choice of allocation method involves a step-wise procedure (ISO2006): (1a) avoid allocation by dividing multi-functional unit processes; (1b) avoid allocation by expanding the system; (2) divide the system (partitioning) using physical relations between products; or (3) divide the system (partitioning) by other relations of products. The ap-plication of this procedure to solve multi-functionality consti-tutes a source of variability in LCA results of many product systems (Ayer et al.2007; Weidema and Schmidt2010; van der Harst and Potting2014; Luo et al. 2009; Svanes et al.
2011; Guinée and Heijungs2007) and may pose problems in different decision-making situations (Wardenaar et al.2012). Hence, the importance of this specific methodological choice in LCA is evident.
The ISO procedure aimed to create consensus and stan-dardization (Björklund 2002) thus increasing the inter-comparability of LCAs dealing with the same topics. Despite the fact that ISO guidelines are widely applied by practitioners, the consensus reached in practice has been limited (Pelletier et al. 2014; Weidema 2014). Besides fol-lowing standards and guidelines, LCA practitioners may opt to show the influence of different allocation methods on LCA results through sensitivity analysis. If more than one allocation method is applicable to a multi-functional process, one-at-a-time (OAT) local sensitivity analysis is mostly per-formed. The influence of the choice of allocation method on the LCA results is investigated by adopting different sets or combinations of allocation methods in scenarios (Björklund
2002). This approach is very common when partitioning methods are used to solve multi-functionality (Ayer et al.
2007; Weidema and Schmidt 2010; van der Harst and Potting 2014; Luo et al. 2009; Svanes et al. 2011; Guinée and Heijungs2007).
Another approach to treat the choice between methods to solve multi-functionality is based on mathematical arguments. To provide a solution for the system of linear equations of an LCA (Heijungs and Suh2002), the use of the least-squares technique has been investigated (Marvuglia et al.2010; Cruze et al.2014). In this sense, particularly Cruze et al. (2014) favor avoiding allocation over partitioning regardless of the princi-ple arguing that, Bsince the number of solutions to choose
from is infinite, even consensus…would not necessarily lend validity to an LCA study.^
More recently, the study by Hanes et al. (2015) devel-oped an analytical approach dealing with the choice of allocation method: the Comprehensive Allocation Investigation Strategy (CAIS). This approach considers all possible combinations of partitioning methods in a comparative LCA; therefore, it systematically explores the allocation space of various systems. CAIS helps de-termine whether comparisons between various systems are robust as far as the allocation space is concerned.
In a similar line of research, Jung et al. (2013) developed a method for integrating uncertainty of allocation factors in matrix-based LCA calculations and propagating it to LCA results using an analytical approach (i.e., first-order approxi-mations). This method considers the allocation factors them-selves as uncertain input parameters that have a variation and therefore lead to variability in the LCA outputs. It is thus not a method for choosing between allocation methods.
Besides the analytical method of Hanes et al. (2015), there is the statistical approach of Andrianandraina et al. (2015). They apply local and global sensitivity analyses to determine the influence of uncertainty in unit process data and methodological and modeling parameters to the total uncertainty in LCA results. Technical, environmental, and methodological parameters are treated as variables, and using a detailed LCA model for the foreground system, they calculate scenarios dependent on the values of these parameters. Particularly, the partitioning method is treated as a qualitative methodological parameter with a uniform discrete distribution and two possible values that correspond to economic and mass partitioning. Moreover, of the available literature, only Andrianandraina et al. (2015) treat variability of LCA results due to unit process data uncertainty as well as due to the choice of allocation method.
2 Methods
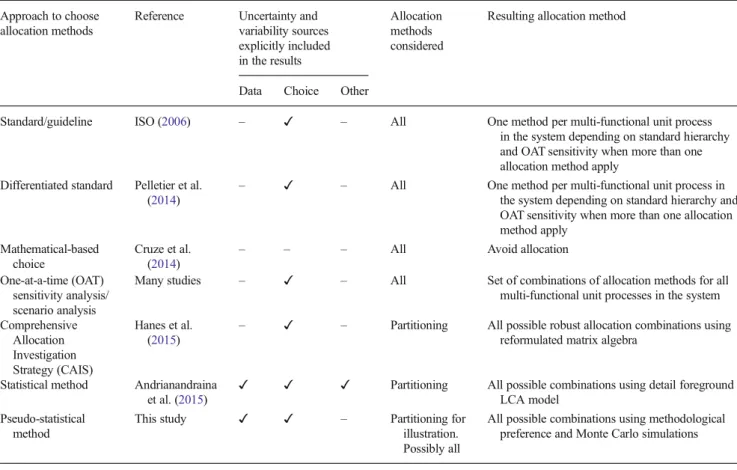
For the development of the method of this article, it is first important to place the method of this study in the space of methods that have a similar purpose (see Table1). For each reviewed method, Table1also lists allocation methods con-sidered, the result after applying each approach, and the sources of variability accounted for. The most sophisticated methods include uncertainty in unit process data, choice un-certainty, and other sources of unun-certainty, leading to results that account for these sources of variability.
In this study, for propagation of the uncertainty of unit process data, we use Monte Carlo simulations as propagation method. Within this sampling-based approach, we now in-clude the discrete choice of allocation method as another ele-ment. Of course, uncertainty of process data and uncertainty of allocation method are distinct. There is a wide natural var-iability for process data, and a probability distribution proper-ly reflects this, so that a sampling method is appropriate. For the discrete choice of allocation method, this is different. There is no natural variability. Nevertheless, we treat it in a similar way, because the effect is similar: In a given situation, we are not sure of the precise process data and we are not sure of the precise choice of allocation method. Therefore, com-bining the uncertainty of data and the spectrum of choices in
one probabilistic setup is defendable. Notice that the usual terms that are appropriate for data uncertainty (uncertainty, probability, statistical, etc.) are not entirely suitable for de-scribing choices. We will therefore in some cases avoid using such words, in other cases add a qualifier (like in Bpseudo-statistical^), and in some cases just use them, tacitly acknowl-edging the changed usage. A short reflection around the— admittedly debatable—terminology used in this study will be provided at the end of the Sect.4.
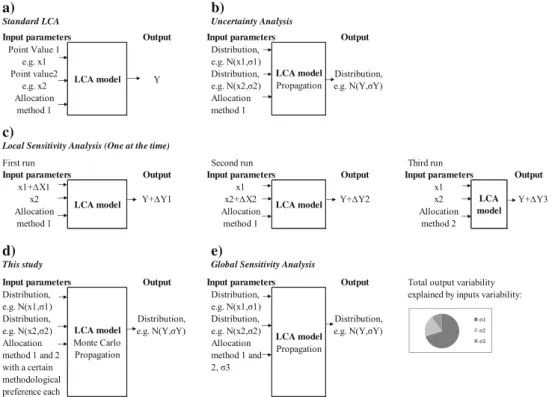
The application of this pseudo-statistical method poses an additional question: Is our method a local or global sensitivity analysis or rather an example of an uncertainty analysis? We argue that our method is closer to the realm of uncertainty analysis because the way we treat unit process data uncertain-ty is an example of a true uncertainuncertain-ty analysis propagating input uncertainties into output uncertainties (Fig. 1b). Moreover, contrary to common OAT practice (Fig. 1c), the choice of allocation method is also propagated using Monte Carlo simulations. The latter is clearly beyond an OAT sensi-tivity analysis and also constitutes the main reason why we consider this study to be more closely related to uncertainty analysis than to OAT sensitivity or scenario analysis. The aim of our method is to simultaneously propagate data and choice uncertainty to LCA results for all relevant processes of a prod-uct system (Fig.1d).
Table 1 Approaches to choose among allocation methods and to deal with other sources of uncertainty and variability
Approach to choose allocation methods
Reference Uncertainty and variability sources explicitly included in the results
Allocation methods considered
Resulting allocation method
Data Choice Other
Standard/guideline ISO (2006) – ✓ – All One method per multi-functional unit process
in the system depending on standard hierarchy and OAT sensitivity when more than one allocation method apply
Differentiated standard Pelletier et al. (2014)
– ✓ – All One method per multi-functional unit process in
the system depending on standard hierarchy and OAT sensitivity when more than one allocation method apply
Mathematical-based choice
Cruze et al. (2014)
– – – All Avoid allocation
One-at-a-time (OAT) sensitivity analysis/ scenario analysis
Many studies – ✓ – All Set of combinations of allocation methods for all
multi-functional unit processes in the system
Comprehensive Allocation Investigation Strategy (CAIS)
Hanes et al. (2015)
– ✓ – Partitioning All possible robust allocation combinations using reformulated matrix algebra
Statistical method Andrianandraina et al. (2015)
✓ ✓ ✓ Partitioning All possible combinations using detail foreground LCA model
Pseudo-statistical method
This study ✓ ✓ – Partitioning for
illustration. Possibly all
Finally, to illustrate the development and implementation of the method, we use the choice among partitioning methods as an example of methodological choice in LCA. This means that methods to avoid allocation will not be considered. In Sect.4, the possibilities of broadening up the application of the method to other ways of dealing with allocation and to other methodological choices are addressed.
2.1 Implementation of a pseudo-statistical propagation method for uncertainty due to the choice of partitioning method
For a multi-functional unit process, one or several partitioning methods can be applied in order to solve multi-functionality. Partitioning factors are defined as the fraction that divides the non-functional economic (i.e., the input products and the output wastes) and environmental flows to the functional flows (i.e., the product of interest) of a multi-functional process (Guinée et al. 2004). For each multi-functional unit process in the system, partitioning factors are defined and applied to enable the calculation of the inventory table. Typically, the sum of all partitioning factors for each partitioning method is equal to 1 (Heijungs and Guinée2007). This is, in very general
terms, the working procedure for partitioning methods using different physical and non-physical principles such as mass, energy content, and economic value.
To be able to introduce pseudo-statistical propagation of the choice of partitioning method in an LCA system, the meth-odological preference (p) (as a percentage) is introduced for each applicable partitioning method per multi-functional pro-cess. This parameter corresponds to a discrete methodological parameter and has been set to a value between 0 and 100 %. The assignment of a methodological preference is a subjective choice offering a possibility to more actively account for dif-ferent views by involved scientists and stakeholders or per-haps accounting for patterns in the partitioning choices al-ready made by relevant literature. For instance, if only one partitioning method is applicable for a multi-functional pro-cess, thenpequals 100 % for that method and process, and if for example, for another multi-functional process, three partitioning methods are applicable, thenp1,p2, andp3should equal a value between 0 and 100 %, all together adding up to 100 %. These methodological preferences define the ranges of methodological preference such that for each range, one partitioning method takes place. The value of a random num-ber from a uniform distribution between 0 and a 100 is then generated and evaluated for the ranges of preference, and in b) a) s i s y l a n A y t n i a t r e c n U A C L d r a d n a t S
Input parameters Output Input parameters Output
Point Value 1 e.g. x1
Distribution, e.g. N(x1,σ1) Point value2
e.g. x2 Y
Distribution, e.g. N(x2,σ2) Distribution, e.g. N(Y,σY) Allocation method 1 Allocation method 1 c)
Local Sensitivity Analysis (One at the time)
n u r d r i h T n u r d n o c e S n u r t s r i F
Input parameters Output Input parameters Output Input parameters Output
x1+∆X1 x1 x1
+ Y 2
x ∆Y1 x2+∆X2 Y+∆Y2 x2 Y+∆Y3
Allocation method 1 Allocation method 1 Allocation method 2 e) d) s i s y l a n A y t i v i t i s n e S l a b o l G y d u t s s i h T
Input parameters Output Input parameters Output Total output variability Distribution,
e.g. N(x1,σ1)
Distribution, e.g. N(x1,σ1)
explained by inputs variability:
Distribution, e.g. N(x2,σ2) Distribution, e.g. N(Y,σY) Distribution, e.g. N(x2,σ2) Distribution, e.g. N(Y,σY) Allocation
method 1 and 2 with a certain methodological preference each
Allocation method 1 and 2, σ3 LCA model LCA model Monte Carlo Propagation LCA model Propagation LCA model Propagation LCA model l e d o m A C L l e d o m A C L σ1 σ2 σ3
Fig. 1 aSchematic representation of a standard LCA using point values for unit process data as input as well as one allocation method per multi-functional process; the output corresponds with a point value for an environmental impact category or inventory flow.b Uncertainty analysis, using ranges, standard deviation, and distributions of unit process data instead of point values as inputs together with one allocation method per multi-functional process to calculate distributions
this way, a partitioning method is determined for each multi-functional process in the system.
In mathematical terms, every time a multi-functional pro-cess is encountered in a system, the following action takes place: A random deviatex is drawn uniformly between 0 and 100, and depending on its value, a certain allocation choice (partitioning in this case) is implemented.
Allocation method
¼
x ∼U ð0;100Þ
method 1 if x ∈ ½0;p1 method 2 if x ∈ p1;p1 þp2 method 3 if x ∈ ðp1þp2;p1þp2þp3
…
method 3 ifx∈ðp1þp2þp3þ…þpn−1;100 8
> > > > > < > > > > > :
After definition of the parameters introduced above, a method to propagate uncertainties to the LCA results is select-ed. For this, several methods exist and have been used in LCA (Groen et al.2014; Heijungs and Lenzen2014). Among the most widely used ones are sampling methods such as Monte Carlo (MC) simulations that rely on determining the probabil-ity distribution of the results by brute computing force pro-gressively increasing in time (Heijungs and Huijbregts2004). Other methods such as Latin hypercube simulation, which uses a more efficient random sampling, could be used for propagation too (Groen et al.2014). However, given the aim of the paper, we focused on the most widely used and intui-tively easiest approach: MC.
To propagate the uncertainty due to the choice of partitioning method using the described parameter definitions, MC simulations were adopted for the repeated random sam-pling. The larger the number of runs, the more combinations of partitioning choices could be taken into account in the results. In case the same number of partitioning methods applies for all processes, the total number of partitioning scenarios for a system with multi-functional processes and several partitioning methods applicable to each process would be equal to the total amount of multi-functional processes to the power of the number of partitioning methods possible. For instance, Guinée and Heijungs (2007) found 54B multi-output^processes linked to passenger car and diesel systems in the ecoinvent v1.1 database (Swiss Centre For Life Cycle Inventories2004). From these, only seven were selected for the study by means of a contribution analysis. The study looked at the influence of economic partitioning, physical partitioning, and the ecoinvent default partitioning on the LCA results. A full scenario analysis for all partitioning methods would have implied 543, i.e., 157,464 possible partitioning scenarios, nonetheless only three were con-sidered, i.e., the seven selected multi-output processes using either economic, physical, or ecoinvent v1.1 de-fault partitioning.
With the method proposed here, the analysis of a system with a relative large number of multi-functional processes and/ or partitioning methods, such as that of Guinée and Heijungs (2007), would become computationally feasible, by capturing most (if not all) possible partitioning scenarios by means of MC simulations without actually having to define scenarios.
2.2 Case study
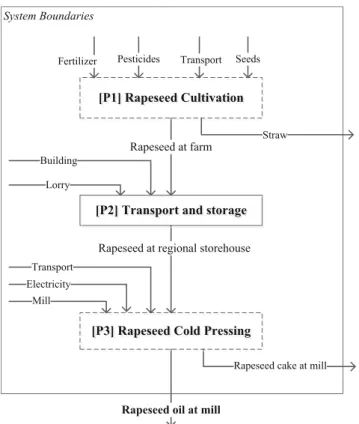
The approach described in Sect. 2.1. has been implemented in the CMLCA software (CML2014) version beta 5.2 and has been tested with a simple system: rapeseed oil production in Northern Europe, as shown in the flow diagram of the system in Fig.2. The system is similar to the one implemented by Wardenaar et al. (2012); however, here it stops at rapeseed at mill in order to concentrate on the really important novel as-pect. The focus of the case study is on the only two multi-functional processes: [P1] rapeseed cultivation and [P3] rape-seed oil extraction by cold pressing of raperape-seed. Process [P1] produces straw and rapeseed, and process [P3] produces rape-seed oil and raperape-seed cake at mill. Thus, both processes are multi-functional and require allocation. The functional unit is 1 kg of rapeseed oil at mill, and the system includes the pro-duction, storage, and transport of the main inputs to the three foreground processes shown in Fig.2. The entire background system is specified using ecoinvent data version 2.2 (Swiss Centre For Life Cycle Inventories 2007) which is already allocated. The background system remains constant for all the scenarios analyzed in this study. Scenarios result from combinations of the partitioning methods selected for process [P1] and process [P3], as will be further specified. A detailed description of the implementation of the system is available in theElectronic Supplementary Material.
For the two multi-functional processes, two partitioning methods are identified as applicable. In the case of [P1] (rape-seed cultivation), 100 % partitioning, i.e., assuming that the straw is ploughed through the soil, and therefore all flows should be allocated to the rapeseed is the first option (Wardenaar et al.2012b). The second partitioning principle identified is based on the mass of straw and rapeseed which is found for the typical production of rapeseed and straw in Northern Europe in van der Voet et al. (2008), and although in their study, they use 100 % partitioning, mass is another pos-sibility for allocation. In the case of [P3] (rapeseed cold press-ing), partitioning based on energy content and economic values of co-products could hold and the same partitioning factors as defined by Wardenaar et al. (2012) are used. Table2shows the partitioning factors per co-product for each of the partitioning methods and multi-functional processes described above.
influence of different partitioning methods (i.e., without choice uncertainty) and process data uncertainty propagated with MC simulations. The second set corresponds to the LCA results for the case study using the method implemented in Sect. 2.1 to propagate the uncertainty due to the choice of partitioning method while also accounting for process data uncertainty and both sources of uncertainty propagated with MC simulations. The former LCA results are referred to as Ballocation scenarios^or simply asBscenarios^(i.e., exclud-ing choice uncertainty) and the latter as the results ofBthis study^(i.e., including choice uncertainty).
The scenario results are calculated for four scenarios de-fined by the combinations of two multi-functional processes in the system with two applicable partitioning methods in each process. To include unit process data uncertainty, the method of Henriksson et al. (2013) was used to determine the unit process data distributions where possible despite that there are other methods available (van der Harst and Potting2014; Hong et al.2010; Imbeault-Tétreault et al.2013; Heijungs and Lenzen2014). Moreover, for propagation, we used MC sim-ulations with a sample size of 1000 simsim-ulations for each of the four allocation scenarios. Further, as shown in Table 2, the methodological preference assigned to one partitioning meth-od per multi-functional process in each scenario corresponds to 100, because as stated in Sect. 2.1, choosing for one method corresponds to 100 % preference of that method.
For the calculation of the LCA results of this study, the unit process data uncertainty and the choice of partitioning are simultaneously propagated, using MC simulations based on unit process data distributions (same as in the allocation sce-narios) and the methodological preference for the choice of partitioning method as defined in Table2. A 50 % methodo-logical preference has been arbitrarily chosen for all applica-ble partitioning methods in both multi-functional processes in the case study, but although arbitrary, this preference allows an equal representation for all the methods enabling one to prop-agate uncertainty due to the choice of method. A total of 4000 MC simulations are run to create a representative sample to cover all possible partitioning scenarios. One would expect to be able to do with fewer simulations in order to have a com-putational gain compared to the 1000MC simulations for the four scenarios. However, as the aim of case study is to test the method, it was decided to have the same amount of runs in order to increase the chance of covering all partitioning com-binations. Besides, for a more complex system (with more than two multi-functional processes), the computational gain becomes more evident as the chance of reproducing all partitioning scenarios is low, while the feasibility of capturing Rapeseed at regional storehouse
Transport Lorry
Fertilizer
Rapeseed oil at mill
Rapeseed cake at mill Mill
Electricity
Pesticides Transport Seeds
Building
Straw Rapeseed at farm
System Boundaries
[P1] Rapeseed Cultivation
[P2] Transport and storage
[P3] Rapeseed Cold Pressing
Fig. 2 System for rapeseed oil production in Northern Europe.Boxes represent processes;dashed boxesare multi-functional processes
Table 2 Allocation parameter definition as used in the case study
Methodological preferencep(%)
Multi-functional process Partitioning method/principle Co-product Partitioning factor
Scen1 Scen2 Scen3 Scen4 This
study
[P1] Rapeseed cultivation
100 % partitioning Straw 0 100 0 0 100 50
Rapeseed 1
Mass partitioning Straw 0.43 0 100 100 0 50
Rapeseed 0.57
[P3] Rapeseed cold pressing
Energy content partitioning Rapeseed oil 0.55 100 100 0 0 50
Rapeseed cake 0.45
Economic value partitioning Rapeseed oil 0.7 0 0 100 100 50
Rapeseed cake 0.3
them with the method of this study is higher. These results are expected to cover the full range of the scenario results without choice uncertainty.
Finally, as an example of inventory results, only the main greenhouse gases (GHG), i.e., carbon dioxide (CO2), methane (CH4), and di-nitrogen monoxide (N2O) will be presented, as well as the LCIA results for global warming using the IPCC (2007) global warming potentials for a 100-year time horizon.
3 Results
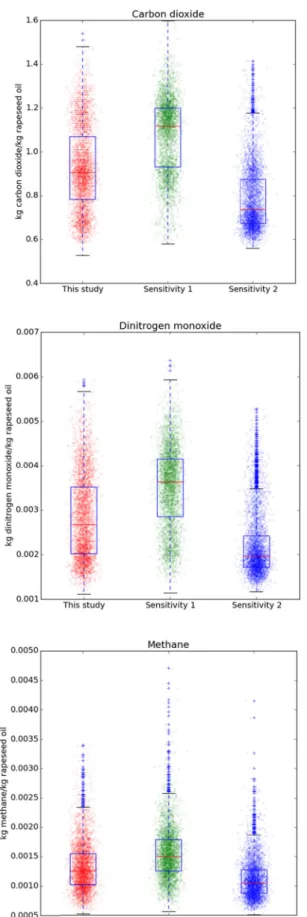
The median of the life cycle inventory (LCI) results for the allocation scenarios varies for carbon dioxide emissions from around 0.7 to 1.2 kg CO2/kg of rapeseed oil, for methane emissions from around 1.0 to 1.7 g CH4/kg of rapeseed oil, and for di-nitrogen monoxide emissions from around 1.8 to 4.0 g N2O/kg of rapeseed oil (Fig.3, left panels). Thus, the differences between the median values of the scenarios only follow the choice of allocation methods for the two multi-functional processes in the case study.
Figure3shows the absolute GHG emissions per kilogram of rapeseed oil at mill for the 1000 MC simulations (left panels) for each allocation scenario separately including a statistical propagation of unit process data uncertainty. As ex-pected, for those allocation scenarios with higher allocation factors for rapeseed and rapeseed oil (scenarios 1 and 4), the GHG emissions for the system studied are higher. The range that results for each of the allocation scenarios is smaller than the range resulting from all together. This indicates that sce-nario analysis can be misleading if all possible scesce-narios are not taken into account in the results.
Moreover, Fig.3shows the absolute GHG emissions per kilogram of rapeseed oil at mill for the 4000MC simulations for the method introduced in this study (left panels column labeledBThis study^). The results cover the full range of the four possible allocation scenarios but without separating be-tween different scenarios as is seen in Fig.3 (left panels, scenario 1, 2, 3 and 4 vs. This study).
The histograms displayed in Fig.3(right panels) show the distribution of the LCI results for the method of this study and the allocation scenarios.
For each allocation scenario, there is a peak around the median of the LCI results, and for the method of this study, an overlapping distribution is observed. For instance in the case of CO2emissions, there are three observable peaks (not four as the peak of scenarios 1 and 3 overlap) which coin-cide with the medians of the allocation scenario. This out-come is also observable in the left panel graphs of Fig.3, in the form of more dense clouds of points around certain values of emissions; however, it is not always so clear in the whisker plots and this is the main reason for presenting the same results also in histograms.
Figure4(left panel) shows the global warming results for the same four scenarios and for the method developed in this study. The contribution of emissions to the global warming results varies depending on the allocation scenario between 49 and 55 % for CO2, around 2 % for CH4, and between 43 and 49 % for N2O emissions. Moreover, the scenario results now show less overlap, which is reflected by the histograms that more clearly show four discernible peaks around the medians of the allocation scenarios.
4 Discussion
The method presented here to simultaneously propagate un-certainties in unit process data and due to the choice of partitioning methods is based on the introduction of the meth-odological preference of each applicable partitioning method for all multi-functional processes in a system.
In the case study presented, an equal methodological pref-erence for all allocation methods applicable to the multi-functional processes in the systems was used. An equal meth-odological preference for all methods is of course an arbitrary choice, which can be made differently and in a more sophis-ticated way. One way to determine the methodological prefer-ences of allocation methods could be to involve scientists, experts, and stakeholders of specific sectors whose preference for the different allocation methods could be taken as basis for determining these values. Another way could be to determine patterns in the allocation choices already made by means of a meta-analysis (van der Voet et al.2010) of existing case stud-ies preferably specific for rapeseed oil.
Moreover, the methodological preference may influence the case study’s results. We have investigated this influence by performing two distinct OAT sensitivity analyses. The two sensitivity analyses are variations of the two most extreme allocation scenarios, i.e., scenarios 2 and 4, arbitrarily chang-ing the values ofpas shown in Table3with the aim of ex-ploring the effect of this parameter on the results.
Figure 5 illustrates the results of the sensitivity analyses compared to the equal methodological preference originally adopted for the case study.
distributions are more sampled for values on the tails of the distributions.
As mentioned before, to calculate the uncertainty due to the choice of allocation method in separate scenarios and not in-tegrated with the MC-based propagation of unit process data uncertainty, results have to be calculated for at least four sce-narios for the simple case study (including only two multi-functional processes with two possible allocation methods each) and to run1000 MC simulations for each scenario in order to propagate LCI data uncertainty to the LCA results. This is a time consuming and a hardly ever performed work, and even less for more complex systems. In this context, the method proposed here accounts in a pseudo-statistical manner for a representative sample of possible combinations and shows a representative range of possible results for a system with its likelihood (i.e., distribution) demanding less time from the practitioner than a normal setup of an OAT sensitivity analysis but perhaps demanding more time for computation. The time spent in the case study for separate scenarios is the same as used by applying the method of this study, if the same
number of MC simulations is adopted. However, we adopted more MC simulations for our method in order to ensure that all possible combinations of both data and allocation methods are sampled. For this reason, the time demand of our method is higher.
It can also be argued that this method could be intensive in terms of computing capacity requirements as it uses MC sim-ulations as a propagating method. Nevertheless, analytical methods do not yet exist for propagation of the choice of allocation methods, and we doubt if this is possible at all. Relying on increasing computational capacity, we consider the proposed method as a good alternative to tackle two of the main sources of uncertainty in LCA in an integrated way. Possibilities for more efficient statistical propagation methods (e.g., Latin hypercube sampling) also remain a topic for fur-ther research.
Another point for discussion is the increased total uncer-tainties shown in the results of the method of this study, com-pared to those of the allocation scenarios. LCA studies are mostly relevant for comparing two or more alternative sys-tems fulfilling the same functional unit. In the context of com-parative LCA, relative uncertainties (Henriksson et al.2015) play an important role for the application of this method. Therefore, the pseudo-statistical method becomes particularly relevant when comparing two or more alternative systems fulfilling the same functional unit.
Applying the method developed in this study for a compar-ison of two alternatives (A and B), fulfilling the same func-tional unit requires dependent MC sampling and comparison of the inventory and/or characterization results for each run, for example, by subtracting the results from alternative B from
Fig. 3 Left panels: LCI results for the main GHG emissions to air of 1000 MC simulations for the four allocation scenarios and 4000 MC simulations for the method introduced in this study. Thered line represents the median, the lower boundary of theblue boxQ1, and the upper boundary Q3, so the height of theblue boxis the interquartile range (IQR). The range of the whiskers (black horizontal lines) beyond the first and third quartiles is set to Q1(Q3)–(+) 1.5*IQR. Thewhiskersextend from theblue boxto show the range of the data. The data points outside of this range represent the outliers beyond the whiskers and are plotted as blue crosses. Right panels: histograms with a bin size of 100 based on the same MC simulations as in the left panelsFig. 4 Left panel: global warming in kg CO2equivalents as an example
of an impact category for the case study for 1000 MC simulations for the four allocation scenarios and 4000 MC simulations for the method
the results of alternative A (A−B). In this way, each alterna-tive builds upon the same sampled parameters for those parts of the systems that are shared (similar) for both A and B (Henriksson et al.2015). Similarly, we here argue that the same allocation scenarios should be sampled for multi-functional processes that are shared between the two systems A and B. In fact, comparing two or more alternative systems providing the same function could be misguided if different allocation methods are chosen for each system. The method of this study can provide comparable relative results simulta-neously accounting for the same or varying allocation choices and LCI data uncertainties where pertinent, which would be more meaningful information than the full absolute range of uncertainty as shown, for example, in the case study.
One could think that information about the influence of the allocation choice is disguised as the range of absolute uncer-tainty only increases. However, a global sensitivity analysis (Fig.1e) could reveal back the influence of the choice in the results. The contribution of uncertainty of the input parameters to the total uncertainty of the outputs can be identified. Therefore, one could prioritize the main contributors to the total uncertainty, and reduction of the overall uncertainty could be strived for, on the basis of which better data could be collected and/or consensus on allocation methods to be applied. This would never be possible with OAT sensitivity scenarios for allocation methods alone for a full-scale LCA. Exercises such as a comparative LCA and a global sensitivity analysis are, however, out of the scope of the present article and a topic for further research.
The method was presented for the example of dealing with the choice dilemma in solving multi-functionality by partitioning. The method could, however, also be applied to a higher level of choices for solving the multi-functionality problem. For instance, in the realm of consequential LCA, various scenarios of substitution or system expansion could also be assigned a methodological preference. In the realm of attributional LCA, as explored in the case study, various partitioning principles can be accounted for. As mentioned
in other studies too, there is not one single way of solving multi-functionality in LCA (Guinée et al.2004; Wardenaar et al. 2012), even when accepting that the solution should serve the purpose of the LCA (Pelletier et al.2014).
The method could also be applied to other choices than only the one related to multi-functionality as long as the choice can be represented as a discrete choice. Then, a meth-odological preference can be assigned to each option, and the uncertainty introduced by the choice can be propagated into LCA results. For example, in the case study, the 100-year global warming potential (GWP100) was adopted to calculate the global warming results. We could also have adopted the GWP20or GWP500. Assigning a methodological preference to the GWP20, GWP100, and GWP500characterization factors and using the method developed in this study would lead to inclusion of the influence of characterization factors simulta-neously with the choice of allocation method and LCI data uncertainty, if desired. For this example, the calculation works correctly as long as the characterization factors for the differ-ent time horizons lead to the same type of LCA results, i.e., in kg of CO2equivalents. On the other hand, if for example characterization factors for different methods lead to different type of results such as different type of units and scales, the method presented here could not be directly applied because the units could not be comparable among the different choices. In summary, the method developed in this study is valid for all discrete choices leading to comparable results.
Finally, we would like to discuss the terminology used throughout the article. As explained in the methodology sec-tion, we believe that this pseudo-statistical method is closer to the domain of uncertainty analysis, given that not only unit process data is propagated but also the methodological pref-erence of allocation methods are propagated too by means of a statistical method (in this case Monte Carlo), to the LCA re-sults. We are aware though, that for example, Andrianandraina et al. (2015) account for the propagation of the uncertainty due to methodological preference of allocation methods to the LCA results as a way of sensitivity analysis, therefore placing Table 3 Allocation parameter definition as used in the sensitivity cases
Methodological preferencep(%)
Multi-functional process
Partitioning method/principle
Co-product Partitioning factor
This study Sensitivity 1
(variation of scenario 2)
Sensitivity 2
(variation of scenario 4)
[P1] Rapeseed cultivation
100 % partitioning Straw 0 50 80 20
Rapeseed 1
Mass partitioning Straw 0.43 50 20 80
Rapeseed 0.57
[P3] Rapeseed cold pressing
Energy content partitioning Rapeseed oil 0.55 50 80 20
Rapeseed cake 0.45
Economic value partitioning Rapeseed oil 0.7 50 20 80
Fig. 5 Left panels: LCI results for the main GHG emissions to air of 4000 MC simulations for the method introduced in this study using three different sets of methodological preferences for the allocation methods as
their method in the realm of sensitivity analysis. Independent of the type of analysis and admitting the debate around the semantics used to refer to our method, we consider more im-portant the fact that robustness is added to the results by ex-plicitly accounting for various sources of variability.
5 Conclusions
Methodological choices are unavoidable in all phases of LCA and are a source of uncertainty. Among these choices, practi-tioners typically choose between different methods to solve multi-functionality, and within partitioning methods, different choices can be made again. Unresolved debates on these choices constitute a major source of uncertainty in LCA re-sults. Ways to deal with this issue include standardization, OAT sensitivity analysis, and analytical and statistical methods for uncertainty analysis. Standardization reduces un-certainty, while OAT sensitivity analysis serve to analyze the system using specific combinations of allocation methods, in order to show a range of possible results. The full range of results given all possible choices for allocation methods and combinations in a system with several multi-functional unit processes is only shown by means of statistical and analytical methods, however. Not showing all (or very many) possible combinations can be misleading when evaluating the environ-mental impacts of a production system and when comparing two or more systems even more. In addition, so far, only one study showed all combinations of allocation methods, as well as accounting for unit process data uncertainty.
This study proposed, implemented, and tested a pseudo-statistical method (not pseudo-statistical in the strict sense of the word) to enable the use of Monte Carlo simulations as a statistical approach to simultaneously propagate uncertainty in unit pro-cess data and uncertainty due to the choice of partitioning methods to LCA results. For this purpose, the methodological preference was introduced and assigned to each partitioning method for each multi-functional process in a system. The assignment of a methodological preference involves an arbi-trary choice offering a possibility to more actively account for different views by involved scientists, experts, and stake-holders or patterns from meta-analysis of existing case studies. The distribution of LCA results was analyzed for a very simple case study, with and without the previous approach and in both cases including LCI data uncertainty. We conclude that the proposed method enables in a relatively simple way, i.e., with a few additional parameters and computational calcula-tion capacity dependent on the system, the propagacalcula-tion of uncertainty due to the choice of partitioning methods to solve multi-functional problems and data uncertainty into LCA re-sults while not requiring a detailed foreground model for the foreground system.
It is concluded that this method can be particularly useful when comparing relative uncertainties of several alternative systems, as increased absolute uncertainty in the LCA results does not necessarily lead to more meaningful conclusions. Moreover, information about the contribution of choice and data uncertainty to the total uncertainty could be further pro-vided by, for example, a global sensitivity analysis. However, these are topics for further research.
In addition, the results of the application of the method provides a more transparent and robust base for comparative LCAs than OAT sensitivity analyses or uncertainty analyses only accounting for uncertainty in unit process data or subsets of combinations between data and allocation methods. More sources of uncertainty are explicitly accounted in the results by making explicit the methodological preference of an allo-cation method per multi-functional process.
Moreover, exploring the implementation of the proposed method for higher levels of choices in LCA, such as methods to solve multi-functionality in a broader sense and other meth-odological choices in LCA is another topic for further re-search. We argue that the method will also be valid for these choices as long as they can be represented as discrete choices and lead to comparable results. Furthermore, implementation and testing of the method for more complex systems, i.e., higher numbers of multi-functional processes with various applicable allocation methods, is also required. We believe that a trade-off between time spend by the practitioner in set-ting the analysis and calculation time could take place for more complex systems.
Acknowledgments This research has been done as part of the Increas-ing Industrial Resource Efficiency in European Mariculture project (IDREEM; www.idreem.eu) and has received funding from the European Union’s Seventh Framework Programme (FP7/2007-2013) under grant agreement no. 308571. The authors would also like to acknowledge the invaluable contribution by Ruben Huele to the data visualizations of this study and to Valentina Prado for her insightful comments.
Open AccessThis article is distributed under the terms of the Creative Commons Attribution 4.0 International License (http:// creativecommons.org/licenses/by/4.0/), which permits unrestricted use, distribution, and reproduction in any medium, provided you give appropriate credit to the original author(s) and the source, provide a link to the Creative Commons license, and indicate if changes were made.
References
Ardente F, Cellura M (2012) Economic allocation in life cycle assess-ment. J Ind Ecol 16(3):387–398
Ayer NW, Tyedmers PH, Pelletier NL, Sonesson U, Scholz A (2007) Co-product allocation in life cycle assessments of seafood Co-production systems: review of problems and strategies. Int J Life Cycle Assess 12(7):480–487
Björklund AE (2002) Survey of approaches to improve reliability in LCA. Int J Life Cycle Assess 7(2):64–72
CML (2014) CMLCA. Available at:www.cmlca.eu
Cruze NB, Goel PK, Bakshi BR (2014) Allocation in life cycle inventory: partial set of solutions to an ill-posed problem. Int J Life Cycle Assess 19(11):1854–1865
Groen E, Heijungs R, Bokkers EAM, de Boer IJM (2014) Methods for uncertainty propagation in life cycle assessment. Environ Model Softw 62:316–325
Guinée J, Heijungs R (2007) Calculating the influence of alternative allocation scenarios in fossil fuel chains. Int J Life Cycle Assess 12(3):173–180
Guinée J, Heijungs R, Huppes G (2004) Economic allocation: examples and derived decision tree. Int J Life Cycle Assess 9(1):23–33 Hanes RJ, Cruze NB, Goel PK, Bakshi BR (2015) Allocation games:
addressing the ill-posed nature of allocation in life-cycle inventories. Environ Sci Technol 49(13):7996–8003
Heijungs R, Guinée J (2007) Allocation andBwhat-if^scenarios in life cycle assessment of waste management systems. Waste Manag 27(8):997–1005
Heijungs R, Huijbregts MAJ (2004) A review of approaches to treat uncertainty in LCA. iEMSs 2004 International Congress. Available at:http://www.iemss.org/iemss2004/pdf/lca/heijarev.pdf [Accessed April 15, 2014].
Heijungs R, Lenzen M (2014) Error propagation methods for LCA—a comparison. Int J Life Cycle Assess 19(7):1445–1461
Heijungs R, Suh S (2002) The computational structure of life cycle as-sessment. Int J Life Cycle Assess 7(5):314–314
Henriksson PGJ et al (2013) A protocol for horizontal averaging of unit process data—including estimates for uncertainty. Int J Life Cycle Assess 19(2):429–436
Henriksson PJG et al (2015) Product carbon footprints and their uncer-tainties in comparative decision contexts. PLoS ONE 10(3): e0121221
Hong J, Shaked S, Rosenbaum RK, Jolliet O (2010) Analytical uncer-tainty propagation in life cycle inventory and impact assessment: application to an automobile front panel. Int J Life Cycle Assess 15(5):499–510
Huijbregts MAJ (1998) Application of uncertainty and variability in LCA part II: dealing with parameter uncertainty and uncertainty due to
choices in life cycle assessment. Int J Life Cycle Assess 3(1):343– 351
Imbeault-Tétreault H et al (2013) Analytical propagation of uncertainty in life cycle assessment using matrix formulation. J Ind Ecol 17(4): 485–492
ISO (2006) Environmental management—Life cycle assessment— Requirements and guidelines. Environ Manag 3(1):54
Jung J, Assen N, Bardow A (2013) Sensitivity coefficient-based uncer-tainty analysis for multi-functionality in LCA. Int J Life Cycle Assess 19(3):661–676
Luo L, Van der Voet E, Huppes G, Udo de Haes H (2009) Allocation issues in LCA methodology: a case study of corn stover-based fuel ethanol. Int J Life Cycle Asses 14(6):529–539
Marvuglia A, Cellura M, Heijungs R (2010) Toward a solution of alloca-tion in life cycle inventories: the use of least-squares techniques. Int J Life Cycle Assess 15(9):1020–1040
Pelletier N, Ardente F, Brandão M, De Camillis C, Pennington D (2014) Rationales for and limitations of preferred solutions for multi-functionality problems in LCA: is increased consistency possible? Int J Life Cycle Assess 20(1):74–86
Svanes E, Vold M, Hanssen OJ (2011) Effect of different allocation methods on LCA results of products from wild-caught fish and on the use of such results. Int J Life Cycle Assess 16(6):512–521 Swiss Centre For Life Cycle Inventories (2004) ecoinvent database V1.1.
Available at:www.ecoinvent.ch
Swiss Centre For Life Cycle Inventories (2007) ecoinvent database v2.2. Available at:http://www.ecoinvent.org/database/
Tillman AM et al (1994) Choice of system boundaries in life cycle as-sessment. J Clean Prod 2(1):21–29
van der Harst E, Potting J (2014) Variation in LCA results for disposable polystyrene beverage cups due to multiple data sets and modelling choices. Environ Model Softw 51:123–135
Van der Voet E, van Oers L, Davis C, Nelis R, Cok B, Heijungs R, Chappin E (2008) Greenhouse gas calculator for electricity and heat from biomass, CML - Leiden University
van der Voet E, Lifset RJ, Luo L (2010) Life-cycle assessment of biofuels, convergence and divergence. Biofuels 1(3):435–449
Wardenaar T, Ruijven T, Mendoza Beltran A, Vad K, Guinée J, Heijungs R (2012) Differences between LCA for analysis and LCA for policy: a case study on the consequences of allocation choices in bio-energy policies. Int J Life Cycle Assess 17(8):1059–1067
Weidema BP (2000) Avoiding co-product allocation in life-cycle assess-ment. J Ind Ecol 4(3):11–33
Weidema BP (2014) Has ISO 14040/44 failed its role as a standard for life cycle assessment? J Ind Ecol 18(3):324–326