IMPACT OF AUTOMATIC REPORTING OF ESTIMATED GLOMERULAR FILTRATION ON CHRONIC KIDNEY DISEASE DETECTION AND PATIENT CARE IN A HOSPITAL SETTING
Monique Ahinee Amamoo
A dissertation submitted to the faculty of the University of North Carolina at Chapel Hill in partial fulfillment of the degree of Doctor of Philosophy in the Department of Epidemiology in
the Gillings School of Global Public Health.
Chapel Hill 2013
Approved by: Gerardo Heiss Alan Brookhart Maria Ferris
ii © 2013
iii
ABSTRACT
Monique Ahinee Amamoo: Impact of Automatic Reporting of Estimated Glomerular Filtration on Chronic Kidney Disease Detection and Patient Care in a Hospital Setting
(Under the direction of Gerardo Heiss)
BACKGROUND AND OBJECTIVES
In an attempt to address rising concerns about low and delayed detection of chronic kidney disease (CKD) several healthcare organizations and clinical laboratories developed initiatives to automatically report estimated glomerular filtration rates (eGFR) in response to the National Kidney Foundation-Kidney Disease Outcome Quality Initiative (KDOQI) clinical recommendations. In April 2005 the University of North Carolina at Chapel Hill Healthcare System (UNCHS), introduced an eGFR reporting initiative to facilitate monitoring of CKD in its patient population. This initiative automatically reports eGFR levels calculated using the Modification of Diet in Renal Disease (MDRD) equation on all serum creatinine tests ordered for adults 18 and older. This doctoral dissertation examined the impact of the UNCHS eGFR reporting initiative on CKD detection and nephrology appointments.
DESIGN, SETTING, PARTICIPANTS, & MEASUREMENTS
iv
of CKD detection and nephrology appointments were compared for the 15 months prior, and the 48 months following the introduction of the initiative to automatically report eGFR.
RESULTS
An increase of 9% in the overall detection of CKD within the UNC healthcare system was observed following the introduction of the eGFR reporting initiative. Those with moderate CKD, older age, male gender, white race and CKD risk factors had higher
detection rates during the period following the introduction of the eGFR reporting initiative, but no detectable differences in scheduled nephrology appointments were observed following the UNCHS eGFR reporting initiative. Those with diagnoses of hypertension, diabetes and cardiovascular disease had lower odds of having a nephrology appointment scheduled, irrespective of eGFR reporting period.
CONCLUSIONS
v
I dedicate this dissertation research to the memory of Big Mama, Mama Grace, Granddaddy Charles, Granddaddy James, Auntie Ahinee and Peepaw
To Micah Mawuena Mortey, Mykelti, and my nieces and nephews, know that all things are possible through Jesus Christ who gives you strength and as long as you place God first
in all you do, you will be successful.
To my husband-- Kingsley Kormla Elikem Mortey—thank you for continuing to encourage me when I could not encourage myself.
vi
ACKNOWLEDGEMENTS
To El Shaddai, God Almighty, thank You for being Jevoah Jireh, my provider. I stand on this victory because of You and the angels You have sent my way along this process. I give You honor, glory and praise for Your provision, protection, guidance and strength through this process.
To the members of my dissertation committee, thank you for your guidance and
contributions. I give special thanks to Dr. Gerardo Heiss, my committee chairperson, for his encouragement and substantial contributions to this dissertation research. Thank you for encouraging me to be an independent scientist throughout this process. I am grateful for your patience and compassion towards me. You constantly kept me focused not only on my school aspirations, but on the importance of maintaining mental and physical health. For this I am grateful.
vii
I am also thankful for the support provided by the Ruth L. Kirschstein, National Research Service Award, The Renal Epidemiology Training Program, Grant # 5-T32-DK007750, PI: RJ Falk, NIDDK, NIH and the UNC Kidney Center. Thank you, Dr. Falk for allowing me to have the unique opportunity to be a Pre-doctoral Renal Epidemiology fellow. This opportunity has truly served as a catalyst for my Renal epidemiology career and for that I am eternally grateful. To Dr. Susan L. Hogan, words can never express how grateful I am towards you. Thank you for believing in me and affording me such an invaluable opportunity. You truly are a rare jewel and any student that has an opportunity to work with you is truly fortunate. Thank you for all you do for the students, the UNC Kidney center family and those whose lives are impacted by kidney disease. We are truly blessed to have you in our lives. May you and “My Roomie” enjoy a long, happy, and fulfilling life.
Thank you to the staff at the UNC Kidney Center, Southeastern Kidney Council, Department of Epidemiology, Department of Biostatistics, and ECHO (Ethnicity, Culture and Health Outcomes) for supporting and encouraging me during this process. To my SPH family: Veronica, Melissa, Vera, Mary, Chandra and Lisa, thank you for always being a sounding board for me and an encourager. To my mentors, Drs. Vijaya Hogan and Anissa Vines, thank you for being my role models and helping me realize the strength I have within.
viii
Bettina, Karen, Nikki, Victoria, Mary, Cicely, the rest of the S.O.S. crew , S.E.S. ,Sister circle, my sorority sisters, and my First Calvary Baptist Church family, I can do nothing but thank you all for your many prayers, laughs and listening ears. May God bless you. To E-Phi, Eboni, Joseph, Michelle, and Keisha, who knew our long study nights on Fairmont street and days in HSL would leave us connected for life. I love you and could not have done it without you. To many other unnamed friends, family members, and special people who have prayed for me, called me, encouraged me or paved the way for me, thank you.
Lastly to my husband, Kingsley Kormla Elikem and my beautiful gift from God, Micah Mawuena, thank you from the bottom of my heart. I love you both with all my heart and praise God for you. Your love, support, encouragement, and prayers truly helped me cross the finish line. Thank you! The Best is Yet to Come!! UAAIEPF!
“Now all glory to God, who is able, through his mighty power at work within us, to
ix
TABLE OF CONTENTS
LIST OF TABLES ... xii
LIST OF FIGURES ... xiii
LIST OF ABBREVIATIONS ... xiv
CHAPTER ONE: BACKGROUND AND SIGNIFICANCE ... 1
The Epidemiology of Chronic Kidney Disease ... 1
Burden of Chronic Kidney Disease ... 2
Detection and Treatment of Chronic Kidney Disease ... 3
Clinical Practices to Detect Chronic Kidney Disease ... 3
Early Detection and Intervention Can Reduce Burden of Disease ... 5
CHAPTER TWO: SPECIFIC AIMS AND RATIONALE ... 8
Specific Aim 1: Impact of eGFR reporting on CKD detection among at-risk population ... 10
Specific Aim 2: Impact of eGFR reporting on adherence to National Kidney Foundation CKD guidelines ... 10
Specific Aim 3: Impact of eGFR reporting on the clinical diagnosis of CKD given two eGFR measurements <60ml/min./1.73m2. ... 11
Specific Aim 4: Impact of eGFR reporting on referrals to nephrology ... 11
CHAPTER THREE: RESEARCH PLAN AND METHODS ... 13
x
Study Setting ... 13
Study Population ... 14
Data Source ... 15
Data Acquisition and Creation ... 16
Study Variables ... 18
Laboratory Verified Chronic Kidney Disease (Aim 1) ... 18
Assessment of CKD detection (Aim1) ... 18
Assessment of scheduled nephrology appointment (Aim4) ... 19
Changes in CKD Function (Aim 4) ... 20
Exposure: Timing of Healthcare Visit ... 20
Additional variables ... 21
CHAPTER FOUR: PAPER 1- Automatic eGFR Reporting and Detection of Chronic Kidney Disease ... 23
Background ... 23
Methods ... 24
Results ... 27
Discussion ... 30
CHAPTER FIVE: Impact of Automatic Estimated Glomerular Filtration Reporting on Scheduled Nephrology Appointments and Kidney Function in a Tertiary Medical Institution ... 41
Introduction ... 41
Methods ... 43
Results ... 47
xi
CHAPTER SIX: DISCUSSION ... 62
Study Rationale ... 62
Specific Aims ... 63
Summary of Findings ... 64
Strengths and Limitations ... 66
Public Health Impact ... 69
Future Directions ... 70
APPENDIX 1: DESCRIPTION OF NCTRACS DATA SOURCE GUIDE ... 72
APPENDIX 2: CLINICAL AND PROVIDER DATA SOURCE SUMMARY ... 76
xii
LIST OF TABLES
Table 1- Stages of Chronic Kidney Disease ... 4
Table 2- Diagnosis Codes used for the Definition of Chronic Kidney Disease Documentation ... 19
Table 3-Characteristics Of Lab-Verified CKD Patients (2004-2010) At the UNCHS (Overall and by eGFR Reporting Period) ... 35
Table 4- Association Between eGFR Reporting Period and CKD Detection... 37
Table 5-Period Analysis: Stratified estimates of CKD Detection (Overall and according to eGFR reporting) Summary of Cumulative Incidence of Detection Ratio (95%CI) by Period ... 38
Table 6- Factors Associated With CKD Detection Before And After eGFR Reporting Period (Crude) ... 40
Table 7-Characteristics of UNC Healthcare System Patients* with One Low estimated Glomerular Filtration (eGFR) Lab Value (Overall and by Scheduled Nephrology Appointment status)... 56
Table 8-Characteristics of UNC Healthcare System Patients* with One Low estimated Glomerular Filtration (eGFR) Lab Value by Scheduled Nephrology Appointment status and eGFR Reporting Period... 57
Table 9- Factors Associated with a Scheduled Nephrology Visit by eGFR reporting Period ... 59
Table 10- One year Within Patient Changes in eGFR Levels by Scheduled Nephrology Appointment Status ... 60
xiii
LIST OF FIGURES
Figure 1: Study Exclusion Criteria ... 15
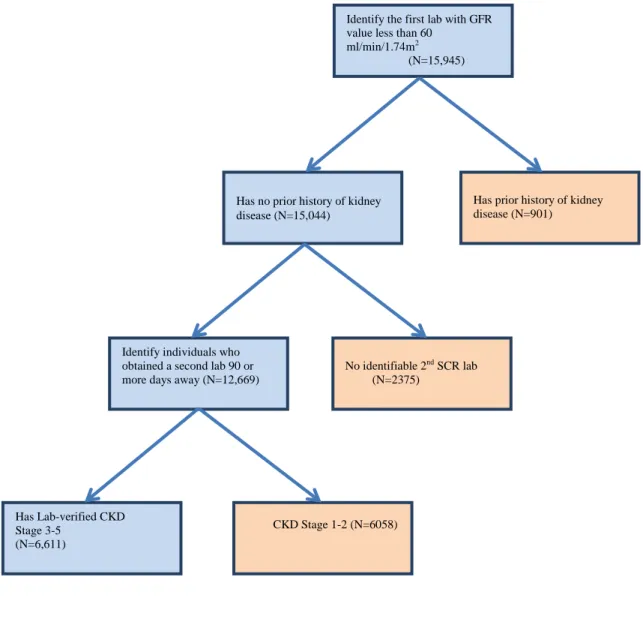
Figure 2 Study Population Exclusion/ Inclusion Flow Chart ... 34
Figure 3- Period Analysis: Stratified estimates of Relative Risk of CKD Detection ... 39
xiv
LIST OF ABBREVIATIONS
CDW-H- Clinical Data Warehouse CI- Confidence Interval
CIR- Cumulative Incidence of Detection rate CKD- Chronic Kidney Disease
CVD- Cardiovascular Disease
eGFR- Estimated Glomerular Filtration Rate EHR- Electronic Health Record
ESKD- End-Stage Kidney Disease GFR- Glomerular Filtration Rate
ICD-9- CM International Classification of Diseases (version 9)- Clinical Modification ICD-9 International Classification of Diseases (version 9)
KDOQI- Kidney Disease Outcomes Quality Initiative MDRD- Modification of Diet in Renal Disease
NCTRaCS- North Carolina Translational Science Institute NHANES- National Health and Nutrition Examination Survey NIH- National Institutes of Health
NKF- National Kidney Foundation
NKF-KDOQI- National Kidney Foundation- Kidney Disease Outcomes Quality Initiative OR- Odds ratio
xv
UNC P&A- University of North Carolina at Chapel Hill Physicians and Associates UNC- University of North Carolina at Chapel Hill
1
CHAPTER ONE: BACKGROUND AND SIGNIFICANCE
The Epidemiology of Chronic Kidney Disease
Chronic Kidney Disease (CKD) is an escalating public health issue affecting one in
ten Americans with another 20 million at risk. In 2007, approximately 26.3 million Americans were living with CKD (Stages 1-4), representing 13.1 % of the US non-institutionalized adult population.[1]
The Burden of CKD is progressively increasing. The prevalence of CKD has increased from 10.1% in 1988-1994 to 14.0% in 2005-2010.[1, 2] The number of individuals with Stage 5 CKD also referred to as end-stage kidney disease (ESKD), has increased
dramatically from 14,500 in 1978 to 527,283 in 2007 and 593,086 in 2010.[2-4]
CKD has been associated with demographic factors. Age is associated with an increased prevalence of CKD.[5-9] Among participants in the National Health and Nutrition Examination Survey (NHANES) (2005-2010), the prevalence of CKD increased with age and was highest among those 60 years and older (35.0%)[2]. CKD prevalence is also higher among women compared with men (15.8% vs. 12.1%) and African Americans compared with Whites (16.0% vs. 14.3%) [2, 6, 8-13] In NHANES 1999-2000, the prevalence of CKD was 26% higher among women compared to men and varied by race-ethnicity for Whites (4.2%),
2
Low socio-economic status (SES) and life-course SES are also associated with
CKD.[14-19] Less than a high school education was associated with an increased odds of CKD for both African-Americans and Whites compared with those with a college degree in the Atherosclerosis Risk in Communities Study (OR=1.6, 95% CI (1.1, 2.5) for African-Americans; OR=1.75, 95% CI (1.2, 2.5) for Whites)[18]. An investigation of life -course socioeconomic status revealed, the odds of CKD among middle-aged participants who reported working when 30 years old were higher than those participants who reported being unemployed when they were 30 years old (OR=1.4; 95% CI (1.0, 2.0) for Whites; OR=1.9, 95% CI (1.2, 3.0) for African-Americans)[18].
Burden of Chronic Kidney Disease
CKD causes premature morbidity and mortality. CKD is associated with 2-3 fold increase in the risk of all-cause mortality.[8] Patients with CKD are at increased risk for complications from infections, strokes, and premature cardiovascular diseases.[3, 8] Additionally, those with CKD are hospitalized at higher rates than those without CKD, even after adjusting for prior hospitalizations, comorbidities and sex.[3]
Kidney disease has a substantial impact on the health care system. CKD patients, compared to -age-matched patients without CKD, experience more health care costs, physician visits, prescriptions, and are twice as likely to be hospitalized.[20] The costs of delivering care to ESKD patients in 1999 was estimated at 17.9 billion dollars, 13% higher than the total
3
budget[2]. Healthcare costs associated with CKD and ESKD are increasing. In 2006 the healthcare costs for CKD patients with Medicare were $49 billion, nearly 5 times the costs of care in 1993. Similarly, the healthcare cost for those with an Employer Health Group Plan in 2006 was 11 times greater, at $1.2 billion, than the costs in 2000 [22].
Detection and Treatment of Chronic Kidney Disease
CKD is asymptomatic, and when left untreated can progress to complete kidney
failure or end-stage kidney disease (ESKD). ESKD is a chronic disease for which the only treatments are dialysis and transplantation. The incidence of ESKD has doubled every year since 1980, and an estimated 385,200 people in the U.S. currently live with ESKD. By 2030, the estimated number of new cases of ESKD will exceed 450,000, and over 2 million people will be on dialysis [23]. CKD and ESKD lower patient quality of life, cause premature morbidity and mortality, and cause economic burden on individuals, health care systems and society.[20] However, if chronic kidney disease is detected early, treatments can be successful in slowing the progression to kidney failure.[24-27]
Clinical Practices to Detect Chronic Kidney Disease
For years clinical practices used serum creatinine (SCr) levels as a surrogate marker for kidney filtration because of the ease and cost effectiveness of this measurement. Due to the limitations of SCr to adequately measure kidney function, estimating glomerular filtration rate (eGFR) equations were developed. National Kidney Foundation (NKF) clinical
4
GFR=186* [SCr]-1.154 *[Age]-0.203 *[0.742 if female]*[1.212 if black].
Physicians manually estimate kidney function using the MDRD equation and use the current established National Kidney Foundation- Kidney Disease Outcomes Quality Initiative (NKF-KDOQI) workgroup clinical guidelines[28] for defining the stages of CKD.
Table 1- Stages of Chronic Kidney Disease
Stage Description GFR
(mL/min/1.73m2)
1 Kidney damage* with normal or GFR ≥90
2 Kidney damage* with normal or GFR 60-89
3 Moderate GFR 30-59
4 Severe GFR 15-29
5 Kidney failure <15 (or dialysis)
*Kidney damage is defined as any structural or functional abnormalities of the kidney detected by pathological abnormalities or by the presence of sediments, blood, or proteinuria in the urine[30].
Automatic eGFR reporting facilitates earlier detection. In 1999, The National Kidney Foundation- Kidney Disease Outcome Quality Initiative (KDOQI) developed guidelines to identify and manage kidney disease at earlier stages.[28] The KDOQI guidelines recommended that all laboratories automatically report eGFR, calculated using the MDRD equation, whenever serum creatinine (SCr) is measured. The implementation of this automatic reporting eliminates the need for physicians to manually determine eGFR and helps facilitate the early detection of CKD.
5
policies requiring automatic eGFR reporting. Many international and US-based healthcare organizations and laboratories implemented policies that would automatically report eGFR when SCr is measured [31-35]. Although the utility and role of automatic eGFR reporting remains unsettled, studies have shown that eGFR reporting resulted in increased CKD detection, referrals, consults, and first time visits to nephrology clinics [34, 36-40].
Based upon recommendations from the North Carolina Institute of Medicine Task Force on Chronic Kidney Disease[41], the University of North Carolina at Chapel Hill Healthcare system (UNCHS), voluntarily implemented automatic eGFR reporting in April 2005. UNCHS implemented a system-wide CKD initiative to automatically report eGFR (based on the MDRD equation), on all SCr tests ordered on adults 18 years or older. Along with this voluntary
mandate, the UNCHS collaborated with the UNC Kidney Center to develop education programs for health professionals and the general population, to increase CKD awareness among
healthcare providers and improve detection.
Early Detection and Intervention Can Reduce Burden of Disease
Patients referred earlier to nephrologists have fewer CKD complications and lower mortality rates, than those who are referred late.[42] The 5-year survival rate for ESKD is 2 times as high for those who are referred to nephrologists early, at least 6 months prior to dialysis, compared to those referred late, (less than 6 months prior to dialysis), 72.4% vs. 35.2%,
6
treatments can be successful in slowing the progression to kidney failure and facilitating the optimal management of co-morbid conditions.[24-27]
Despite knowledge that early detection is the key to slowing the progression of kidney disease, many patients are getting delayed referrals to nephrologists. Studies have documented primary care physician referrals to nephrologists range from 15 to 83%.[46] Late referrals to nephrologists have resulted in higher hospitalization rates, late initiation of dialysis, higher mortality rates, increased incidence of anemia, bone disease and other CKD complications [47-50]. Approximately 20-35% of those starting dialysis are due to late referrals. However, if patients are referred earlier to nephrologists CKD complications and mortality rates can be reduced.[42]
Screening for CKD is necessary for identifying early CKD patients and ensuring
timely referral to nephrologists. In 1999, The National Kidney Foundation- Kidney Disease Outcome Quality Initiative (KDOQI) developed guidelines to identify and manage kidney disease. The KDOQI guidelines recommend that all physicians assess clinical and socio demographic factors associated with kidney disease such as family history of kidney disease, older age, smoking, low birth weight, hypertension or diabetes during each patient’s health care
7
8
CHAPTER TWO: SPECIFIC AIMS AND RATIONALE
Chronic kidney disease (CKD) is a growing public health concern affecting more than 26 million Americans [10]. CKD is often asymptomatic and, if untreated, may progress to end-stage kidney disease (ESKD) requiring dialysis therapy and organ transplantation. Early diagnosis and management of kidney disease can delay or prevent the development of ESKD and minimize CKD mortality, through the management and treatment of complications associated with CKD such as, cardiovascular disease, hypertension, anemia, decreased quality of life and metabolic bone disease. [42, 48, 50]
9
The implementation of automatic eGFR reporting elicited debate among health
professionals about its utility and role in the early detection and management of CKD. One view maintains that automatic eGFR reporting will provide kidney function assessments directly to physicians who previously had to calculate eGFR by hand using estimating equations. This simplification of the reporting of eGFR may lead to an increased awareness of CKD among physicians and other health professionals and earlier identification of patients for the initiation of treatment of CKD. An opposing view argues that automatic eGFR reporting will be used as a population-level screening program for CKD, which could result in increased diagnoses of CKD, for patients who may never progress to ESKD. However, there is no scientific evidence to adequately identify CKD patients that will progress to ESKD, and the therapeutic interventions available to slow the progression from CKD to ESKD must be implemented during the early disease stages.
Although the utility and role of automatic eGFR reporting remains unsettled, studies in international populations have shown that eGFR reporting have resulted in increased CKD detection, referrals, consults, and first time visits to nephrology clinics.[36-40] However, the impact of automatic eGFR reporting policies on CKD awareness, detection, and treatment warrant further investigation in US populations. In April 2005, the University of North Carolina Healthcare System (UNCHS) voluntarily implemented a system-wide CKD
10
We sought to evaluate the impact of automatic eGFR reporting within UNCHS on the identification of CKD patients and nephrology referrals within the UNC Nephrology clinics between the years 2004-2010. The aims to address the study focus are detailed below.
Specific Aim 1: Impact of eGFR reporting on CKD detection among at-risk population
To quantify the detection of CKD detection prior to and following the implementation of automatic eGFR reporting among adults patients who had at least one SCr measurement with
an eGFR measurement below 60ml/min/1.73m2 seen in the UNC Healthcare System (UNCHS)
between January 2004 and December 2010.
Hypothesis: CKD detection will increase by at least 10% from before to after the implementation of automatic eGFR reporting in April 2005.
Rationale: To determine if eGFR reporting helps increase the detection of CKD among adults at-risk for CKD detection in the UNC Healthcare System (UNCHS).
Specific Aim 2: Impact of eGFR reporting on adherence to National Kidney Foundation CKD guidelines
To quantify the proportion of adults who had a second SCr measurement after an initial
eGFR <60 ml/min/1.73m2 before and after the implementation of automatic eGFR reporting
seen in the UNC Healthcare System (UNCHS) between January 2004 and December 2009,
11
Rationale: To quantify the proportion of adherence to CKD guidelines among the sub-population of at-risk CKD patients.
Specific Aim 3: Impact of eGFR reporting on the clinical diagnosis of CKD given two eGFR measurements <60ml/min./1.73m2.
To quantify the detection of clinically identified CKD before and after the implementation of automatic eGFR reporting among adult patients with lab-verified moderate to severe CKD (i.e. two eGFR measurements below 60ml/min/1.73m2) seen in the UNC Healthcare System (UNCHS) between January 2004 and August 2009.
Hypothesis for Aim 3: Diagnostic labeling of CKD in patients with two eGFR measurements below (60ml/min./1.73m2) will increase by at least 10% from before to after the implementation of automatic eGFR reporting in April 2005.
Rationale: To quantify CKD detection among adults with lab-verified CKD in the UNC Healthcare System (UNCHS).
Specific Aim 4: Impact of eGFR reporting on referrals to nephrology
To examine the proportion of nephrology referrals to UNC Nephrology clinics for adult patients with stage 3 CKD or higher before and after the implementation of automatic eGFR reporting in the UNCHS
12
13
CHAPTER THREE: RESEARCH PLAN AND METHODS
Study Design Overview
To examine how automatic eGFR reporting in hospitals and clinical practices impact CKD detection and care management, we conducted a data analysis of administrative claims data and electronic medical records from the University of North Carolina Hospital System (UNCHS).
Study Setting
14
Study Population
15
Figure 1: Study Exclusion Criteria
Data Source
16
Laboratories. This system coordinates and integrates all UNHS Clinical Laboratory and Anatomic Pathology services including serum creatinine labs. The patient’s International
Classification of Diseases (version 9) (ICD-9) diagnoses came from Trendstar, a McKesson Information System accounting system, used in the UNCHS to coordinate billing and insurance claims for all patients. Information about scheduled nephrology appointments were obtained from the UNCHS Appointment scheduling system and diagnosis information for the study were obtained from UNC P&A data files. UNC P&A is the billing department for UNC faculty practice within the Healthcare system.
Data Acquisition and Creation
Project data was abstracted by the North Carolina Translational Science Institute (NCTRaCS), Clinical Data Warehouse for Health (CDW-H). CDW-H is a biomedical informatics resource that manages and mines all UNC Hospital clinical and research data,
ranging from billing and insurance to diagnosis and medication information. It was established in 2008 to enhance the quality of care and clinical research with the UNCHS patient population. CDW-H contains data from clinical and operations systems within UNCHS, primarily from WEBCIS. After CDW-H project requests was submitted to the governance committee and approved the requested research data was made available to the study investigators.
17
patient ids were sent back to NCTRaCS to obtain patient characteristics, lab results, provider information, and health status/ co morbidities. Nephrology appointment data was obtained from UNC P&A appointment scheduling system, to identify whether or not patients were scheduled an appointment after a low eGFR value. The data files sent to obtain study data are listed below. Additional description of the excel files that were sent are described in detail in Appendix 1.
DX (Contained all diagnosis identified for patients in UNCHS)
Postal Code (Contained information on the billing addresses for patients.)
Demog (Contained the race, date of birth, gender of patients in UNCHS)
Lab (Contained that laboratory results for the GFR labs)
Outpatientvisits (identified the clinic the patient was seen in during the UNCHS
visit)
Payor (Identified the billing payor for the UNCHS visit)
Problems (identified patient’s comorbidities listed in the medical record)
Visits (identified the inpatient admission information for the corresponding
UNCHS visit)
NephAppts (identified the scheduled nephrology appointments for the
corresponding UNCHS visit)
NephVisits (Contained hospital billing data for Nephrology clinic visits earlier
than 12/31/2010)
NephVisitInsurers (Contained patients' insurance data for Nephrology clinic
18
After the acquisition of the data files from NCTRACS, each excel data file was converted to a SAS data file. The files were combined using the unique identifiers that connect each data set. The identifiers used for each data set are disclosed in Appendix Table 1.
Study Variables
Laboratory Verified Chronic Kidney Disease (Aim 1)
Prior to the automatic reporting of eGFR in 2005, GFR was calculated manually using the abbreviated Modification of Diet in Renal Disease (MDRD) equation.[29] This study calculated GFR for those patients seen prior to the implementation of the automatic reporting, before April 2005. For those patients with clinic visits after April 2005, eGFR was abstracted from WebCIS as automatically reported patient their lab results. Individuals with two eGFR measures below 60mL/min/ 1.73m2 were classified as having laboratory verified CKD. Individuals for whom one or both of the eGFR values were above 60mL/min/ 1.73m2 were classified as having normal kidney function.
Assessment of CKD detection (Aim1)
For patients identified as having laboratory verified CKD, the medical record
19
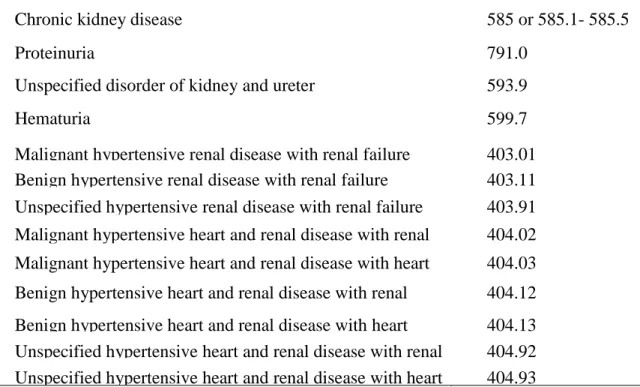
Table 2- Diagnosis Codes used for the Definition of Chronic Kidney Disease Documentation
Diagnosis
ICD-9CM codes
Chronic kidney disease 585 or 585.1- 585.5
Proteinuria 791.0
Unspecified disorder of kidney and ureter 593.9
Hematuria 599.7
Malignant hypertensive renal disease with renal failure 403.01 Benign hypertensive renal disease with renal failure 403.11 Unspecified hypertensive renal disease with renal failure 403.91 Malignant hypertensive heart and renal disease with renal
failure
404.02 Malignant hypertensive heart and renal disease with heart
failure and renal failure
404.03 Benign hypertensive heart and renal disease with renal
failure
404.12 Benign hypertensive heart and renal disease with heart
failure and renal failure
404.13 Unspecified hypertensive heart and renal disease with renal
failure
404.92 Unspecified hypertensive heart and renal disease with heart
failure and renal failure
404.93
Assessment of scheduled nephrology appointment (Aim4)
Patients must be referred by a physician in order to be seen by a nephrologist. However, due to the limited capabilities of the medical records, referrals to nephrologist outside of the UNCHS are not consistently captured. For the purposes of this study the information regarding referrals will only apply to those nephrologists in the UNCHS and defined as having a scheduled nephrology appointment. The appointment scheduling system was queried to determine if patients had any nephrology appointments scheduled after the flagged low eGFR. If an
20
Changes in CKD Function (Aim 4)
For those with a scheduled nephrology appointment laboratory records were searched to identify follow-up SCr measurements during the 12 months following the initial nephrology visit. Laboratory records were also searched for SCr measurements over 12 months following the initial laboratory value for patients who did not have a scheduled nephrology visit. Change in CKD function was based upon these subsequent lab values and categorized as No Change, Increase in Stage (deterioration of kidney function) and Decrease in Stage (improvement of kidney function). No change was defined as those who had no change in their subsequent GFR level compared to the initial lab; an increase in staging was defined by the decrease in GFR levels in the subsequent lab when compared to the initial lab. For example a reduction in GFR from 15-29mL/min/1.73m2 to <15mL/min/1.73m2 would be categorized as an increase in stage. Lastly, a decrease in stage is when the subsequent GFR level is higher than the initial GFR lab value. For example an individual whose initial lab value is 15-29mL.min/1.73m2 but has a subsequent lab value one year later that increases to 30-59 mL/min/1.73m2, they would be categorized as decrease in stage.
Exposure: Timing of Healthcare Visit
The exposure of interest was the timing of the healthcare visit, determined by whether or not the patient was seen in the UNCHS before or after the implementation of the automatic eGFR reporting. If the service date of the patient’s UNC Hospital visit was between the dates
January 1,2004 and April 30, 2005, inclusive, then the patient was seen prior to the
21
patients were considered exposed if they were seen at UNCHS between the dates May 1, 2005 and December 31, 2010, after the implementation of the automatic eGFR reporting.
Additional variables
This study also examined patient demographics, health status/co-morbidities, and provider information. These covariates were abstracted from the medical records and
accounting system data. See Appendix 2 for description of each study covariate, data source, variable type, and categorization, if applicable. Patient’s family history of kidney disease and
socioeconomic status were not captured in the medical record and were not being examined in this study.
Data Analysis
22
23
CHAPTER FOUR: PAPER 1- AUTOMATIC EGFR REPORTING AND DETECTION OF CHRONIC KIDNEY DISEASE
Background
Persistent kidney dysfunction, known as CKD, is an ever growing issue plaguing society. CKD prevalence has increased 30%, from 10.1% in 1988-1994 to 13.1% in 1999-2004 [1]. While accurate estimates of CKD stages 1-4 are not available, the incidence of Stage 5 CKD, or end-stage kidney disease (ESKD), increased from 86.2 per million population in 1980 to 350.8 per million population in 2008. The care of ESKD patients consumes roughly 6% of the US Medicare budget [54]. CKD and ESKD lower a patient’s quality of life and causes economic burden on individuals, health care systems and society[20]. However, with early detection and treatment of CKD can be successful in slowing the onset and progression to ESKD [3, 8, 24-27].
24
Many international and US-based healthcare organizations and laboratories implemented policies that automatically report eGFR when SCr is measured [34, 61, 62], eliminating the time and effort of manual calculations. Studies of international populations have shown that
automatic eGFR reporting resulted in increased CKD detection, referrals, consults, and first time visits to nephrology clinics [36-40]. In contrast, the impact of eGFR reporting in US healthcare systems remains unclear [34, 61, 62].
On April 27, 2005 the University of North Carolina Healthcare System (UNCHS) implemented a system-wide CKD initiative to report eGFR automatically, using the MDRD equation, on all patients ≥ 18 years of age who underwent SCr measurements. Two memoranda
were distributed and dissemination sessions were held to inform all health care providers in the system of this initiative. The goal of the automatic eGFR reporting initiative was to increase reporting efficiency, facilitate the early diagnosis of CKD, and improve early medical
management to minimize CKD burden among UNCHS patients. We evaluated whether eGFR reporting improved detection and CKD awareness in a public tertiary US hospital system and determined which demographic factors and comorbid conditions were associated with CKD detection.
Methods
All inpatients and outpatients 18 to 70 years of age who received services at the UNCHS between January 2004 to August 2009, and had at least one eGFR value less than 60
25
(N=2375); and (3) eGFR > 60 mL/min/1.73m2 (N= 6058) after the 2nd SCr measurement (Figure 2).
Medical record and laboratory data were extracted from the electronic health record at the UNCHS’s Web Clinical Information System. Diagnoses and procedures coded by ICD-9 were
obtained from Trendstar, an accounting system used for billing and insurance claims. The
institutional review board of The University of North Carolina School of Medicine, as well as the UNC Hospital Governance Board for access to the UNCHS data approved this study.
Medical records were used to determine race/ethnicity and age at initial clinic visit. Comorbidities were labeled based upon the presence of at least one ICD-9 code in the medical record within one year prior to the date of the initial low eGFR measurement. The comorbidities and corresponding ICD-9 codes included: diabetes mellitus (250.x); essential hypertension (401.x, 402.x); and cardiovascular disease (CVD) (410.x-414.x, 428.x, 429.2, 430-438).
Patient’s health insurance was determined as the last known insurance identified in the medical
records and categorized as private (Blue Cross/ Blue Shield, CHAMPUS, commercial insurance carriers and HMO/PPO), public (Medicaid, Medicare A or Medicare B), or no insurance.
Patients with worker’s compensation or whose medical care was paid for by UNC were
classified as having no health insurance coverage. Ease of access to healthcare was calculated as the number of miles between the patient’s billing address and the UNC clinic location.
The eGFR reporting period was determined by the timing of the patient’s UNCHS visit
26
visit was between January 1, 2004 and April 27, 2005 inclusive, and post-initiative if the UNCHS visit was after April 27, 2005. The eGFR was manually calculated for patients seen prior to the implementation of automatic reporting (January 2004 and April 2005) using the MDRD equation[29]:
eGFR= 186*[SCr]-1154*[age] -0.203 *[0.742 if female]*[1.212 if African American] .
For patients whose clinic visits/admissions occurred after April 2005, eGFR was abstracted from the electronic health record. Individuals with two eGFR measures below 60mL/min/ 1.73m2 were classified as having laboratory verified CKD. Individuals for whom one or both of the eGFR values are above 60mL/min/ 1.73m2 were classified as not having CKD and thus excluded from this study.
The UNCHS medical records were searched for detected CKD, defined as having at least one discharge ICD-9 code of 585.x within one year of the lab date. If no indication of CKD diagnosis was identified in subsequent medical records after one year then the patient was labeled as undetected CKD. The date of the first visit with an ICD-9 code indicating CKD was considered the detection date. The one-year CKD detection rates were determined before and after eGFR reporting for the study cohort.
Statistical Analysis
27
period and CKD detection were examined using contingency tables. Linear risk regression models were used to estimate the 1 year cumulative incidence (CI) and difference (CID) of CKD detection in the study cohort pre- and post-initiative. Log-risk regression models were used to estimate the incident risk ratios (RR) and 95% Confidence Intervals (CI) pre- vs. post initiative. Effect measure modification and confounding were assessed and accounted for in final analyses.
To identify characteristics associated with CKD detection, bivariate relationships between CKD detection and each covariate were examined overall and by eGFR reporting period. Significantly associated covariates (p<0.05) were simultaneously entered into an adjusted multivariate linear risk model; univariate and adjusted cumulative incidence of detection ratios (CIR) and 95% confidence intervals were presented. All analyses were conducted using SAS software (version 9.2, SAS Institute, Cary, NC).
Results
We identified 6,611 patients with 2 low eGFR values (< 60 ml/min/1.73m2). Overall, the majority of this study’s population were identified as having eGFR levels of 30-59
28
The characteristics of the cohort of individuals seen prior to the reporting initiative are similar to those seen in UNCHS post-initiative, with some exceptions. There was a higher proportion of individuals with comorbidities post-initiative, compared to pre-initiative
(hypertension (55% vs. 35%), diabetes (28% vs. 19%) and CVD (24% vs. 13%)). While most patients had public and or private health insurance, more pre-initiative patients were missing health insurance information compared to post-initiative patients (19% vs. 0.01%, respectively) (Table 3).
Of the 6,611 patients in the study, 16.6 % (n=1096) were labeled as having detected CKD within one year of lab-verified CKD date. More were detected after the implementation of eGFR reporting (15.6% pre-initiative vs. 17.1% post-initiative). No effect measure modification or confounding was identified for detection of CKD by hypertension, diabetes, gender, race, age, CVD, insurance, or distance to UNCHS.
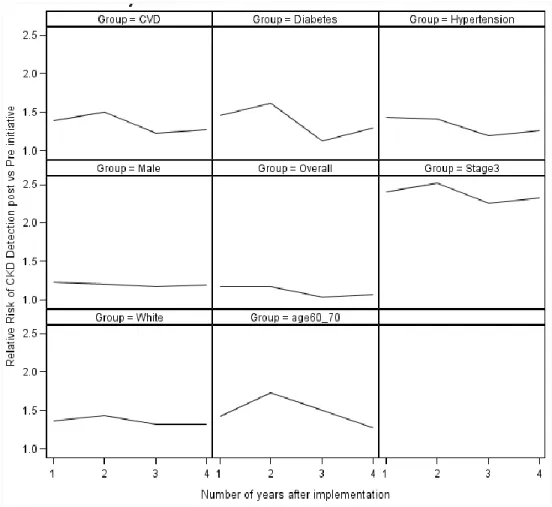
Stratified analyses were conducted to examine sub-groups that may benefit from eGFR reporting. Detection rates after the eGFR reporting initiative were found to be significantly higher than the rates before reporting initiative for those with moderate CKD (Stage III eGFR of 30-59 mL/min/1.73m2), older age, males, Whites, and those with comorbidities. Individuals with moderate CKD had a detection rate that was 131% higher post eGFR reporting than pre-initiative (CID=2.31; 95% CI: 1.89, 2.82). Detection rates were 48% higher post eGFR reporting initiative than before reporting for those age 60-70 years (CID=1.48; 95% CI: 1.195, 1.86). Males and Whites were detected at a 19% and 35% higher rate, respectively, post-initiative than pre-initiative (males CID=1.19; 95% CI: 1.01, 1.40; whites CID=1.35; 95%CI: 1.18, 1.63).
29
95% CI: 1.08, 1.59) and CVD also had a higher detection rate post-initiative than pre-initiative (Table 4).
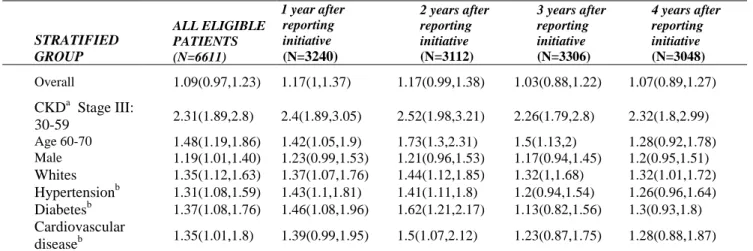
When examining the diffusion of innovation effect on CKD detection among the sub-populations that benefited from eGFR reporting, we determined that the greatest increase in CKD detection within these groups occurred during the 2nd and 3rd years after implementation (Figure 3 and Table 5). However, this increase in detection was not sustained thereafter; with a decline in the CKD detection rates for most groups back to the initial CKD detection rate pre-initiative.
Factors found to be independently associated with CKD detection pre-initiative were eGFR (<0.001), older age (<0.001), race (0.025) and sex (0.0067) (Table 6). In reference to eGFR levels, those with eGFR levels of 15-29 mL/min/1.73m2 and eGFR <15 mL/min/1.73m2 were significantly more likely to be detected than those who had an eGFR 30-59 mL/min/1.73m2 (CIR=4.27; 95% CI: 3.32, 5.48; and CIR=7.31; 95% CI: 5.87, 9.09 respectively). African
Americans were 2.23 times as likely to be detected as Whites (CIR=2.23; 95%CI: 1.82, 2.74), and females were less likely to be detected than males pre-initiative (CIR: 0.76; 95%CI: 0.62, 0.93).
30
(CIR=1.48; 95% CI: 1.30, 1.70), diabetes (CIR=1.52; 95%CI: 1.33, 1.73), and hypertension (CIR=1.22; 95% CI: 1.07, 1.40) as shown in Table 6.
Discussion
We examined the effect of automatic eGFR reporting on CKD detection rates in a Southeastern USA tertiary referral center and found that automatic eGFR reporting moderately increased the overall detection of CKD by approximately 9%. More significantly, among those with moderate CKD (Stage III, eGFR: 30-59 mL/min/1.73m2), there was an increase of 131% CKD detection after the implementation of eGFR reporting. We found that older age, male gender, white race and a history of hypertension, diabetes or CVD were associated with an increase in CKD detection after implementation of eGFR reporting when compared to pre-initiative reporting. We also identified the eGFR reporting pre-initiative had the greatest impact of CKD detection during the second year of implementation, but the increase in CKD detection was not sustained. Lastly, we found that eGFR level, age, race, and sex were independently
associated CKD detection both pre-initiative and post-initiative. We also found that having comorbidities was independently associated with post automatic eGFR reporting.
The increase in detection among those with moderate CKD indicates that eGFR reporting potentially benefits those who may have otherwise gone undetected until reaching more
31
[63]. This may indicate that health providers are aware that CKD disproportionally affects this minority group, but in contrast with other reports [26], we did not detect a sex difference.
Most studies that have examined the impact of automatic eGFR reporting have shown that implementation resulted in increased CKD detection rates. A US based Veteran Affairs study showed a 7% improvement in CKD detection; however overall CKD detection was low with only 10% of those with stage III (eGFR 30-59 min/mL/m2 ) identified [64]. A study of hospitalized elderly patients showed that there was a significant increase in CKD detection after implementation of eGFR reporting, although there was no change in physician prescribing patterns [61]. Similarly, a United Kingdom-based study reported an increase in detection after the implementation of eGFR reporting [65].
As in previous reports [9, 60, 62], we found that overall CKD detection rates were low, emphasizing the need to develop ongoing efforts to educate health professionals. Studies by Akbari et al. and Richards et al, showed that provider education and care management techniques coupled with the implementation of eGFR reporting improves the identification rate of CKD [66, 67]. Although some efforts were taken to inform providers of the implementation of automatic eGFR reporting in the UNCHS, no well-defined provider education program was established, which may have contributed to the unexpected decrease in CKD detection after eGFR reporting started.
32
damage. Automatic eGFR reporting only assesses kidney dysfunction through serum creatinine measures and not the presence of protein in a patient’s urine. Patients with kidney damage who
would meet clinical criteria for CKD were not identified in our study. ICD-9 codes are often used to identify CKD and related conditions (e.g. proteinuria and nephrotic syndrome). Use of the latter codes may capture additional patients with CKD, but would also increase
misclassification of CKD. Thus, we chose to define CKD using ICD-9 code 585 to ensure the ascertainment of CKD labeling and not that of other related kidney diseases.
A further limitation of this report is that, information was only available for the 15 months prior to the implementation of the automated eGFR reporting. The short timeframe for pre-eGFR reporting may have constrained our ability to estimate the true detection of CKD prior to automated eGFR reporting. The time available for identification of comorbidities and patient characteristics was limited to one year prior to the clinic visit date associated with the second low eGFR measurement, pre- and post- initiative, to minimize differential misclassification with respect to eGFR reporting period.
UNCHS is a referral center, and it is possible patients may have had a second low eGFR measurement assessed at a center external to UNCHS, and thereby received a diagnosis of CKD prior to UNCHS’s documentation of a second low eGFR. A sensitivity analysis was conducted to
33
among this group did not differ with respect to magnitude or direction. Thus, selection bias due to the definition of lab-verified CKD should not significantly alter these results.
Beyond the aforementioned limitations, this study has several strengths. The database includes a combination of hospital and patient level data for a large sample of individuals within a US based tertiary care hospital system. The UNCHS provides care for a racially and
economically diverse population of patients. The distribution of the overall sample population with 33% being African American and a fairly equal distribution of those with public vs. private insurance is consistent with both the general population of NC and the general demographics of the patients cared for the UNCHS.
34
Identify the first lab with GFR value less than 60
ml/min/1.74m2 (N=15,945)
Has no prior history of kidney disease (N=15,044)
Has prior history of kidney disease (N=901)
No identifiable 2nd SCR lab (N=2375)
Identify individuals who obtained a second lab 90 or more days away (N=12,669)
CKD Stage 1-2 (N=6058) Has Lab-verified CKD
Stage 3-5 (N=6,611)
35
Table 3-Characteristics Of Lab-Verified CKD Patients (2004-2010) At the UNCHS (Overall and by eGFR Reporting Period)
Characteristics Overall (N=6611) Pre-Initiative Jan2004-April 2005 (N=2119) Post-Initiative May 2005-Dec 2009 (N=4492)
N % N % N %
eGFR level† 30-59 mL/min/1.73m2 4,880 (73.8) 1,554(73.3) 3,326(74.0)
15-29 mL/min/1.73m2 755 (11.4) 307(14.5) 448(10.0)
<15 mL/min/1.73m2 976 (14.8) 258(12.2) 718(16.0)
Males 2,866 (43.4) 928(43.8) 1,938(43.1)
Females 3,745 (56.6) 1,191(56.2) 2,554(56.9)
Whites‡ 3,884 (58.8) 1,207(57.0) 2,677(59.6)
African-Americans 2,159 (32.7) 775(36.6) 1,384(30.8)
Other race 568 (8.6) 137(6.5) 431(9.6)
18-39 years of age 675 (10.2) 260(12.3) 415(9.2)
40-59 years of age 3,049 (46.1) 953(45.0) 2,096(46.7)
60-70 years of age 2,887 (43.7) 906(42.8) 1,981(44.1)
Hypertension§ 3,212 (48.6) 748(35.3) 2,464(54.9)
Diabetes§ 1,672 (25.3) 397(18.7) 1,275(28.4)
Cardiovascular disease§ 1,349 (20.4) 268(12.6) 1,081(24.1)
No Health Insurance** 552 (8.3) 130(6.1) 422(9.4)
Public Insurance 2,182 (33.0) 687(32.4) 1,495(33.3)
Private Insurance 2,373 (35.9) 659(31.1) 1,714(38.2)
Public & Private Insurance 1,026 (15.5) 240(11.3) 786(17.5)
Missing Health Insurance information 478 (7.2) 403(19.0) 75(1.7)
Miles traveled to UNC: Less than 20 miles*** 2,307 (34.9) 691(32.6) 1,616(36.0)
20-49 miles 2,048 (31.0) 617(29.1) 1,431(31.9)
50-99 miles 1,291 (19.5) 410(19.3) 881(19.6)
More than 100 miles 589 (8.9) 171(8.1) 418(9.3)
36 Characteristics
Overall (N=6611)
Pre-Initiative
Jan2004-April 2005
(N=2119)
Post-Initiative
May 2005-Dec 2009
(N=4492)
No Health Insurance** 552 (8.3) 130(6.1) 422(9.4)
Public Insurance 2,182 (33.0) 687(32.4) 1,495(33.3)
Private Insurance 2,373 (35.9) 659(31.1) 1,714(38.2)
Public & Private Insurance 1,026 (15.5) 240(11.3) 786(17.5)
Missing Health Insurance information 478 (7.2) 403(19.0) 75(1.7)
Miles traveled to UNC: Less than 20 miles*** 2,307 (34.9) 691(32.6) 1,616(36.0)
20-49 miles 2,048 (31.0) 617(29.1) 1,431(31.9)
50-99 miles 1,291 (19.5) 410(19.3) 881(19.6)
More than 100 miles 589 (8.9) 171(8.1) 418(9.3)
Missing Distance 376 (5.7) 230(10.9) 146(3.3)
*All data were derived from UNC Healthcare System data for 2004-2010. The study population included patients with lab verified CKD Stage 3 or higher during 2004-2010. Patients with unknown race, gender and age, and previous kidney disease were excluded. The eGFR reporting period wasdetermined by the timing of the patient visit relative to the implementation of the automatic eGFR reporting initiative in the UNCHS before April 2005 (Pre-); after April 2005 (Post-).
†eGFR level was determined based on the abbreviated Modification of Diet in Renal Disease (MDRD) equation.
‡ Based on the race/ethnicity reported in medical record. 'Other' race includes all patients with race/ethnicity identified as American Indian, Asian/Pacific Islander, Hawaiian, or Other race.
§ Patients with comorbidities identified in medical records (via ICD-9 codes) at least once within one year prior to clinic visit were identified classified as having Hypertension (401,402); Diabetes (250, 250.5, and 250.5); CVD (410-414,428, 429.2, 430-438)
**Health insurance coverage was determined based upon the insurance that was identified in the medical records within 60 days of the visit. Private (Blue Cross, CHAMPUS, Commercial, HMO/PPO) Public (Medicaid, Medicare A, Medicare B), No Health Coverage (Self-Pay, Workers’ Compensation). . Data are missing for patients with unknown insurance.
37
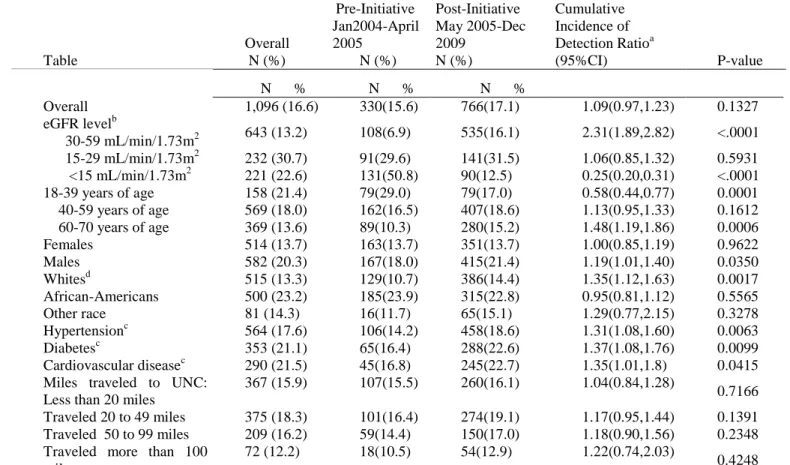
Table 4- Association Between eGFR Reporting Period and CKD Detection
Table Overall N (%) Pre-Initiative Jan2004-April 2005 N (%) Post-Initiative May 2005-Dec 2009 N (%) Cumulative Incidence of
Detection Ratioa
(95%CI) P-value
N % N % N %
Overall 1,096 (16.6) 330(15.6) 766(17.1) 1.09(0.97,1.23) 0.1327
eGFR levelb
30-59 mL/min/1.73m2 643 (13.2) 108(6.9) 535(16.1) 2.31(1.89,2.82) <.0001
15-29 mL/min/1.73m2 232 (30.7) 91(29.6) 141(31.5) 1.06(0.85,1.32) 0.5931
<15 mL/min/1.73m2 221 (22.6) 131(50.8) 90(12.5) 0.25(0.20,0.31) <.0001
18-39 years of age 158 (21.4) 79(29.0) 79(17.0) 0.58(0.44,0.77) 0.0001
40-59 years of age 569 (18.0) 162(16.5) 407(18.6) 1.13(0.95,1.33) 0.1612
60-70 years of age 369 (13.6) 89(10.3) 280(15.2) 1.48(1.19,1.86) 0.0006
Females 514 (13.7) 163(13.7) 351(13.7) 1.00(0.85,1.19) 0.9622
Males 582 (20.3) 167(18.0) 415(21.4) 1.19(1.01,1.40) 0.0350
Whitesd 515 (13.3) 129(10.7) 386(14.4) 1.35(1.12,1.63) 0.0017
African-Americans 500 (23.2) 185(23.9) 315(22.8) 0.95(0.81,1.12) 0.5565
Other race 81 (14.3) 16(11.7) 65(15.1) 1.29(0.77,2.15) 0.3278
Hypertensionc 564 (17.6) 106(14.2) 458(18.6) 1.31(1.08,1.60) 0.0063
Diabetesc 353 (21.1) 65(16.4) 288(22.6) 1.37(1.08,1.76) 0.0099
Cardiovascular diseasec 290 (21.5) 45(16.8) 245(22.7) 1.35(1.01,1.8) 0.0415
Miles traveled to UNC: Less than 20 miles
367 (15.9) 107(15.5) 260(16.1) 1.04(0.84,1.28)
0.7166
Traveled 20 to 49 miles 375 (18.3) 101(16.4) 274(19.1) 1.17(0.95,1.44) 0.1391
Traveled 50 to 99 miles 209 (16.2) 59(14.4) 150(17.0) 1.18(0.90,1.56) 0.2348
Traveled more than 100 miles
72 (12.2) 18(10.5) 54(12.9) 1.22(0.74,2.03)
0.4248
a Cumulative Incidence Risk Ratios were estimated using Log-risk regression models (Post vs. Pre initiative risks) b
CKD Stage was determined based on the abbreviated Modification of Diet in Renal Disease (MDRD) equation.
c Patients with comorbidities identified in medical records (via ICD-9 codes) at least once within one year prior to clinic visit were identified classified as having Hypertension (401,402); Diabetes (250, 250.5, and 250.5); CVD (410-414,428, 429.2, 430-438)
d Based on the race/ethnicity reported in medical record. 'Other' race includes all patients with race/ethnicity identified as American Indian, Asian/Pacific Islander, Hawaiian, or Other race.
38
Table 5-Period Analysis: Stratified estimates of CKD Detection (Overall and according to eGFR reporting) Summary of Cumulative Incidence of Detection Ratio (95%CI) by Period
STRATIFIED GROUP
ALL ELIGIBLE PATIENTS (N=6611)
1 year after reporting initiative
(N=3240)
2 years after reporting initiative
(N=3112)
3 years after reporting initiative
(N=3306)
4 years after reporting initiative
(N=3048)
Overall 1.09(0.97,1.23) 1.17(1,1.37) 1.17(0.99,1.38) 1.03(0.88,1.22) 1.07(0.89,1.27)
CKDa Stage III:
30-59 2.31(1.89,2.8) 2.4(1.89,3.05) 2.52(1.98,3.21) 2.26(1.79,2.8) 2.32(1.8,2.99)
Age 60-70 1.48(1.19,1.86) 1.42(1.05,1.9) 1.73(1.3,2.31) 1.5(1.13,2) 1.28(0.92,1.78)
Male 1.19(1.01,1.40) 1.23(0.99,1.53) 1.21(0.96,1.53) 1.17(0.94,1.45) 1.2(0.95,1.51)
Whites 1.35(1.12,1.63) 1.37(1.07,1.76) 1.44(1.12,1.85) 1.32(1,1.68) 1.32(1.01,1.72)
Hypertensionb 1.31(1.08,1.59) 1.43(1.1,1.81) 1.41(1.11,1.8) 1.2(0.94,1.54) 1.26(0.96,1.64)
Diabetesb 1.37(1.08,1.76) 1.46(1.08,1.96) 1.62(1.21,2.17) 1.13(0.82,1.56) 1.3(0.93,1.8)
Cardiovascular
diseaseb 1.35(1.01,1.8) 1.39(0.99,1.95) 1.5(1.07,2.12) 1.23(0.87,1.75) 1.28(0.88,1.87)
aCKD Stage was determined based on the abbreviated Modification of Diet in Renal Disease (MDRD) equation.
39
Figure 3- Period Analysis: Stratified estimates of Relative Risk of CKD Detection
40
Table 6- Factors Associated With CKD Detection Before And After eGFR Reporting Period (Crude)
Pre-Initiative Jan2004-April 2005
Post-Initiative May 2005-Dec 2009 Cumulative
Incidence of
Detection Ratioa
(95%CI)
p-value
Cumulative Incidence
of Detection Ratioa
(95%CI) p-value
eGFR levelb
30-59 mL/min/1.73m2
Ref.
<0.001
Ref.
0.0035
15-29 mL/min/1.73m2 4.27 (3.32, 5.48) 1.96 (1.67, 2.29)
<15 mL/min/1.73m2 7.31 (5.87, 9.09) 0.78 (0.63, 0.96)
Age
18 to 39 years
Ref.
<0.001
Ref.
0.9479
40 to 59 years 0.57 (0.45, 0.72) 1.10 (0.88, 1.37)
60 to 70 years 0.35 (0.27, 0.46) 0.90 (0.71, 1.13)
Race White Ref. 0.0025 Ref. 0.0013
African American 2.23 (1.82, 2.74) 1.58 (1.38, 1.80)
Other race 1.09 (0.67, 1.78) 1.05 (0.82, 1.33)
Gender Male
Ref. Ref.
<0.001
Female 0.76 (0.62, 0.93) 0.0067 0.64 (0.56, 0.73) <.0001
No Cardiovascular disease Ref. Ref.
Cardiovascular disease 1.09 (0.82, 1.45) 0.5541 1.48 (1.30, 1.70) <.0001
No Diabetes Ref. Ref.
Diabetes 1.06 (0.83, 1.36) 0.6249 1.52 (1.33, 1.73) <.0001
No Hypertension Ref. Ref.
Hypertension 0.87 (0.70, 1.07) 0.1908 1.22 (1.07, 1.40) 0.0027
Miles traveled to UNCHS:
Less than 20 miles Ref. 0.2867 Ref. 0.9809
20 to 49 miles 1.06 (0.82, 1.36) 1.19 (1.02, 1.39)
50 to 99 miles 0.93 (0.69, 1.25) 1.06 (0.88, 1.27)
More than 100 miles 0.68 (0.42, 1.09) 0.80 (0.61, 1.05)
Health Insurance
Private Insurance Ref. 0.0513 Ref. 0.4088
Public Insurance 1.47 (1.14, 1.89) 1.20 (1.03, 1.39)
Public and Private Insurance
1.32 (0.94, 1.87) 0.77 (0.62, 0.95)
No Insurance 1.10 (0.68, 1.77) 1.29 (1.04, 1.59)
41
CHAPTER FIVE: IMPACT OF AUTOMATIC ESTIMATED GLOMERULAR FILTRATION REPORTING ON SCHEDULED NEPHROLOGY APPOINTMENTS
AND KIDNEY FUNCTION IN A TERTIARY MEDICAL INSTITUTION
INTRODUCTION
Chronic kidney disease (CKD) affects more than one in ten Americans with an additional 20 million at risk. Approximately 13.1 % of the US non-institutionalized adult population is living with CKD.[1]. In the Medicare population, the prevalence of CKD has increased by over 200% from 1999 to 2009, 2.4% vs. 7.9%, respectively.
Once CKD is detected, treatments to delay the progression of kidney disease can be employed thereby reducing the patient morbidity and financial burden associated with end stage kidney disease (ESKD) management [24-27]. Nephrology referrals in the early disease stages also reduce the likelihood that patients will require emergency dialysis, and increase the
42
To aid in identifying and managing kidney disease earlier, the National Kidney Foundation- Kidney Disease Outcome Quality Initiative (KDOQI) developed guidelines [52] that
recommended estimated glomerular filtration rates (eGFR), based on the Modification of Diet in Renal Disease (MDRD) equation be reported concurrently with any serum creatinine (SCr) measurement. This recommendation eliminated the need for physicians to manually determine eGFR and thus help facilitate the early detection of CKD[52].
Many international and US-based healthcare organizations and laboratories implemented policies to automatically report eGFR when SCr is measured [31, 32, 37, 68, 69]. Although the utility [31, 32, 35, 38, 43, 52, 68, 70, 71] and role of automatic eGFR reporting remains
unsettled, studies have shown that automatic eGFR reporting resulted in increased CKD detection, referrals, consults, and first time visits to nephrology clinics [34, 36-40, 68].
43
Methods
Automatic eGFR reporting:
The University of North Carolina Healthcare System (UNCHS) implemented a system-wide CKD initiative to automatically report eGFR (based on the MDRD equation), on all SCr tests ordered on adults 18 years or older in April 2005. Two memos were distributed and dissemination sessions were held to inform all physicians, and health care providers in the system of the new initiative.
Study Population
Patients in the UNCHS, ages 18-70 years old, with no previous history of kidney disease and who had at least one eGFR value less than 60 mL/min/1.73m2 from January 2004-December 2010 were included in this study (N=15,044). Patients with prior UNCHS nephrology clinic visits were excluded (N=204).
Data Source:
The patients’ sex, race, comorbidities, and GFR levels were identified from the clinical
medical records and laboratory information in the UNCHS WebClinical Information System (WebCIS). Information about scheduled nephrology appointments were obtained from the UNCHS appointment scheduling system. Patient’s age at visit, diagnoses, and primary insurance
44
Health, a biomedical informatics resource that manages all UNCHS clinical and research data. The Institutional Review Board of The UNC School of Medicine, as well as the UNCHS Governance Board approved this study.
Measurements
The categorization of race/ethnicity included African American, White, and Other race (American Indian, Asian/Pacific Islander, Hawaiian, Hispanic, or Other race). The patient’s age
was determined as the number of years between birth date and clinic visit date. Morbidity was defined by at least one diagnosis code (International Classification of Diseases, Ninth Revision, Clinical Modification (ICD-9-CM)) in the medical record within one year prior to the date of the low eGFR measurement, and included diabetes mellitus (ICD-9-CM: 250, 250.5), essential hypertension (ICD-9-CM: 401 and 402), and cardiovascular disease (ICD-9-CM:
410-414,428,429.2,430-438). Initial kidney function levels were categorized using the stages of CKD (3:30-59 mL/min/1.73m2; 4:15-29 mL/min/1.73m2; 5:< 15 mL/min/1.73m2).
Patient’s health insurance was categorized as no insurance, private (Blue Cross/ Blue
Shield, CHAMPUS, commercial insurance carriers and HMO/PPO), public (Medicaid, Medicare A or Medicare B), and a combination of both public and private insurance. Those lacking
insurance information in the data source were categorized as missing insurance information.
45 Assessment of eGFR
Estimates of eGFR were identified in two ways. For patients whose service date occurred after April 2005 (post-initiative), the eGFR value was abstracted from WebCIS. For patients whose service date occurred before April 2005 (pre-initiative), the MDRD equation was used to calculate patients’ eGFR, consistent with the method used by UNCHS’ automated eGFR
reporting via WebCIS.
Nephrology Scheduled Appointments and Visits
The UNCHS appointments scheduling database was searched to determine if an
appointment was scheduled for the patient within one year following a low eGFR measurement. If no indication of an appointment was identified in the appointment scheduling system, the patient was classified as having no scheduled nephrology appointment.
Patient Outcomes via Change in CKD Function
Laboratory records were searched to identify follow-up SCr measurements within 12 months following the initial nephrology visit to determine eGFR and CKD stage, for those with a scheduled nephrology appointment. Similarly, laboratory records were also searched for SCr measurements within 12 months following the initial laboratory value, for patients who did not have a scheduled nephrology visit. Change in CKD function was determined as the difference between CKD stage at the last SCr measurement and the CKD stage at the initial SCr
46
defined by the decrease in eGFR levels in the subsequent lab when compared to the initial lab. For example a reduction in eGFR from 15-29mL/min/1.73m2 to <15mL/min/1.73m2 would be categorized as a deterioration in function. Lastly, when the subsequent eGFR level was higher than the initial eGFR lab value the change is defined as an improvement of kidney function occurred. For example an individual whose initial lab value was 15-29mL.min/1.73m2 and a subsequent lab value one year later was 30-59 mL/min/1.73m2, would be categorized as an improvement in kidney function.
Statistical Analysis:
Summary statistics stratified by eGFR reporting period were obtained using basic descriptive analyses. The effect of automatic eGFR reporting on scheduled nephrology
appointments was examined using multiple logistic regression. Characteristics associated with a scheduled nephrology appointment, after a low eGFR value, were identified by examining bivariate relationships between CKD detection and each covariate, overall and within subgroups. A nominal level of statistical significance of 0.05 was used to identify associations with
covariates. Bivariate relationships between the outcome and each covariate, stratified by eGFR reporting period were used to determine patient characteristics associated with scheduled
nephrologist appointments before and after reporting implementation. Within strata ordinal tests of association were conducted to examine associations between reporting period and changes in kidney function stratified by initial CKD stage. All analyses were conducted using SAS
47
Results
Baseline Characteristics
We identified 14,840 patients with an eGFR less than 60 mL/min/1.73m2 Overall, 86.5% of the study population had an eGFR between 30-59 mL/min/1.73m2, and approximately 7% had more severe kidney disease with an eGFR of < 15 mL/min/1.73m2. The majority of patients were women (57%), 30% were African American and 50% were aged 40-59 years. Approximately 87% percent had public, private or some combination of health insurance. Thirty-three percent of the patients had a history of hypertension, 14.6% a history of diabetes, 14.5% a history of CVD (Table 7). A total of 5,467 patients were identified pre-initiative, 9,373 were post-initiative.
Characteristics Associated With Scheduled Nephrology Visit
Only 15% of the study population (N=2,156) had a scheduled a nephrology appointment within one year in the UNCHS whereas 85% (N=12,684) did not have a scheduled appointment within one year in the UNCHS. A higher proportion of those with lower eGFR values had a scheduled a nephrology appointment compared to those with higher eGFR values (Stage 5 57%, Stage 4 32%, Stage 3 9.8%). (Table 7) Similarly, a higher proportion of African Americans had scheduled appointments compared to whites (20.1% vs. 11.9%). Younger patients and those who travel the furthest distance to UNCHS had higher proportions of scheduled appointments.
48
Characteristics Associated With Automatic eGFR Reporting and Scheduled Nephrology Visits
The proportion of patients with a low eGFR measurement who were scheduled for a nephrology appointment were similar for the pre-initiative period and post-initiative period of automatic eGFR reporting (14.9% pre-reporting vs. 14.3% post-reporting). Among those with scheduled appointments, 816 patients were identified during the period before automatic eGFR reporting and 1340 during the period after automatic eGFR reporting. (Table 8)
The proportion of scheduled visits was higher post eGFR reporting initiative then pre eGFR reporting among individuals with an eGFR level of <15mL/min/1.73m2 (28.6% vs. 23.8 %), those aged 40-59 (50.0% vs. 55.9%) and those individuals with previous history of known risk factors for CKD (hypertension (14.8% vs. 29.4%); diabetes (8.9% vs. 15.4%); and CVD (6.1% vs. 10.1%). Conversely, individuals with eGFR between 15-29 mL/min/1.73m2 and aged 25-39 (17.3% vs. 21.2%) had a lower proportion of scheduled appointments post eGFR reporting initiative compared to pre-eGFR reporting initiative. However, no differences in the proportion of scheduled visits pre reporting and post reporting were observed for sex, race, health insurance and health access (Table 8).
Individuals with eGFR levels between 15-29 mL/min/1.73m2 and eGFR <15
mL/min/1.73m2 were significantly more likely to schedule a nephrology visit pre-initiative than those with eGFR between 30-59 mL/min/1.73m2 (OR=3.94; 95% CI: 3.17, 4.90; and OR=5.99; 95% CI: 4.87, 7.37 respectively). African Americans were 2.39 times as likely to have a