EXAMINING THE CAUSES AND CONSEQUENCES OF VARIATION IN OFFSPRING GROWTH AND SURVIVAL IN AN ALTRICIAL BIRD
Robert Allen Aldredge
A dissertation submitted to the faculty at the University of North Carolina at Chapel Hill in partial fulfillment of the requirements for the degree of Doctor of Philosophy in the
Department of Biology in College of Arts of Sciences
Chapel Hill 2015
2015
ABSTRACT
Robert Allen Aldredge: EXAMINING THE CAUSES AND CONSEQUENCES OF VARIATION IN OFFSPRING GROWTH AND SURVIVAL IN AN ALTRICIAL
BIRD
(Under the direction of Keith Sockman)
Understanding why parents often produce supernumerary offspring and increase the variation in offspring growth and survival is a fundamental question in evolutionary ecology. This behavior occurs primarily in species that live in unpredictable
environments and is thought to be an adaptive strategy used by parents to maximize the number of offspring that survive to breed. In this dissertation, I explore both how and why female birds increase the variation in growth and survival of supernumerary
offspring. To do this, I collected observational and experimental data over four years in a free-living population of house sparrows. In Chapter 2, I developed a novel technique to uncover variation in growth (e.g. mass change) not detected by conventional analyses. I show that variation in growth occurs when some offspring increase mass slowly, likely owing to a lack of food resources. Some of these offspring recover and increase mass rapidly to approach a similar pre-fledging mass as offspring that do not delay
embryos that survive to hatch or 2) as an adaptive strategy to maximize the number or quality of hatched young that fledge. I show that early incubation occurs too late to maximize survival of all embryos but early enough to reduce growth and survival of late-hatched young. Thus, early incubation likely is a tradeoff between increasing embryo survival and maintaining growth and survival of late-hatched young. Overall, my dissertation shows that house sparrows exhibit considerable plasticity in offspring growth, and that early incubation likely maximizes the number of embryos that survive the incubation and nestling periods to fledge as high quality young. Thus, the variation in offspring growth caused by early incubation may occur as consequence of unique
ACKNOWLEDGEMENTS
First, I would like to thank my advisor Keith for challenging me throughout my dissertation. These challenges made me think more critically and clearly about my research, and I hope have shaped me into a better scientist. In addition, I thank Keith for our many thought-provoking conversations about both experiment design and statistical analysis and for our "competitive" cycling adventures, which helped me to maintain my sanity over the past six years.
I also would like to thank my committee for helping to guide me through this long and difficult process. Specifically, I would like to thank Allen for his helpful feedback on my written exam and Bill for meeting with me and helping to guide me through the process of finishing my dissertation.
I am indebted to my labmate, Susan, who always was willing to provide feedback on talks, manuscripts and dissertation chapters. I can't thank you enough for all of the help and advice you have given me. I also thank the many graduate students and postdocs that helped me through this process, including, but not limited to Samuel Caro, Lisa Mangiamele, Brian Eastwood, Kendra Sewall, Lisa Bono, Nick Garcia, David Kikuchi, and Heidi MacLean.
I need to thank the farmers of Corbett Ridge Cattle Company and Baldwin Family Farms, who gave me access to their properties and who engaged into thoughtful
I also need to thank my parents, who have supported me both financially and psychologically during my almost decade-long graduate career. Mom and Gord, thank you for providing small loans when my field research was getting too expensive and for providing much needed motivational talks when I was about to give up on my degree. Thank you for always standing by me and letting me know that you love me no matter what initials follow my name.
TABLE OF CONTENTS
LIST OF TABLES . . . xi
LIST OF FIGURES . . . xii
CHAPTER 1: INTRODUCTION . . . 1
REFERENCES . . . 7
CHAPTER 2: USING NON-LINEAR MIXED EFFECTS MODELS TO IDENTIFY PATTERNS OF CHICK GROWTH IN HOUSE SPARROWS . . . 10
Summary . . . 10
Introduction . . . 11
Methods . . . 13
Statistical Analysis . . . 15
Identifying alternate growth patterns using nonlinear mixed models . . . 15
Characterizing individuals as optimal, delayed or slow growers . . . 16
Identifying growth patterns of suboptimal growers . . . 17
Results . . . 18
Identifying alternate growth patterns using nonlinear mixed models . . . 18
Identifying growth patterns of suboptimal growers . . . 18
Discussion . . . 19
Acknowledgements . . . 24
CHAPTER 3: INCUBATION ONSET IS A TRADEOFF BETWEEN MAINTAINING BOTH EMBRYO SURVIVAL AND GROWTH AND SURVIVAL OF LATE-HATCHED
YOUNG . . . 37
Summary . . . 37
Introduction . . . 38
Methods . . . 44
Statistical Analysis . . . 46
Effects of experimental manipulation on offspring production . . . 46
Effects of experimental manipulation on embryo and post-hatching survival . . . 47
Effects of experimental manipulation on post-hatching growth . . . 48
Effects of experimental manipulation on within-nest variation in offspring mass, size and condition . . . 49
Effects of relative offspring mass on post-hatching survival and growth . . . 52
Results . . . 53
Effects of experimental manipulation on offspring production . . . 53
Effects of experimental manipulation on embryo and post-hatching survival . . . 53
Effects of experimental manipulation on post-hatching growth . . . 54
Effects of experimental manipulation on within-nest variation in offspring mass, size and condition . . . 55
Effects of relative offspring mass on post-hatching survival and growth . . . 58
LIST OF TABLES
Table 2.1 - Change in growth parameters between nestlings that
exhibit optimal (not shown) and suboptimal growth. . . 30 Table 2.2 - Model selection for the random effect structure of
the nonlinear (logistic) mixed effects model examining post-hatching growth within a breeding population in
North Carolina . . . 31 Table 2.3 - How the nonlinear mixed effects model partitions
the variation in asymptotic mass . . . 32 Table 2.4 - Table showing the variance, standard deviation, and
correlation between the random effects of the nonlinear
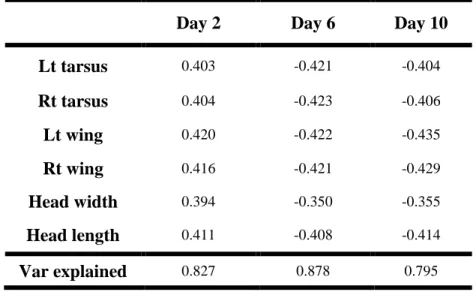
mixed effects model . . . 33 Table 3.1 - Principal components analysis (PCA) of six
morphological measurements at 2, 6, and 10 days
LIST OF FIGURES
Figure 2.1 - Theoretical growth patterns for offspring displaying
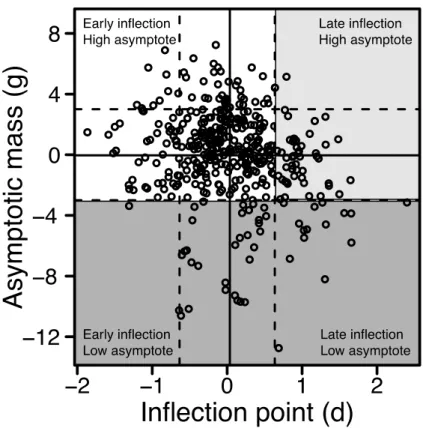
optimal and suboptimal growth . . . 34 Figure 2.2 - Variation in growth within a North Carolina breeding
population . . . 35 Figure 2.3 - Linear growth rates at four different growth
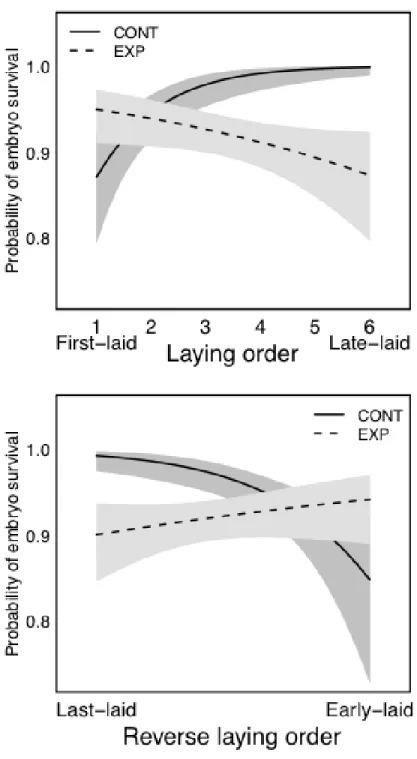
phases for optimal, delayed, and slow growers . . . 36 Figure 3.1 - Relationship between laying order and reverse
laying order and embryo survival in control and
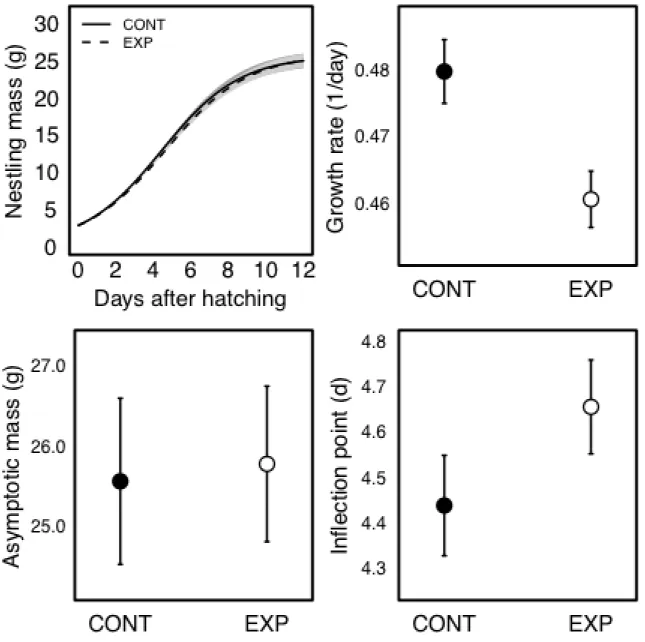
experimental nests . . . 76 Figure 3.2 - Differences in offspring growth between
control and experimental nests . . . 77 Figure 3.3 - Differences in offspring body size between
control and experimental nests at two, six,
and ten days after the first egg hatched . . . 78 Figure 3.4 - Differences in offspring body condition
between control and experimental nests at two, six, and ten days after the first
egg hatched . . . 79 Figure 3.5 - Change in standard deviation (i.e. variation)
in mass across the nestling period for control
and experimental nests . . . 80 Figure 3.6 - Change in coefficient of variation (i.e. size-
specific variation) in mass across the nestling
period for control and experimental nests . . . 81 Figure 3.7 - Relationship between laying order and hatching
delay in control and experimental nests . . . 82 Figure 3.8 - Relationship between hatching delay and a nestling's
relative mass at hatch completion for control and
experimental nests . . . 83 Figure 3.9 - Relationship between nestling survival and a nestling's
Figure 3.10 - Relationship between relative mass of last-hatched young and both variation and coefficient of variation
in mass at hatch completion . . . 85 Figure 3.11 - Differences in offspring growth between
control and experimental nests and based on a
nestling's relative mass at hatch completion . . . 86 Figure 3.12 - Relationship between nestling size and nestling mass
for control and experimental nestlings at two, six, and
CHAPTER 1: INTRODUCTION
The availability of resources for raising offspring often is unpredictable at the time of fertilization. In response to this unpredictability, many plants and animals produce as many or more offspring (embryos) than the environment can support, on average, and then eliminate surplus young when resources are limiting (Mock and Parker 1997). This strategy of eliminating supernumerary offspring allows parents to track resource availability and maximize the number of offspring that survive in unpredictable environments (Forbes 1990).
selectively eliminate poor quality young when resources are scarce (Forbes et al. 2001). Thus, many species inhabiting unpredictable environments invest unequally in
supernumerary offspring, a behavior that increases the variation in offspring growth and survival but likely maximizes the production of high quality young (Mock and Parker 1997).
Hatching (or birth) asynchrony provides one of the clearest examples of how parents invest unequally in supernumerary offspring. Hatching asynchrony occurs when siblings of the same cohort hatch (or are born) over an extended period, which allows some offspring to begin feeding and increase size before their siblings have finished embryonic development. In most species, the variation in offspring size caused by hatching asynchrony increases as offspring develop because large, early-hatched offspring outcompete their smaller siblings for access to resources provided by the parents (Myers and Master 1983, Szöllősi et al. 2007, Drake et al. 2008, Trillmich and Wolf 2008, Sharifi and Vaissi 2013). Thus, hatching asynchrony often is viewed as an adaptive strategy used by parents to differentiate offspring and maximize the production of high quality young in unpredictable environments (Lack 1954, Magrath 1989, Wiebe and Bortolotti 1995, Takata et al. 2014).
Hatching (or birth) asynchrony appears to have evolved independently in several taxa, including insects (Smiseth et al. 2006), cartilaginous fish (Gilmore 1993), reptiles (While et al. 2007), mammals (Fraser et al. 1979) and birds (Clark and Wilson 1981). Unlike in most taxa, hatching asynchrony is widespread in birds, which is facilitated by two unique adaptations shared by nearly all bird species: 1) unlike most oviparous
lay eggs as they are ovulated (Blackburn and Evans 1986) and 2) almost all birds regulate embryonic development by external heat provided by one or more parents (incubation; Avise 2013). These adaptations cause birds to lay at most one egg per day and also enable parents to control the timing of embryonic development, and hence hatching asynchrony, among offspring.
Over half a century ago, David Lack (1947, 1954) proposed that many temperate breeding birds produce as many eggs (embryos) as parents can raise in optimal
conditions, and begin incubation and thus embryonic development before all eggs are laid. This early incubation causes eggs to hatch asynchronously (Clark and Wilson 1981), which allows parents to reduce the number of offspring when food resources are scarce. Thus, Lack suggested that hatching asynchrony was an adaptive strategy used by parents to track food resources that are unpredictable at the time of egg laying. Despite over fifty years of research, it remains unclear whether hatching asynchrony maximizes offspring growth and survival (Stoleson and Beissinger 1997). Consequently, more than nineteen hypotheses have been proposed to explain the prevalence of hatching asynchrony in birds, but none have overwhelming support (Stoleson and Beissinger 1995, Viñuela 2000). Most are derived from Lack's brood reduction hypothesis and predict that hatching asynchrony is a strategy used by parents to increase the number of hatched offspring that fledge. Collectively, they are called adaptive hatching pattern hypotheses.
One problem with contemporary tests of the adaptive hatching pattern hypotheses is that experimental manipulations often are done after hatching. Although this
incubation onset) that causes variation in hatching. Thus, most experimental studies exclude the possibility that early incubation is selected for reasons other than creating an adaptive hatching pattern (Stoleson and Beissinger 1995, Stenning 1996, Viñuela 2000). Some of these alternative explanations include the possibility that early incubation is an adaptive behavior that maximizes embryo (pre-hatching) survival (egg viability
hypothesis; Arnold et al. 1987) or that early incubation reduces the amount of time offspring are exposed to nest predation (nest failure hypothesis; Clark and Wilson 1981). Because hatching asynchrony is strongly associated with timing of incubation in altricial birds (Wang and Beissinger 2009 but see Bortolotti and Wiebe 1993), researchers can create variation in hatching by regulating when females begin incubation. Such manipulations can test whether early incubation maximizes post-hatching growth and survival or whether early incubation may have some other adaptive function.
high, in house sparrows, and likely allows parents to track resources that are unpredictable during egg laying (Anderson 2006). Thus, the house sparrow is an appropriate species to investigate the causes and consequences of variation in offspring growth and survival.
REFERENCES
Aldredge, R.A., R.K. Boughton, M.A. Rensel, S.J. Schoech and R. Bowman. 2014. Hatching asynchrony that maintains egg viability also reduces brood reduction in a subtropical bird. Oecologia 174: 77-85.
Anderson, T.R. 2006. Biology of the ubiquitous house sparrow: from genes to populations. Oxford University Press, New York.
Arnold, T.W., F.C. Rohwer and T. Armstrong. 1987. Egg viability, nest predation, and the adaptive significance of clutch size in prairie ducks. American Naturalist 130: 643-653.
Avise, J.C. 2013. Evolutionary perspectives on pregnancy. Columbia University Press, New York.
Blackburn, D.G. and H.E. Evans. 1986. Why are there no viviparous birds? American Naturalist 128: 165-190.
Bortolotti, G.R. and K.L. Wiebe. 1993. Incubation behaviour and hatching patterns in the American kestrel Falco sparverius. Ornis Scandinavica 24: 41-47.
Clark, A.B. and D.S. Wilson. 1981. Avian breeding adaptations: hatching asynchrony, brood reduction, and nest failure. Quarterly Review of Biology 56: 253-277. Drake, A., D. Fraser and D.M. Weary. 2008. Parent-offspring resource allocation in
domestic pigs. Behavioral Ecology and Sociobiology 62: 309-319.
Forbes, L.S. 1990. Insurance offspring and the evolution of avian clutch size. Journal of Theoretical Biology 147: 345-359.
Forbes, S., B. Glassey, S. Thornton and L. Earle. 2001. The secondary adjustment of clutch size in red-winged blackbirds (Agelaius pheoniceus). Behavioral Ecology and Sociobiology 50: 37-44.
Fraser, D., B.K. Thompson, D.K. Ferguson and R.L. Darroch. 1979. The 'teat order' of suckling pigs: 3. Relation to competition within litters. Journal of Agricultural Science 92: 257-261.
Gilmore, R.G. 1993. Reproductive biology of lamnoid sharks. Environmental Biology of Fishes 38: 95-114.
Lack, D. 1947. The significance of clutch size. Ibis 89: 302-352.
Magrath, R.D. 1989. Hatching asynchrony and reproductive success in the blackbird. Nature 339: 536-538.
Mock, D.W. and G.A. Parker. 1997. The evolution of sibling rivalry. Oxford University Press, New York.
Myers, P. and L.L. Master. 1983. Reproduction by Peromyscus maniculatus: size and compromise. Journal of Mammalogy 64: 1-18.
O'Connor, R.J. 1977. Growth strategies in nestling passerines. The Living Bird 16: 209-238.
Ricklefs, R.E. 1965. Brood reduction in the curve-billed thrasher. Condor 67: 505-510. Sharifi, M. and S. Vaissi. 2013. The impact of body mass at birth on postnatal growth in
captive Kuhl's pipistrelle, Pipistrellus kuhlii (Chiroptera, Vespertilionidae). Mammalia 77: 181-186.
Smiseth, P.T., R.S.J. Ward and A.J. Moore. 2006. Asynchronous hatching in Nicrophorus vespilloides, an insect in which parents provide food for the offspring. Functional Ecology 20: 151-156.
Sockman, K.W. 2008. Ovulation order mediates a trade-off between pre-hatching and post-hatching viability in an altricial bird. PLoS One 3:e1785.
Stenning, M.J. 1996. Hatching asynchrony, brood reduction and other rapidly reproducing hypotheses. Trends in Ecology and Evolution 11: 243-246. Stoleson, S.H. and S.R. Beissinger. 1995. Hatching asynchrony and the onset of
incubation in birds, revisited. When is the critical period? In Current Ornithology, Vol. 12 (ed. Power, D.M.), pp. 191-270. Plenum Press, New York.
Stoleson, S.H. and S.R. Beissinger. 1997. Hatching asynchrony, brood reduction, and food limitation in a Neotropical parrot. Ecological Monographs 67: 131-154. Szöllősi, E., B. Rosivall and J. Török. 2007. Is hatching asynchrony beneficial for the
brood? Behavioral Ecology 18: 420-426.
Takata, M., S. Hayashi, C.E. Thomas, S. Koyama, T. Satoh and H. Fugo. 2014. Asynchronous hatching in the burying beetle, Nichrophorus quadripunctatus, maximizes parental fitness. Journal of Evolutionary Biology 27: 1830-1836. Trillmich, F. and J.B.W. Wolf. 2008. Parent-offspring and sibling conflict in Galápagos
Veiga, J.P. and J. Viñuela. 1993. Hatching asynchrony and hatching success in the house sparrow: evidence for the egg viability hypothesis. Ornis Scandinavica 24: 237-242.
Viñuela, J. 2000. Opposing selective pressures on hatching asynchrony: egg viability, brood reduction, and nestling growth. Behavioral Ecology and Sociobiology 48: 333-343.
Wang, J.M. and S.R. Beissinger. 2009. Variation in the onset of incubation and its influence on avian hatching success and asynchrony. Animal Behaviour 78: 601-613.
While, G. M., S. M. Jones and E. Wapstra. 2007. Birthing asynchrony is not a
consequence of asynchronous offspring development in a non-avian vertebrate, the Australian skink Egernia whitii. Functional Ecology 21: 513-519.
CHAPTER 2: USING NON-LINEAR MIXED EFFECTS MODELS TO IDENTIFY PATTERNS OF CHICK GROWTH IN HOUSE SPARROWS
Summary
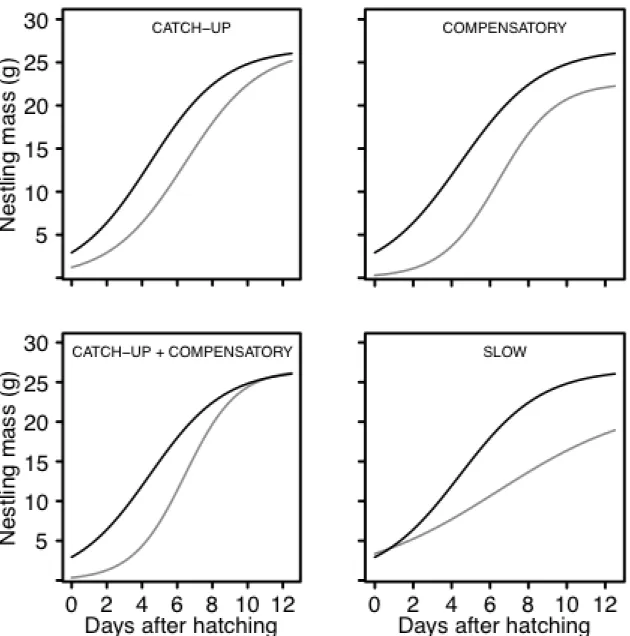
For many animals with determinate growth, adult size has an important influence on fitness. Thus, offspring that experience food restriction often delay development and then, following restriction, increase mass rapidly to approach an optimal size. These delayed growers can approach an optimal size by increasing mass faster than the peak growth of offspring that do not delay development (compensatory growth) or by extending the period of rapid growth to reach an optimal size (catch-up growth).
growth but still maximize size-related fitness benefits (e.g., increased survival and fecundity) prior to fledging.
Introduction
For many animals, adult size is an important determinant of fitness. Thus, growth often is optimized to increase size-related fitness traits (Blackenhorn 2005, Dmitriew 2010). In ideal conditions, growth is limited primarily by the ability of tissues to differentiate (Metcalfe and Monaghan 2001). However, conditions often are not ideal, resulting in considerable variation between individuals in their growth rates and final size (Schew and Ricklefs 1998). Individuals that experience nutritional deficits may delay growth until conditions improve and then increase mass rapidly to approach an optimal size (Hector and Nakagawa 2012).
Delayed growth occurs when individuals slow the rate at which tissues
accumulation of cellular damage and reduce survival and fecundity (Mangel and Munch 2005). In contrast, catch-up growth may enable offspring to minimize the cellular damage caused by rapid growth and reproduce before the negative fitness consequences (e.g., reduced survival and fecundity) of delayed growth are realized (Wilbur and Rudolf 2006, Alonso-Alvarez et al. 2006, Drummond et al. 2003).
Like many animals, postnatal (i.e. post-hatching) growth in birds follows a sigmoidal pattern (Ricklefs 1967). The rapid growth of passerines is approximated best by the logistic growth function, which has three parameters: asymptotic mass (A), the location of the inflection point (I), and a growth rate constant (K). For studies that use the logistic growth function to examine differences in growth, researchers often use K as the single measurement of growth. However, comparisons of growth within species may benefit from analyzing multiple growth parameters simultaneously because of the potential importance of variation in timing of development (I) and pre-fledging mass (A; Sofaer et al. 2013). Within a species or population, nestlings that display optimal growth are characterized by an early (low) inflection point, fast (high) growth rate, and heavy (high) asymptotic mass. Alternatively, nestlings that display slow growth are
characterized by a late (high) inflection point, slow (low) growth rate and light (low) asymptotic mass. Optimal and slow growth likely represent opposite ends of a
continuum, making it important to identify ways to define alternative patterns of post-hatching growth (i.e. catch-up and compensatory growth).
structure in hierarchical datasets (Pinheiro and Bates 2000), as occurs when analyzing multiple measurements of the same individual or when analyzing measurements on groups of related individuals. At the first level, fixed effects are used to test the direct effect of some independent variable (e.g., population or treatment) on one or more aspects of growth (A, I, or K). At the second level, random effects are used to account for some of the variation in the hierarchically structured dataset that is not explained by the direct (fixed) effects of the model. As such, random effects often are used to understand individual variation in growth (Huchard et al. 2014, Vicenzi et al. 2014).
I used a nonlinear (logistic) mixed effects model to identify alternative growth patterns in the house sparrow Passer domesticus. Specifically, I used random effect estimates from a logistic growth function to identify alternative growth patterns in nestlings from a North Carolina breeding population. I tested whether offspring that delayed development exhibited compensatory, catch-up, or slow growth (Table 2.1). I controlled for differences in timing of development between optimal and suboptimal growers by calculating linear growth rates based on time since the period of peak growth (I). These development-specific growth rates show whether nestlings that delayed
development increased mass faster than the peak growth rate of optimal growers, indicating compensatory growth, or simply shifted the timing of peak growth but maintained similar growth rates to those of optimal growers.
Methods
The mean incubation period was 10.55 (± 0.08) days and the mean nestling period was 13.49 (± 0.24) days.
From 2011 to 2014, I studied growth for 362 nestlings from 81 nests. Nestling growth was measured as changes in mass because very young birds and their parents are highly sensitive to the presence of researchers at the nest. This sensitivity causes a trade-off in the amount of data that can be collected and the frequency with which those data are collected. I chose to collect mass data at a frequency sufficient to generate non-linear growth curves (almost daily) instead of collecting size measures at a lower frequency (two or three times over a 12d nestling period), which could not provide a continuous measure of offspring growth. Because increases in mass often are highly correlated with increases in offspring size during post-hatching development in birds, the measurements used in this study likely provide fairly robust estimates of offspring growth (Ricklefs 1969).
between 10 and 12 days post-hatch. The number of mass measurements per individual varied from 1 to 13, with a median of 9.5 measurements per nestling.
Statistical Analysis
All analyses were done using R 2.14.0 (R Development Core Team 2014). To evaluate a set of candidate models, I chose the model with the lowest Akaike Information Criterion (AIC) value (Burnham and Anderson 2002). All parameter estimates are
reported as the mean 1 SE.
Identifying alternate growth patterns using nonlinear mixed models
I wrote and implemented a self-starting function for the logistic curve typically used to analyze growth of passerine nestlings (Starck and Ricklefs 1998):
w
t=
where wt = mass at time t (g), A = asymptotic mass (g), K = growth rate constant (1/day),
I = the inflection point of the growth curve (days), and t = nestling age (days). I fit all logistic growth curves using maximum likelihood in the nlme package of R (Pinheiro et al. 2011). In order to control for the non-independence of nestlings within the same nest and repeated measurements of individual nestlings, these models included nestling identity nested within brood as a random intercept. I included the three growth parameters (A, I, and K) as fixed effects and used the AIC value to determine which combination of growth parameters also should be included as random effects. Models that contained both I and K as random effects either failed to converge on a solution or exhibited a high correlation (r > 0.9). Thus, I chose the best model that contained random effects for either I or K.
Logistic growth parameters that did not include random effects were characterized
A
by a fixed effect estimate only. In contrast, growth parameters that included random effects were characterized by one fixed effect and one or more random effects (Table 2.2). For all models, the fixed effect (e.g., A) estimated the growth parameter of a typical (e.g. median) nestling from the population (Table 2.3). The brood-level random effect (e.g., Ai) estimated how the growth parameter of a typical nestling from an individual brood deviates from a typical nestling in the population (Table 2.3). The nestling-level random effect (e.g., Aij) estimated how the growth parameter of an individual nestling deviates from a typical nestling in its brood (Table 2.3). Thus, the sum of the brood- and nestling-level random effects estimated how the growth parameter of an individual
nestling deviates from a typical nestling in the population. I show results using the sum of the brood- and nestling-level random effects because I am interested in the variation in growth among individuals in this population.
Characterizing individuals as optimal, delayed or slow growers
I used random effect estimates (sum of brood- and nestling-level estimates) to identify alternative growth patterns in the house sparrow. I divided nestlings that survived the nestling period into one of three growth patterns: optimal, delayed, and slow growth. Nestlings exhibited optimal growth if the random effect estimate for the inflection point was less than one standard deviation above the fixed effect estimate of the population (indicating a normal to early inflection point) and the random effect estimate for
random effect estimate for the asymptotic mass was greater than one standard deviation below the fixed effect estimate (indicating normal to heavy asymptotic mass; Figure 2.2). These delayed growers are likely candidates for catch-up or compensatory growth.
Nestlings exhibited slow growth if the random effect estimate of the asymptotic mass was less than one standard deviation below the fixed effect estimate (indicating a light
asymptotic mass independent of the inflection point; Figure 2.2). I used a linear mixed effects model with clutch as a random intercept to determine whether a relationship existed between the random effect estimates.
Identifying growth patterns of suboptimal growers
pattern. Finally, the asymptotic growth rate was estimated as the linear change in mass from five to seven days after the inflection point of each growth pattern.
Results
Identifying alternate growth patterns using nonlinear mixed models
The nonlinear mixed effects model that included both brood- and nestling-level random effects for the asymptotic mass (A) and inflection point (I) was the best model (Table 2.2). The brood-level random effect explained more of the residual variation than the nestling-level random effect for both A and I (Table 2.4). A negative relationship
existed between A and I (coefficient estimate: -2.53 0.20; t = -12.91, P < 0.001),
suggesting that light nestlings in this population reached their inflection point later than heavy nestlings (Figure 2.2).
Most nestlings that survived to fledge (71.3%; n = 239) displayed optimal growth. Approximately half of suboptimal growers (14.6% of surviving young; n = 49) were characterized by delayed growth, and the other half (14.0% of surviving young; n = 47) were characterized by slow growth. The inflection point was shifted -0.22, 0.98, and 0.36 days from the population-level fixed effect (4.44d) for optimal, delayed and slow
growers, respectively. The asymptotic mass was shifted 0.77, -0.19, and -5.93g from the population-level fixed effect (26.63g) for optimal, delayed and slow growers,
respectively.
Identifying growth patterns of suboptimal growers
optimal growers (indicating catch-up growth). Nestlings that displayed optimal growth increased mass more rapidly during the early growth phase (2.10 0.04 g/d) than
nestlings that displayed delayed (1.85 0.08 g/d; t = 2.68, P = 0.008) and slow growth
(1.42 0.08 g/d; t = 7.31, P < 0.001; Figure 2.3). Nestlings that displayed optimal growth
also increased mass more rapidly during the peak growth phase (2.91 0.03 g/d) than
nestlings that displayed delayed (2.57 0.07 g/d; t = 4.65, P = 0.241) and slow growth
(1.79 0.07 g/d; t = 15.35, P < 0.001; Figure 2.3). Nestlings that displayed optimal and
slow growth increased mass similarly (optimal: 1.59 0.07 g/d; slow: 1.58 0.15 g/d; t =
0.04, P = 0.970) but more slowly than nestlings that displayed delayed growth (2.16
0.14 g/d; t = 3.74, P < 0.001; Figure 2.3) during the late growth phase. Finally, nestlings that displayed optimal growth increased mass more slowly during the asymptotic growth phase (0.34 0.08 g/d) than nestlings that displayed delayed growth (0.73 0.16 g/d; t =
-2.22, P = 0.027), and nestlings that displayed delayed growth increased mass more slowly than nestlings that displayed slow growth (1.73 0.17 g/d; t = 4.23, P < 0.001;
Figure 2.3). Discussion
I have shown how random effect estimates from nonlinear mixed effects models can be used to identify important variation in post-hatching growth. Specifically,
in growth not explained by differences between populations (Sofaer et al. 2013). Thus, these results suggest that nonlinear mixed effects models may be a powerful analytical technique to identify important, but previously undetected variation in offspring growth.
Using a mixed modeling approach, I found evidence of catch-up growth in wild house sparrows, a strategy in which nestlings shifted the timing of peak growth and extended the period of rapid development to reach a similar mass as optimal growers (Lepczyk and Karasov 2000). I found no evidence of compensatory growth, likely because growth has been optimized evolutionarily at the peak growth rate of optimal growers (Ricklefs 1979). Some offspring maintained a fairly stable but slow growth rate and reached a light asymptotic mass prior to fledging. Despite the differences in
asymptotic mass between nestlings that displayed catch-up and slow growth, all suboptimal growers increased mass faster than optimal growers toward the end of development.
for differences in timing of development and test directly whether offspring that delay development increase mass faster than optimal growers (Nicieza and Álvarez 2009), which will indicate whether offspring exhibit compensatory growth.
To control for differences in timing of development, researchers need to consider the trajectory of postnatal growth (Dmitriew 2010, Hector and Nakagawa 2012). In fact, some form of all three growth parameters (timing of peak growth [I], peak growth rate [K], and final mass [A]) can distinguish between alternative growth patterns (Table 2.1), even in studies that do not use nonlinear growth functions. Studies first need to determine whether offspring have shifted the timing of peak growth (e.g. delayed growth). For analyses using nonlinear growth functions, a shift in the location of the inflection point may indicate that offspring have delayed growth temporarily. For analyses not using nonlinear growth functions, delayed growth can be identified by a delay (or suspension) of growth during food restriction. Next, the peak growth rate can be estimated to identify whether offspring that delayed development increased mass faster than the peak growth rate of optimal growers (exhibit compensatory growth). By controlling for differences in timing of development, peak growth rates will be estimated at later ages for offspring that delayed development, which likely enable comparisons of growth at similar
concentrating mass measurements around the period of peak growth and the attainment of the asymptotic mass.
In this study, post-hatching growth was estimated as changes in offspring mass, which makes it difficult to compare these results with studies that focus on
developmental changes in offspring size. Although increases in mass and size often are correlated in altricial birds during development (Ricklefs 1969), nestlings can increase size somewhat independently of post-hatching mass (Zach and Mayoh 1982, Skagen 1987). Because strong selection exists for altricial birds to reach a threshold size prior to fledging, offspring often bias investment into increasing size more than mass when food availability is low (Nilsson and Svensson 1996). Despite the importance of reaching a threshold size, much of the research investigating how post-hatching growth influences both short- and long-term survival in birds has been done using developmental
differences in offspring mass. This likely occurs because mass provides an estimate of growth that is quick and easy to quantify in free-living birds. Previous studies have shown that offspring mass is an important predictor of post-fledging survival and
recruitment into the breeding population (Magrath 1991, Mumme et al. 2015), suggesting that it may be as important that offspring reach a threshold mass by the end of post-hatching development than it is that they reach a threshold size.
compensatory growth is thought to reduce future survival by shortening the length of telomeres (Geiger et al. 2012, Nettle et al. 2015) or by causing oxidative damage
(Alonso-Alvarez et al. 2007), which can increase the rate of cell death, negatively affect normal cell cycle functioning, and decrease resistance to disease (Mangel and Munch 2005). In addition to negative effects at the cellular level, compensatory growth may cause developing offspring to produce morphological traits that reduce locomotor
performance and increase susceptibility to predation (Arendt et al. 2001, Ficetola and De Bernardi 2006) or impair brain development and reduce performance of learning and other cognitive tasks (Fisher et al. 2006). Despite the lack of a clear understanding of the mechanism, compensatory growth has been shown to reduce future survival (Metcalfe and Monaghan 2003) and reproduction (Auer et al. 2010), and thus should be avoided unless the fitness benefits are relatively high. This may explain why house sparrow nestlings that delayed development did not display compensatory growth by increasing mass faster than optimal growers, but extended the period of rapid growth to reach a similar asymptotic mass prior to fledging.
It is unclear how suboptimal growth influences post-fledging survival and
rapid growth may not be realized in the short-lived house sparrow, but the potential fitness benefits of increasing pre-fledging mass likely are important.
House sparrows are cavity nesters and may experience relaxed selection pressure to fledge quickly. Low predation risk could enable house sparrows to slow growth temporarily and extend the developmental period in some nestlings (Schew and Ricklefs 1998, Bize et al. 2006), but still maintain an optimal growth rate and short developmental period for a core group of offspring (Forbes et al. 1997). The smallest, often last-hatched, young typically fledge one or more days after the other nestlings in the brood (Aldredge, personal observation). Thus, low predation risk may enable offspring to increase the variation in growth and timing of fledging, and might explain why clutch size is larger (Jetz et al. 2008) and developmental periods longer (von Haartman 1957) in cavity than in open cup nesters. Future studies should examine whether catch-up growth is more common than previously recognized in passerines, and whether this growth pattern occurs more frequently in species that have a low risk of nest predation. In addition, future research should test directly whether passerines are able to exhibit compensatory growth and increase mass faster than the peak growth rate of optimal growers. By using random effect estimates from nonlinear mixed effects models, researchers may be able to tease apart important differences in offspring growth and uncover developmental
strategies that have evolved to maximize fitness.
Acknowledgements
REFERENCES
Alonso-Alvarez, C., S. Bertrand, G. Devevey, J. Prost, B. Faivre, O. Chastel and G. Sorci. 2006. An experimental manipulation of life-history trajectories and resistance to oxidative stress. Evolution 60: 1913-1924.
Alonso-Alvarez, C., S. Bertrand, B. Faivre and G. Sorci. 2007. Increased susceptibility to oxidative damage as a cost of accelerated somatic growth in zebra finches.
Functional Ecology 21: 873-879.
Arendt, J.D., D.S. Wilson and E. Stark. 2001. Scale strength as a cost of rapid growth in sunfish. Oikos 93: 95-100.
Auer, S.K., J.D. Arendt, R. Chandramouli and D.N. Reznick. 2010. Juvenile
compensatory growth has negative consequences for reproduction in Trinidadian guppies (Poecilia reticulata). Ecology Letters 13: 998-1007.
Bize, P., N.B. Metcalfe and A. Roulin. 2006. Catch-up growth strategies differs between body structures: interactions between age and structure-specific growth in wild nestling Alpine swifts. Functional Ecology 20: 857-864.
Blackenhorn, W.U. 2005. Behavioral causes and consequences of sexual size dimorphism. Ethology 111: 977-1016.
Bouwhuis, S., O. Vedder, C.J. Garroway and B.C. Sheldon. 2015. Ecological causes of multilevel covariance between size and first-year survival in a wild bird
population. Journal of Animal Ecology 84: 208-218.
Burnham, K.P. and D.R. Anderson. 2002. Model Selection and Multimodel Inference: A Practical Information-theoretic Approach, 2nd edn. Springer, New York.
Criscuolo, F., P. Monaghan, L. Nasir and N.B. Metcalfe. 2008. Early nutrition and phenotypic development: 'catch up' growth leads to elevated metabolic rate in adulthood. Proceedings of the Royal Society B 275: 1565-1570.
De Block, M. and R. Stoks. 2008. Compensatory growth and oxidative stress in a damselfly. Proceedings of the Royal Society B 275: 781-785.
Dmitriew, C.M. 2010. The evolution of growth trajectories: what limits growth rate? Biological Reviews 86: 97-116.
Dybala, K.E., T. Gardali and J.M. Eadie. 2013. Dependent vs. independent juvenile survival: contrasting drivers of variation and the buffering effect of parental care. Ecology 94: 1584-1593.
Ficetola, G.F. and F. De Bernardi. 2006. Trade-off between larval development rate and post-metamorphic traits in the frog Rana latastei. Evolutionary Ecology 20: 143-158.
Finkel, T. and N.J. Holbrook. 2000. Oxidants, oxidative stress and the biology of ageing. Nature 408: 239-247.
Fisher, M.O., R.G. Nager and P. Monaghan. 2006. Compensatory growth impairs adult cognitive performance. PLoS Biology 8: 1462-1466.
Forbes, S., S. Thornton, B. Glassey, M. Forbes and N.J. Buckley. 1997. Why parent birds play favorites. Nature 390: 351-352.
Geiger, S., M. Le Vaillant, T. Lebard, S. Reichert, A. Stier, Y. Le Maho and F. Criscuolo. 2012. Catching-up but telomere loss: half-opening the black box of growth and ageing trade-off in wild king penguin chicks. Molecular Ecology 21: 1500-1510. Hector, K.L. and S. Nakagawa. 2012. Quantitative analysis of compensatory and
catch-up growth in diverse taxa. Journal of Animal Ecology 81: 583-593.
Hegyi, G. and J. Torok. 2007. Developmental plasticity in a passerine bird: an experiment with collared flycatchers Ficedula albicollis. Journal of Avian Biology 38: 327-334.
Huchard, E., A. Charmantier, S. English, A. Bateman, J.F. Nielsen and T. Clutton-Brock. 2014. Additive genetic variance and developmental plasticity in growth
trajectories in a wild cooperative mammal. Journal of Evolutionary Biology 27: 1893-1904.
Jetz, W., C.H. Sekercioglu and K. Bohning-Gaese. 2008. The worldwide variation in avian clutch size across species and space. PLoS Biology 6: 2650-2657. Killpack, T.L., D.N. Tie and W.H. Karasov. 2014. Compensatory growth in nestling
Zebra Finches impacts body composition but not adaptive immune function. Auk 131: 396-406.
Lepczyk, C.A. and W.H. Karasov. 2000. Effect of ephemeral food restriction on growth of house sparrows. Auk 117: 164-174.
Mangel, M. and S.B. Munch. 2005. A life-history perspective on short- and long-term consequences of compensatory growth. American Naturalist 166: E155-E176. Metcalfe, N.B. and P. Monaghan. 2001. Compensation for a bad start: grow now, pay
later? Trends in Ecology and Evolution 16: 254-260.
Metcalfe, N.B. and P. Monaghan. 2003. Growth versus lifespan: perspective from evolutionary ecology. Experimental gerontology 38: 935-940.
Mumme, R.L., R. Bowman, M.S. Pruett and J.W. Fitzpatrick. 2015. Natal territory size, group size, and body mass affect lifetime fitness in the cooperatively breeding Florida Scrub-Jay. Auk 132: 634-646.
Nettle, D., P. Monaghan, R. Gillespie, B. Brilot, T. Bedford and M. Bateson. 2015. An experimental demonstration that early-life competitive disadvantage accelerates telomere loss. Proceedings of the Royal Society B 282: 20141610.
Nilsson, J. and M. Svensson. 1996. Sibling competition affects nestling growth strategies in marsh tits. Journal of Animal Ecology 65: 825-836.
Nicieza, A.G. and D. Álvarez. 2009. Statistical analysis of structural compensatory growth: how can we reduce the rate of false detection? Oecologia 159: 27-39. Pinheiro, J. and D. Bates. 2000. Mixed-effects models in S and S-plus. Springer, New
York.
Pinheiro, J., D. Bates, S. Debroy, D. Sarkar and The R Development Core Team. 2011. nlme: linear and nonlinear mixed effects models. - R package ver. 3.1-98. R Development Core Team 2014. R: A Language and Environment for Statistical
Computing. Vienna: R Foundation for Statistical Computing. http://www.R-project.org/.
Ricklefs, R.E. 1967. A graphical method of fitting equations to growth curves. Ecology 48: 978-983.
Ricklefs, R.E. 1969. Preliminary models for growth rates in altricial birds. Ecology 50: 1031-1039.
Ricklefs, R.E. 1979. Adaptation, constraint, and compromise in avian postnatal development. Biological Reviews 54: 269-290.
Schwagmeyer, P.L. and D.W. Mock. 2008. Parental provisioning and offspring fitness: size matters. Animal Behaviour 75: 291-298.
Skagen, S.K. 1987. Hatching asynchrony in American goldfinches: an experimental study. Ecology 68: 1747-1759.
Sofaer, H.R., P.L. Chapman, T.S. Sillett and C.K. Ghalambor. 2013. Advantages of nonlinear mixed models for fitting avian growth curves. Journal of Avian Biology 44: 469-478.
Starck, J.M. and R.E. Ricklefs. 1998. Developmental plasticity. In Avian growth and development: evolution within the altricial-precocial spectrum (eds. Starck, J.M. and R.E. Ricklefs), pp. 247-265. Oxford University Press, New York.
Vicenzi, S., M. Mangel, A.J. Crivelli, S. Munch and H.J. Skaug. 2014. Determining individual variation in growth and its implication for life-history and population processes using the Empirical Bayes method. PLoS Computational Biology 10: e1003828.
von Haartman, L. 1957. Adaptation in hole-nesting birds. Evolution 11: 339-347. Wilbur, H.M. and V.H.M. Rudolf. 2006. Life-history evolution in uncertain
environments: bet hedging in time. American Naturalist 168: 398-411.
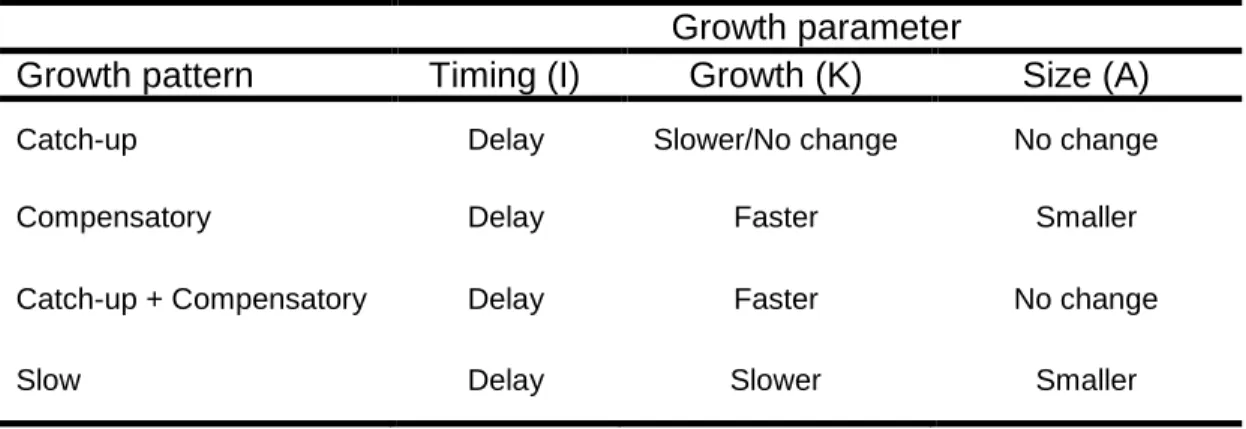
Table 2.1: Change in growth parameters between nestlings that exhibit optimal (not shown) and suboptimal growth. All suboptimal growers delay the timing of peak growth [Timing (I)]. In addition, compensatory growers develop faster than the peak growth rate [Growth (K)] of optimal growers, and offspring that exhibit catch-up growth reach an optimal size [Size (A)]. Slow growers increase mass slowly and reach a small adult size.
Growth parameter
Growth pattern Timing (I) Growth (K) Size (A)
Catch-up Delay Slower/No change No change
Compensatory Delay Faster Smaller
Catch-up + Compensatory Delay Faster No change
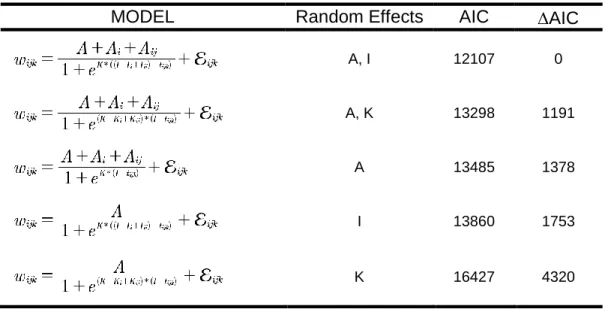
Table 2.2: Model selection for the random effect structure of the nonlinear (logistic) mixed effects model examining post-hatching growth within a breeding population in North Carolina. Each model included a population-level fixed effect (e.g., A) for each growth parameter and clutch-level (e.g., Ai) and nestling-level (e.g., Aij) random effects for at least one of the three growth parameters: asymptotic mass (A), inflection point (I), and growth rate (K). The best model included random effects for A and I. The model that included random effects for all three growth parameters failed to converge on a solution (NA), likely because I and K were highly correlated.
MODEL Random Effects AIC AIC
A, I 12107 0
A, K 13298 1191
A 13485 1378
I 13860 1753
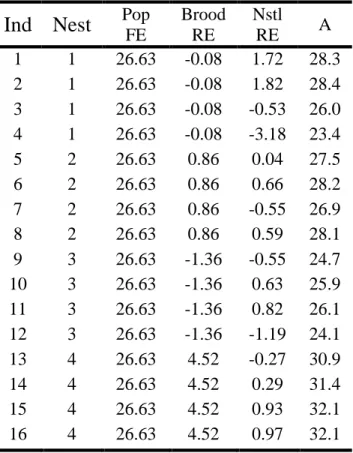
Table 2.3: How the nonlinear mixed effects model partitions the variation in asymptotic mass. The asymptotic mass (A) for an individual (Ind) is the sum of the fixed effect estimate for population (Pop FE), random effect estimate for each brood (Brood RE), and random effect estimate for each nestling (Nstl RE). The brood-level random effect shows how much a typical nestling from a given brood deviates from a typical nestling in the population. The nestling-level random effect shows how much an individual nestling deviates from a typical nestling in its brood, and the sum of the brood- and nestling-level random effects (not shown) identifies how much an individual nestling deviates from a typical nestling in the population. Growth parameters that do not include any random effects were characterized by the fixed effects only.
Ind Nest
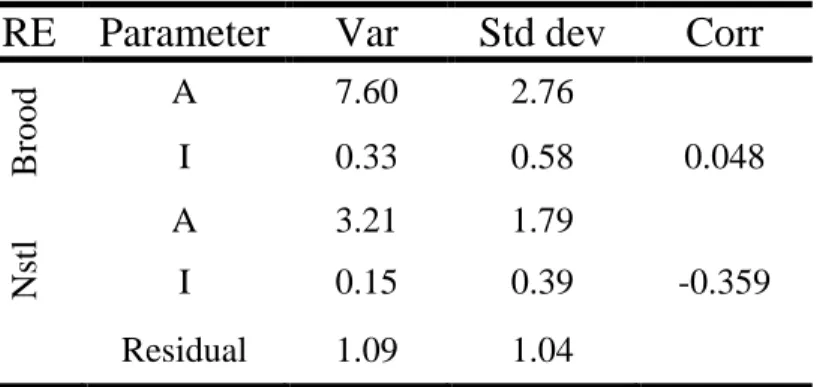
Pop FE Brood RE Nstl RE ATable 2.4: Table showing the variance (Var), standard deviation (Std dev), and correlation between the random effects (Corr) for asymptotic mass (A) and inflection point (I) at both the brood (Brood) and nestling (Nstl) levels. Overall, the brood-level RE explained more of the residual variation than the nestling-level RE for both A and I.
RE Parameter
Var
Std dev
Corr
B
rood
A 7.60 2.76
I 0.33 0.58 0.048
Nstl
A 3.21 1.79
I 0.15 0.39 -0.359
CHAPTER 3: INCUBATION ONSET IS A TRADEOFF BETWEEN MAINTAINING BOTH EMBRYO SURVIVAL AND GROWTH AND
SURVIVAL OF LATE-HATCHED YOUNG
Summary
Hatching (or birth) asynchrony occurs primarily as a consequence of the timing of embryonic development (or parturition). Despite over 50 years of study, it is unclear why, ultimately, most birds initiate embryonic development (incubation) before all eggs are laid. One hypothesis focuses on pre-hatching (embryo) survival and predicts that early incubation maximizes embryo survival by reducing exposure of unincubated eggs (egg viability hypothesis). Another set of hypotheses focuses on post-hatching growth and survival and predicts that females time incubation to maximize the number or quality of hatched offspring that fledge (adaptive hatching pattern hypotheses). I experimentally manipulated when females could begin incubation to test how timing of embryonic development influences pre-hatching survival and post-hatching growth and survival in the house sparrow Passer domesticus. I found that early incubation maximized embryo survival in all but the earliest-laid eggs, suggesting that house sparrows begin incubation too late to maximize survival of all embryos. Early incubation had little effect on overall (i.e. mean) patterns of post-hatching growth and survival. However, early incubation increased the initial variation in offspring size because last-hatched young were relatively small when all eggs had completed hatching. Nestlings that were small at hatch
house sparrows begin incubation too early to maximize growth and survival of hatched offspring. These results suggest that timing of incubation neither maximizes embryo survival nor maximizes post-hatching growth and survival. Instead, early incubation appears to be a tradeoff between maintaining both embryo survival and growth and survival of late-hatched offspring. Thus, house sparrow females likely time incubation as an adaptive strategy to maximize the number of embryos that survive the incubation and nestling periods to fledge.
Introduction
Hatching (or birth) asynchrony occurs when siblings of the same cohort hatch (or are born) at different times (Stenning 1996). Hatching asynchrony in oviparous species is caused primarily by differences in the timing of embryonic development associated with sequential ovulation (While et al. 2007, Sockman 2008), whereas birth asynchrony in viviparous species can be caused either by differences in timing of embryonic
development (Gilmore 1993) or by differences in timing of birth associated with
sequential parturition (Fraser et al. 1979). Hatching (or birth) asynchrony often increases the variation in offspring size at hatching, a pattern that can have important consequences for parental and offspring fitness.
lay at most one egg per day and in nearly all species, embryonic development is driven by parental incubation (Avise 2013). Instead of beginning incubation after all eggs are laid, most species initiate incubation before clutch completion, which may cause eggs to hatch over one or more days (Clark and Wilson 1981).
The relationship between timing of incubation and hatching asynchrony differs considerably among birds, based primarily on the species' developmental mode (Clark and Wilson 1981, Magrath 1990). Precocial species often begin incubation one or more days before clutch completion, but hatching patterns do not always reflect timing of incubation (Freeman and Vince 1974, Persson and Andersson 1999). Instead, embryos of most, but not all (Hussell and Page 1976), precocial species produce clicking noises at the end of embryonic development (McCoshen and Thompson 1968), a behavior that
synchronizes development, and hence hatching within a clutch (Vince 1968). This
hatching synchronization maximizes both parental and offspring fitness by increasing the number of hatched young that leave the nest (fledge). In contrast, no altricial species have been shown to use inter-egg communication to synchronize development, and hatching patterns often reflect timing of parental incubation (Magrath 1990, Wiebe et al. 1998, but see Bortolotti and Wiebe 1993). Thus, many altricial birds exhibit extensive hatching asynchrony as a result of early incubation onset (Clark and Wilson 1981). Unlike in precocial species, altricial offspring compete to monopolize parental care after hatching, which maximizes direct fitness of individual offspring but decreases indirect and possibly parental fitness (Mock 1985, Cotton et al. 1999, Ricklefs 2002). Thus, altricial offspring presumably have abandoned the ability to synchronize hatching and evolved in a
(pre-hatching) and post-hatching development. This may explain why the variation in offspring size caused by early incubation is maintained in altricial birds (Ricklefs, 1969, Ricklefs 1984, Ricklefs 1993), but also leads to the long-standing question: Why, ultimately, is early incubation, and hence hatching asynchrony, widespread in altricial species?
to simulate synchronously and asynchronously hatching clutches (Magrath 1990, Stoleson and Beissinger 1995). These studies predict that synchronously hatching clutches will: 1) produce fewer offspring that survive to fledge, 2) produce lower quality (e.g. smaller or lighter) offspring at or near fledging, or 3) produce offspring that exhibit lower post-fledging survival (Stoleson and Beissinger 1997). Overall, hatching
asynchrony may increase post-hatching growth and survival in environments or years when food is limiting (Magrath 1989, Wiebe and Bortolotti 1994, Amundsen and
Slagsvold 1998, Hebert and McNeil 1999, Forbes et al. 2001, Podlas and Richner 2013), but this likely does not explain why most birds, including precocial species whose eggs hatch synchronously, begin incubation prior to clutch completion (Clark and Wilson 1981, Arnold et al. 1987). Furthermore, tests of the adaptive hatching pattern hypotheses often fail to account for the effects of incubation behavior on embryo survival (Viñuela 2000).
failure) by beginning incubation before clutch completion, which decreases the length of exposure for undeveloped embryos. Hatching failure increases in as few as two days of exposure, which is the time required to lay a 3-egg clutch in many species (Beissinger et al. 2005). Regardless of the mechanism, embryo mortality increases when eggs are exposed to the environment for prolonged periods prior to incubation, which can have important consequences for parental fitness.
I experimentally manipulated when females could begin incubation to test predictions of the egg viability and adaptive hatching pattern hypotheses in the house sparrow (Passer domesticus). The house sparrow, like many temperate breeding
more fledged young or should produce more high quality young that fledge compared to experimentally synchronized nests.
In most altricial species, early incubation influences post-hatching growth and survival primarily by increasing the variation in offspring size at hatching (Clark and Wilson 1981). Because even experimentally synchronized clutches exhibit some variation in size caused by asynchronous hatching (Harper et al. 1993), I also examined how timing of incubation influenced the variation in offspring size at hatching and then whether this variation was associated with differences in post-hatching growth and survival. To quantify the variation in offspring size, I used the mass difference (in grams) between an individual chick and the heaviest nestling in the brood one day after the first egg hatched, which provides a direct and ecologically relevant estimate of a nestling's mass relative to its nestmate(s) when all eggs in a clutch had completed hatching (hereafter referred to as hatch completion). The heaviest nestling in the brood had no mass difference (0g), and a large mass difference indicated that a nestling was relatively light at hatch completion. I predicted that naturally asynchronous nests would exhibit greater variation in offspring size at hatch completion because these nests would contain more relatively light nestlings. I also predicted that the increased variation would enable nestlings from asynchronous nests to grow better, on average, than nestlings from experimentally synchronized nests.
by hatching asynchrony. Such a result would suggest that early incubation does not support either hypothesis but likely occurs as a tradeoff between maintaining both embryo survival and post-hatching survival and growth (Sockman 2008, Aldredge et al. 2014).
Methods
I studied a population of house sparrows near Yanceyville, North Carolina
was exchanged with the clutch of dummy eggs. Thus, incubation was delayed until clutch completion in experimental clutches. For the control treatment, each egg was marked with an indelible marker, replaced with a dummy egg and carried approximately 100m from the nest before returning it to the focal nest and exchanging it with the dummy egg. This procedure controlled for the transportation and handling manipulation but allowed females to begin incubation prior to clutch completion. Unfortunately, eggs from
experimental nests were moved twice (i.e. once at laying and once at clutch completion) during the manipulation whereas control eggs were moved only once at laying. This difference in egg handling between experimental and control nests allowed me to avoid jostling embryos from control eggs that had initiated embryonic development. Because embryos from experimental eggs should not have initiated development prior to the second handling at clutch completion, this difference should have no effect on embryo survival.
Beginning nine days after clutch completion, I visited nests once in the morning and once in the evening until at least one egg hatched and then visited these nests four to five times daily (approximately every three to six hours during daylight) until all viable eggs hatched. I identified laying order of individual nestlings, when known, uniquely clipped nestlings’ toenails for individual identification, and weighed all nestlings in a
period, I stopped weighing nestlings after a majority of the nestlings in a brood failed to gain mass between two successive measurement days, which typically occurred between 10 and 12 days post-hatch. However, I continued to monitor nests daily to identify when all nestlings had fledged. To estimate post-hatching size and condition, I measured the length of both tarsi, the length of both wing chords, head length and head width to the nearest 0.01mm using a Mitutoyo dial caliper at two, six and ten days after the first egg of a clutch hatched. All procedures were reviewed and approved by the Institutional Animal Care and Use Committee of the University of North Carolina at Chapel Hill (Permit Number: 12-046.0)
Statistical analysis
All analyses were done using R 2.14.0 (R Development Core Team 2014). To evaluate a set of candidate models, I chose the model with the lowest Akaike Information Criterion (AIC) value for models that estimated parameters based on maximum
likelihood (Burnham and Anderson 2002). I chose the model with the lowest Quasi-Akaike Information Criterion (QIC) value for generalized estimating equations that implemented a quasi-likelihood approach (Pan 2001). For all analyses, I included data only from clutches of four to six eggs because house sparrows in this population rarely lay fewer than four or more than six eggs in a clutch (Aldredge unpub. data). All coefficient and parameter estimates are reported as the mean 1 SE.
Effects of experimental manipulation on offspring production
Effects of experimental manipulation on embryo and post-hatching survival
I used a generalized linear mixed effects model with a binomial error distribution and clutch nested within female as a random intercept and clutch as a random coefficient for laying order to examine whether laying order, treatment, clutch size or the
interactions between treatment and laying order and treatment and clutch size influenced the probability that an embryo survived the incubation period (i.e. the egg hatched). Unfortunately, few eggs failed to hatch in this study, which precluded testing patterns of embryo survival for individual eggs in the laying sequence. However, I subtracted a value of one from each egg in the laying sequence, which caused the first-laid egg in each clutch to occur at the y-intercept. This approach allowed me to test whether the
experimental manipulation influenced embryo survival in first-laid eggs (i.e. by testing whether the y-intercept differed between experimental treatments), which is the egg that is predicted to have the lowest rate of embryo survival. I also used a generalized linear mixed effects model with a binomial error distribution and clutch nested within female as a random intercept and clutch as a random coefficient for laying order to examine
whether the probability that an embryo survived changed from last- to early-laid eggs (i.e. reverse laying order) or was influenced by treatment, clutch size or the interactions between treatment and reverse laying order and treatment and clutch size.
Effects of experimental manipulation on post-hatching growth
I wrote and implemented a self-starting function for the Logistic curve typically used to analyze growth for passerine nestlings (Starck and Ricklefs 1998):
wt =
where wt = mass at time t (g), A = asymptotic mass (g), K = growth rate constant (1/day),
I = the inflection point of the growth curve (days), and t = nestling age (days). To remove the possibility that growth curves were influenced by differences in timing of hatching created by the experimental manipulation, I estimated growth curves based on the chronological age (i.e. time since hatching in days) of each nestling. I used a nonlinear (logistic) mixed effects model that controlled for 1) the non-independence of nests from the same female, 2) nestlings within the same nest and 3) repeated measurements of individual nestlings by including nestling identity nested within clutch nested within female as a random intercept. I included random intercepts only for A and I because the model that included random intercepts for all three growth parameters failed to converge on a solution. I used fixed effects to examine whether treatment influenced each of the three Logistic growth parameters simultaneously (A, K and I), which is possible using a mixed modeling framework (Sofaer et al. 2013). Because variance in nestling mass often increases across the nestling period, I relaxed the normal distribution assumption and allowed the variance to change as a function of 1) a fixed proportionality constant on age, 2) an estimated power of age, 3) a constant added to the estimated power of age, and 4) an exponential function of age. All of the models provided a better fit than using a fixed variance, but the best model contained a constant (1.404) added to the estimated power (0.700) of age.
A
To determine whether the experimental manipulation resulted in differences in offspring size or condition, I used a principal components analysis to collapse the six morphological measurements (both tarsi, both wings, head length and head width) into fewer linearly uncorrelated variables at each of two, six and ten days after the first egg hatched. Because size characteristics were measured during only three days of the nestling period, I examined treatment differences in size and condition for nestlings that hatched within 24h of the first-hatched egg. This approach removed the possibility that treatment differences in size and condition were influenced by differences in nestling age between experimental and control nests. The first principal component (PC1) explained most (> 79%) of the variation in the six size measures and all size variables had similar weights and were positive for all three measurement days (Table 3.1). Thus, PC1 appeared to reflect overall body size. I used PC1 to examine whether treatment
influenced nestling body size at each measurement day. I also extracted residuals from a linear regression between offspring size (PC1) and mass to estimate nestling body condition at two, six, and ten days after the first egg hatched. I used this condition index to determine whether treatment influenced nestling condition at each measurement day. Effects of experimental manipulation on within-nest variation in offspring mass, size and condition
intercept and brood as a random coefficient for nest age to examine whether age of the nest (in days), treatment, age2 and the interactions between age and treatment and age2 and treatment influenced the within-nest variation in offspring mass over the course of post-hatching development. Because the variance associated with the standard deviation estimates increased across the nestling period, I relaxed the normal distribution
assumption and allowed the variance to change as a function of 1) a fixed proportionality constant on age, 2) an estimated power of age, 3) a constant added to the estimated power of age, and 4) an exponential function of age. All of the models provided a better fit than using a fixed variance, but the best model contained an estimated power (0.603) of age.
I also determined whether the experimental manipulation influenced the within-nest variation in offspring size and condition. For these analyses, within-nestlings that hatched more than 24h after the first-hatched egg were included because I was interested in how the experimental manipulation influenced the within-nest variation in size and condition. I used a general linear model to examine whether treatment influenced the within-nest variation in offspring size at each of two, six and ten days after the first egg hatched. I also used a general linear model to examine whether treatment influenced the within-nest variation in offspring condition at each of two, six and ten days after the first egg
hatched.
In order to measure the within-nest variation in mass irrespective of
quadratic regression with brood nested within female as a random intercept and brood as a random coefficient for nest age to examine whether age of the nest (in days), treatment, age2 and the interactions between age and treatment and age2 and treatment influenced the coefficient of variation in mass over the course of post-hatching development. I also used general linear models to examine whether treatment influenced the within-nest coefficient of variation in offspring 1) size and 2) condition at each of two, six and ten days after the first egg hatched.
To examine possible reasons for treatment differences in the within-nest variation and coefficient of variation in mass at hatch completion, I examined whether treatment influenced patterns of hatching asynchrony and also whether treatment and hatching asynchrony influenced a nestling's relative mass at hatch completion. To determine whether the experimental manipulation influenced patterns of hatching asynchrony, I used a linear mixed effects model with clutch nested within female as a random intercept and clutch as a random coefficient for laying order to examine whether laying order, treatment, laying order2, and the interactions between laying order and treatment and laying order2 and treatment influenced the delay in hatching (in hours) from the first-hatched egg (hereafter referred to as hatching delay). I included laying order2 in this analysis because the relationship between laying order and hatching delay appeared to be non-linear. To determine whether the experimental manipulation influenced the relative mass of nestlings within a clutch, I used a generalized estimating equation with a quasi-Poisson error distribution and clutch as a random intercept to determine whether
and whether the relationship between hatching asynchrony and a nestling's relative mass at hatch completion was influenced by the experimental manipulation, I used a
generalized estimating equation with a quasi-Poisson error distribution and clutch as a random intercept to determine whether hatching delay, treatment or their interaction influenced a nestling's relative mass at hatch completion. Finally, I used a general linear model to examine whether the within-nest variation and coefficient of variation in mass at hatch completion was influenced by the relative mass of the last-hatched young, treatment or their interaction.
Effects of relative offspring mass on post-hatching survival and growth
I used a generalized linear mixed effects model with a binomial error distribution and clutch nested within female as a random intercept and clutch as a random coefficient for the mass difference at hatch completion to examine whether a nestling's relative mass at hatch completion, clutch size, treatment or their interactions influenced the probability that a nestling survived to fledge.
![Figure 2.3: Linear growth rates at four different growth phases [Early, Peak, Late, and asymptotic (Asym)] for optimal (Optimal; circle, solid line), delayed (Delay; triangle, dashed line) and slow growers (Slow; square, dot-dash line)](https://thumb-us.123doks.com/thumbv2/123dok_us/8327675.2208436/49.918.143.776.112.432/figure-linear-different-asymptotic-optimal-optimal-triangle-growers.webp)