VARIATION OF SR AND PB ISOTOPES IN MEGACRYSTIC K-FELDSPAR FROM THE CATHEDRAL PEAK GRANODIORITE, CALIFORNIA
Jonathan Keith Munnikhuis
A thesis submitted to the faculty at the University of North Carolina at Chapel Hill in partial fulfillment of the requirements for the degree of Masters of Science in the Department of
Geological Sciences.
Chapel Hill 2016
© 2016
ABSTRACT
Jonathan Keith Munnikhuis: Variation of Sr and Pb isotopes in megacrystic K-Feldspar from the Cathedral Peak Granodiorite, California
(Under the direction of Allen F. Glazner)
ACKNOWLEDGEMENTS
I would like to thank Dr. Allen Glazner, Dr. Drew Coleman, and Dr. Ryan Mills for their academic support, teaching the importance of skepticism, and sharing their valuable knowledge and experience of the Sierra Nevadas. I would like to thank several graduate students; Ryan Frazer, Connor Lawrence, Jesse Hill, and Tyler Wickland. Ryan and Connor assisted and helped teach me methods of isotope geochemistry at UNC, Jesse helped with code development, and Tyler Wickland and I shared several cups of coffee with discussions about thermal cycling. I would also like to thank Christopher Doorn whose assistance and attitude during field-work was invaluable.
Funding for this thesis was provided by the Martin Research Fund (University of North Carolina), the Graduate Student Research Grant (Geological Society of America), and the Graduate Student Bursary (Mineralogical Society of Great Britain).
TABLE OF CONTENTS
LIST OF TABLES ... vii
LIST OF FIGURES ... viii
LIST OF ABBREVIATIONS ... ix
INTRODUCTION ... 1
Geologic Setting ... 2
METHODS ... 8
Sampling Strategy ... 8
Micromilling ... 10
Isotope Geochemistry ... 12
Rb/Sr ... 12
U/Pb ... 12
Analysis ... 13
RESULTS ... 15
Field Relationships ... 15
Rb & Sr Trace Element Geochemistry ... 18
Daff Dome Rb & Sr Trace Element Geochemistry... 18
Tuolumne Falls Rb & Sr Trace Element Geochemistry ... 20
Steelhead Lake Rb & Sr Trace Element Geochemistry ... 22
Sr Isotopic Transects ... 24
Steelhead Lake megacryst initial Sr isotopic composition ... 26
U/Pb Trace Element Geochemistry and Pb Isotopic Compositions ... 27
JKCM3 U/Pb ratios and initial Pb isotopic composition ... 29
JKCM4 U/Pb ratios and initial Pb isotopic composition ... 29
JKCM5 U/Pb ratios and initial Pb isotopic composition ... 29
JTF2 U/Pb ratios and initial Pb isotopic composition ... 30
DISCUSSION ... 31
Isotopic Variation in the Megacrysts ... 31
Trace Element Variation in the Megacrysts ... 37
Contamination During Microsampling ... 37
Trace Element Modeling ... 40
Comparison of Data from Cathedral Peak Granodiorite Megacrysts with Megacrysts from Other Studies ...46
The Origin of K-Feldspar Megacrysts in the Cathedral Peak Granodiorite ... 46
CONCLUSIONS... 48
APPENDIX 1: TABLES OF GEOCHEMCIAL DATA ... 49
APPENDIX 2: SCAN OF K-FELDSPAR SAMPLES AND CORRESPONDING DATA PLOTTED AGAINST TRAVERSE LENGTH ... 54
APPENDIX 3: ESTIMATION OF ERRORS IN MEASURED AND INITIAL ISOTOPIC RATIOS ... 57
Measured and Initial Pb Isotopic Ratios ... 57
Sr Isotopic Data Reduction and Estimation of Uncertainties ... 58
APPENDIX 4: DEVELOPED SOFTWARE... 61
Monte Carlo-ReduceR ... 61
RechargR – A Dynamic Crystallization Model ... 66
LIST OF TABLES
Table 1: Distribution coeffiecents and Weight Fractions of Minerals Used in Trace
Element Modeling ... 42 Table 2-2: Rb and Sr Trace Element and Isotopic Data ... 49
LIST OF FIGURES
Figure 1: Simplified geologic map of the Tuolumne Intrusive Suite and sample
locations. ... 3
Figure 2: Color cathodoluminescence image of K-feldspar megacryst. ... 6
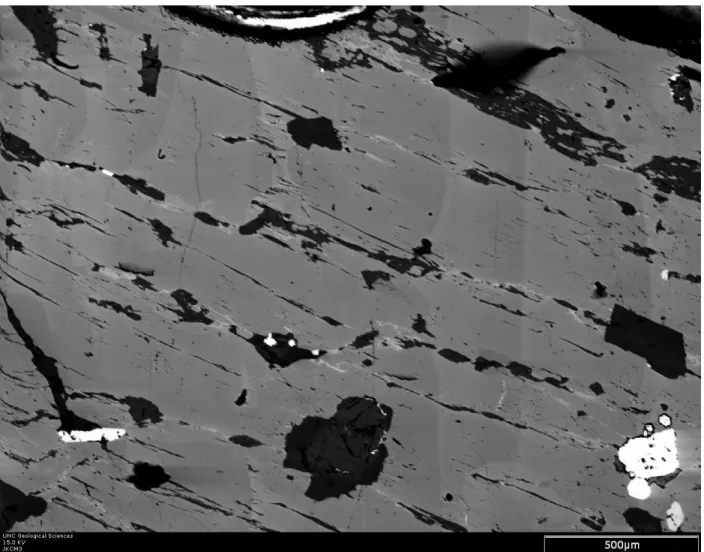
Figure 3: Backscattered electron image of K-feldspar megacryst ... 7
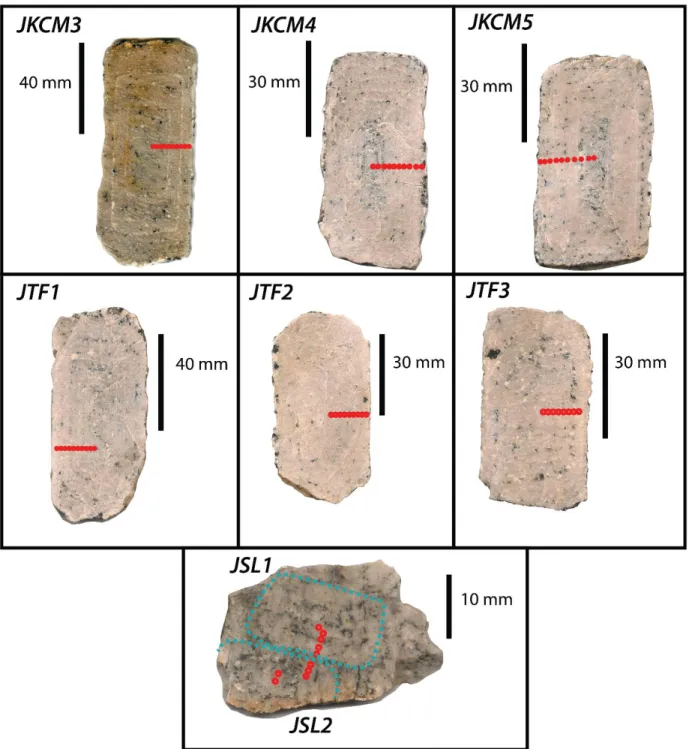
Figure 4: Scanned sections of K-feldspar megacryst samples ... 9
Figure 5: Detailed scan of K-feldspar megacryst and micromill locations. ... 11
Figure 6: Field photographs of K-feldspar megacrysts in different textrual settings ... 16
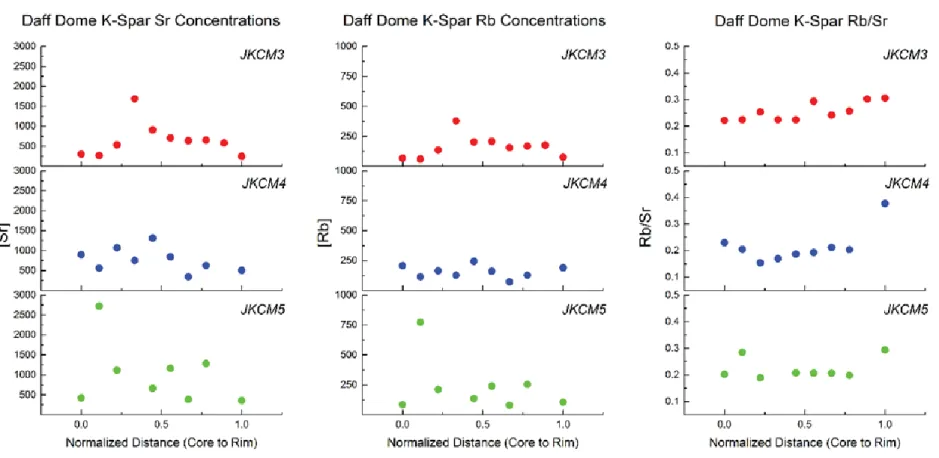
Figure 7: Daff Dome sample group’s Rb, Sr concentrations and Rb/Sr ratios plotted against normalized distance from core. ... 19
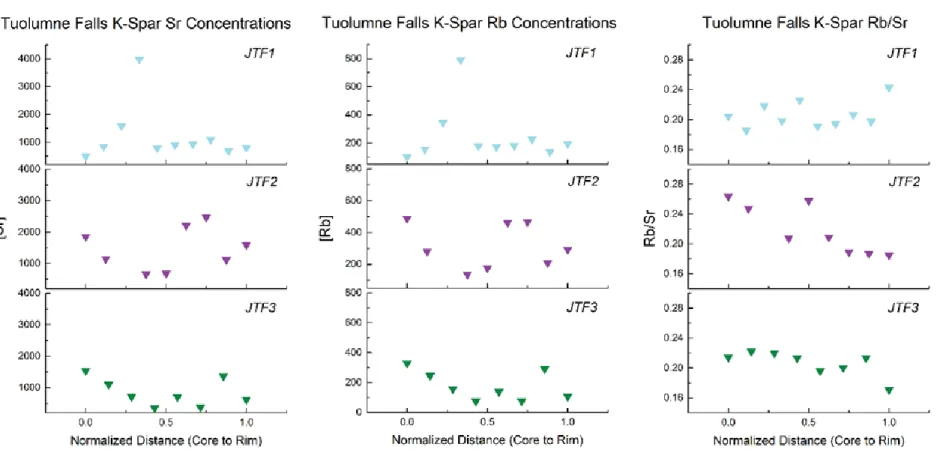
Figure 8: Tuolumne Falls sample group’s Rb, Sr concentrations and Rb/Sr ratios plotted against normalized distance from core. ... 21
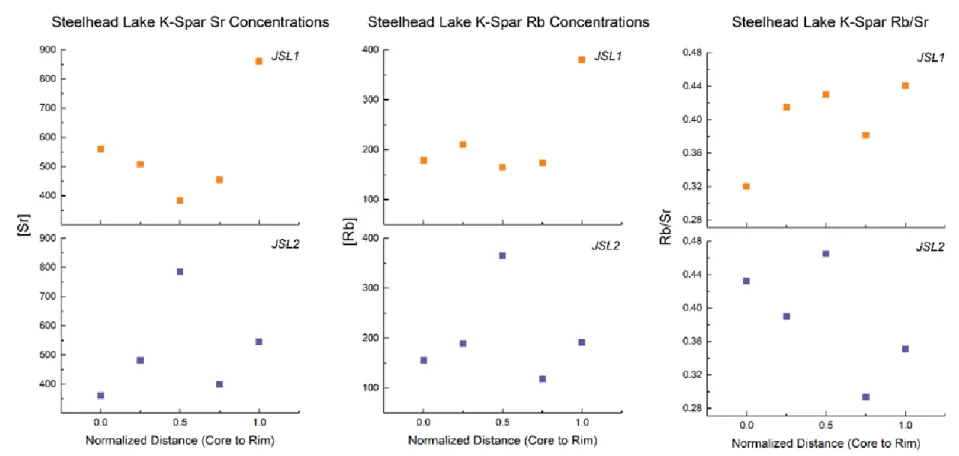
Figure 9: Steelhead Lake sample group’s Rb, Sr concentrations and Rb/Sr ratios plotted against normalized distance from core. ... 23
Figure 10: Differences in initial Sr isotopic composition based crystallization age ... 24
Figure 11: Initial Sr isotopic compositions of K-feldspar megacrysts ... 25
Figure 12: U/Pb ratios and initial Pb isotopic compositions of K-feldspar megacrysts... 28
Figure 13: Absolute differences between isotopic compositions along transects relative to isotopic compositions in the grain core ... 32
Figure 14: Kernel density estimations (KDE) of Sr(i) of K-feldspar megacrysts and granodiorites of the TIS.. ... 34
Figure 15: Initial Sr plotted against initial Pb isotopic ratios of the feldspars and Toulumne Intrusive Suite whole-rock values. ... 36
Figure 16: Two-component mixing plots between K-feldspar and biotite and plagioclase. ... 39
Figure 17: Predicted trace element profiles of K-feldspar in traditional crystallization regimes. ... 44
LIST OF ABBREVIATIONS
a annum
A Ampere
An anorthite
amu atomic mass unit
C0 weight concentration element in unmelted solid
CA California
Cl weight concentration element in a liquid Di bulk distribution coefficient of element i F fraction of melt remaining in fractional
crystallization
f fraction of melt returned to magma chamber
EPMA electron probe micro analysis
h hour
g gram
ka thousands of years/ thousands of years before present
Kd distribution coefficient
Kcp Cathedral Peak Granodiorite
Khde equigranular Half Dome Granodiorite
Khdp Half Dome Granodiorite porphyritic member
Kw Whitney Granodiorite
KDE Kernel density estimation
M molar
m meter
mm millimeter
mg milligram
µm micrometer
μL microliter
Ma millions of years/ millions of years before present
MWIS Mount Whitney Intrusive Suite
Or Orthoclase
ppm parts per million
s second
SNB Sierra Nevada batholith
Sr(i) initial 87Sr/86Sr composition
TIMS thermal ionization mass spectrometer / spectrometry
TIS Tuolumne Intrusive Suite
wt% weight percent
INTRODUCTION
The development of K-feldspar megacrysts in granitoids is important to understanding plutonic and tectonic histories, yet their origin is still debated. Classically, these crystals have been thought to nucleate early in a large magma chamber with a high melt fraction (Vernon, 1986; Vernon and Paterson, 2008; Moore and Sisson, 2008), developing observed megacrystic textures in granitoids through flow sorting (Paterson et al., 2005; Barboni and Schoene, 2014). An alternative hypothesis is that megacrystic textures develop during protracted, late-stage cooling with small magma increments providing thermal oscillations that drive coarsening (Higgins, 1999; Johnson and Glazner, 2010; Glazner and Johnson, 2013). Theory (Simakin and Bindeman, 2008) and experiments (Mills et al., 2011; Mills and Glazner, 2013) demonstrate that thermal cycling can lead to dissolution-reprecipitation which coarsens crystals via cannibalism of smaller crystals by larger crystals. These thermal variations have been suggested as the
mechanism leading to crystal coarsening and megacrystic textures in granitoids (Johnson and Glazner, 2010).
(Gagnevin et al., 2005b), study terrane correlations (Connelly and Thrane, 2005), and provide data for provenance studies (Tyrrell et al., 2006).
I analyzed Rb, Sr, Pb, and U concentrations and isotopes by thermal ionization mass spectrometry (TIMS) from core-to-rim using micromill techniques. The K-feldspar megacrysts were collected from zoned intrusive suites of the Sierra Nevada batholith (SNB) of California. K-feldspar in the granites and granodiorites of the Tuolumne Intrusive Suite (TIS) has high concentrations of Sr and Pb. Whole-rock Sr and Pb isotopic variability in the TIS is well documented (Kistler et al., 1986; Gray et al., 2008; Burgess and Miller, 2008). Comparing and contrasting the whole-rock isotopic data with microsampled, K-feldspar isotopic data provides information on the state of the magma system during K-feldspar crystallization and ultimately aids in understanding the textural coarsening process.
Geologic Setting
Due to the excellent exposure after Pleistocene glaciation, the TIS (Bateman, 1992) has been the subject of many geochronological (Coleman and Glazner, 1997; Glazner et al., 2004; Memeti et al., 2010), geochemical (Bateman and Chappell, 1979; Kistler et al., 1986; Gray et al., 2008; Burgess and Miller, 2008; Mills et al., 2009; Coleman et al., 2012) and petrological studies (Kerrick, 1969; Higgins, 1999; Paterson et al., 2005; Johnson and Glazner, 2010; Glazner and Johnson, 2013; Bauer, 2015).
(Bateman, 1992; Coleman et al., 2012). The TIS displays variation in U-Pb zircon ages of ~ 8 Ma; ages monotonically decrease from 93.5±1 Ma in the Kuna Crest to 85.4±.01 Ma in the Johnson Granite Porphyry (Coleman et al., 2004; Memeti et al., 2010).
Figure 1: Simplified geologic map of the TIS (after Huber et al., 1989). Inset shows detail of TIS and
The Cathedral Peak Granodiorite (Kcp) is the largest mapped intrusive unit in the TIS and its modal composition plots in the granite to granodiorite fields (Bateman and Chappell, 1979; Bateman, 1992). The major identifying feature of Kcp is its abundance of K-feldspar megacrysts (megacrysts are defined in this study as crystals with maximum dimension >5 cm). The megacrysts are hosted in a medium to coarse-grained matrix of oligoclase, quartz, biotite, and hornblende. The Half Dome Granodiorite consists of two facies, the equigranular member (Khd) and the porphyritic member (Khdp). The major identifying feature of Khd is its large euhedral hornblende and titanite phenocrysts. Khd granular groundmass consists of plagioclase, biotite, quartz, magnetite and apatite. Khdp contains similar modal compositions of minerals and the porphyry is defined by its abundance of K-feldspar phenocrysts.
K-feldspar megacrysts in Kcp are pink to white and range from 5 – 20 cm in longest dimension, with the largest crystals occurring near the contacts of Kcp and Khdp (Johnson and Glazner, 2010). The megacrysts are potassic (Or85-95) (Kerrick, 1969; Johnson and Glazner,
2010) and color cathodoluminescence (Fig. 2) and backscattered electron (BSE) images (Fig. 3) show minor perthite texture within the crystals. BSE images also highlight the variability in Ba concentrations (Moore and Sisson, 2008; Johnson and Glazner, 2010).
6
Figure 2: Color cathodoluminescence image of K-feldspar megacryst JKCM3. Image highlights perthite texture in the megacrysts and abundant
Figure 3: Backscattered electron image of megacrysts JKCM3. Gray-scale brightness is positively
METHODS
Sampling Strategy
Seven K-feldspar megacrysts from Kcp were selected for this study. Megacryst samples were collected from two localities on the western side of the TIS and one locality near the eastern margin where Kcp is in contact with Jurassic metavolcanic rocks (Fig. 1). Sample JKW is the only sample collected outside of the TIS and data for it are presented in the appendix. Megacrysts were collected from outcrops where preferential weathering of biotite grains surrounding the megacrysts allowed for easy extraction from the outcrop with a chisel and hammer.
JKCM samples are from the Daff Dome area in the central portion of Kcp, where the contact with Khd is ~2 km to the north and Khdp ~4 km to the west (Fig. 1). JTF samples are from the Tuolumne Falls area; the closest contact is Khd rather than Khdp, which is not the typical gradation in the TIS. JSL samples were collected from a locality, near Steelhead Lake where Kcp is in contact with Jurassic metavolcanic rocks. These samples were collected in order to compare geochemistry between adjacent megacrysts and if proximity to the wall rocks
Figure 4: Sections of K-feldspar megacrysts samples in this study. All samples come from the Kcp of the TIS. Red circles indicate micromill drill positions. Blue dotted lines outline
Micromilling
All samples, except the Steelhead Lake samples, were cut through their centers to (010), polished to 800 μm, and microdrilled on a Leica Merchantek GZ6 Micromill. Samples from the Steelhead Lake group come from a feldspar mosaic, and were cut so that grain boundaries of megacrysts were exposed. Afterwards a cut was made through the mosaic as close as possible to parallel (010) planes of the two adjacent feldspars.
Figure 5: a) K-feldspar megacryst from Kcp. Feldspar displays concentric bands of plagioclase and
Isotope Geochemistry
Rb/Sr
Microsampled material was dissolved using a mixture of approximately 50 μL of 29 M HF and 1000 μL of 8M HNO3. Samples were spiked with a mixed 87Rb–84Sr Spike (UNC B-3,
0.9606 ppm 87Rb: 0.1445 ppm 84Sr), spike weights varied near 0.03 ± 0.01 g. After 24 h of dissolution at 170 °C samples were evaporated to dryness and approximately 500 μL of 7 M HNO3 was added to ensure conversion of fluorides to nitrates. After an additional 24 h on a
hotplate at 170 °C, the samples were evaporated to dryness again to be dissolved in 550 μL of 3.5 M HNO3 as a loading solution for cation chemistry.
The sample solution was passed through microcolumns containing Eichrom SR-B100-S® Sr Resin. Strontium was set on the column by passing 500 µL of solution through the column. Afterward the 1.49 mL of Rb-effluent HNO3 was collected in separate Savillex Teflon® beakers
and set aside. Next 1 mL of DirectQ water was used to elute the Sr from the resin. 1 drop (~30 μL) of H3PO4 was added to prevent complete evaporation before being dried down to a small
bead on a hot plate at 110 °C for 4 – 6 h.
Rubidium fractions were dried down on a hotplate and converted to chlorides by adding ~500 µL of 2 M HCL. The solution was loaded into the Dowex AG50 WX8® (50 – 100 mesh) cation columns with 5.75 mL of 2M HCl. Another 1.5 mL of 2M HCl of eluted material was collected and dried down in another Savillex Teflon® beaker.
U/Pb
Sampled material was dissolved in the same manner as Sr procedure (50 μL of 29 M HF and 1000 μL of 8M HNO3.) Before dissolution approximately 0.04 g of the mixed 205Pb-233 U-236U GS-1 spike was added to the samples. After 24 h of dissolution at 170 °C, samples were
After an additional 24 h on a hot plate at 170 °C, samples were evaporated to dryness again and converted to bromides by the addition of 550 μL of 0.5 M HBr.
Approximately 1 mL of 0.5 M HBr was used to set the samples onto the Eichrom AG-1X8® anion resin. Uranium was eluted with 240 μL of 2 M HCl and stored in separate beakers. The addition of approximately 1.44 mL of 6 M HCl was required for the elution of Pb, one drop of H3PO4 was added before drying Pb fraction on a hot plate.
The U fraction was dried down and redissolved with ~150 μL of 6 M HCl. The sample was loaded on to the same AG-1X8 resin and after setting with 1.2 mL of 6 M HCl the U was eluted from the resin with an addition of 1 mL of water. One drop of H3PO4 was added before
drying down to a small ~1 μL bead. Analysis
Strontium samples were mixed with 2 µL of HCl and 2 µL of Ta oxide emitter solution (TaF5) before being loaded on a Re filament. Rubidium samples were hydrated with 2 µL of
water and loaded in 1 µl loads onto a Re filament, taken to a current of ~1 A and allowed to dry flat. Boise State University-Ta Gel mixed with 1M H3PO4 in a 2:1 ratio was mixed beforehand
and 3 μL was the current was increased at approximately 0.1 A per 10 s increments until a current of 2.5 A was reached and the bead was flat. Uranium and Pb samples were loaded directly onto Re filaments with 3 μL of silica-gel and heated until flat on the filament.
A VG Sector 54 thermal ionization mass spectrometer (TIMS) was used to determine the isotopic composition of each separate. Rubidium isotopic analysis were conducted in the static collection mode using Faraday detectors. Strontium analyses used a 3 multidynamic analysis.
Rubidium abundances in samples were calculated from the 85Rb/87Rb ratios, using the
measurements of NBS 727 in the UNC TIMS laboratory yields a Rb fractionation correction of ±0.30823% per amu.
Uranium was measured on the Daly detector for 233U/235U and 238U/233U. Lead analysis utilized the Daly detector (205Pb) and a Faraday detector (206Pb) to measure 205Pb/206Pb ratios. A second analysis using only Faraday detectors provided 206Pb/204Pb and 207Pb/204Pb ratios.
Because a Th spike was not employed, 208Pb was not measured because it could not be age-corrected. Long-term measurements of NBS 981 in the UNC TIMS laboratory were used to determine a fractionation correction of 0.12 ± 0.06% per amu for all Pb analyses.
RESULTS
This study yielded the first isotopic and trace element profiling of K-feldspar megacrysts from the SNB. Sixty-six individual Sr isotopic analyses (Table 2-1) and 36 Pb isotopic analyses (Table 2-2) are presented from seven megacrysts collected from Kcp. Ten Sr isotopic analysis are presented in the appendix for one micromilled transect completed on a megacryst from the Whitney Granodiorite of the Mount Whitney Intrusive Series.
Field Relationships
Megacryst ranging from 5 – 15 cm long are common in Kcp (Fig. 6a). Locally they are scattered throughout the unit with sizes varying from megacrystic to the size of the surrounding groundmass (1 – 4 cm) (Fig. 6b). The largest megacrysts, up to ~20 cm in length, occur near the contact between Kcp and Khdp (Johnson and Glazner, 2010).
Commonly K-Feldspar megacrysts occur in dense concentrations with greater than 80% K-feldspar (Fig. 6c, 6d, 6f, 6g). These dense concentrations, hereafter referred to as mosaics (Glazner and Johnson, 2013), are scattered throughout Kcp in patches a meter or two across. Mosaics with megacrysts over 10 cm in length occur in the Tuolumne Falls area (Fig 6d). These mosaics also occur in tabular concentrations which can reach 1 m in width and 15 m in length (Fig 6f). In some instances, high concentrations of megacrysts are bounded by rinds of biotite and hornblende, which separate the mosaics from normal megacrystic host rock.
irregular contact with the wall rock (Fig. 6g), and multiple megacrysts indent the contact, up to 5 cm in the wall rock (Fig. 6h).
Figure 6: Photographs of megacrysts from Kcp in different textural settings. a) Megacrysts showing
Figure 6 continued: e) K-feldspar mosaic in contact with Jurassic metavolcanic wall rock. f) K-feldspar
Rb & Sr Trace Element Geochemistry
Strontium concentrations in megacrysts range from ~300 – 4000 ppm and Rb
concentrations in megacrysts range from ~60 – 800 ppm (Table 2-1) and Rb/Sr ratios of s range from 0.14 to 0.46. There is no overall core-to-rim trend in Rb/Sr values, which scatter about a mean value of 0.22.
Daff Dome Rb & Sr Trace Element Geochemistry
19
Tuolumne Falls Rb & Sr Trace Element Geochemistry
21
Steelhead Lake Rb & Sr Trace Element Geochemistry
Both JSL1 and JSL2 are nearly 5 cm in length and have much higher abundances of mineral inclusions than other samples from this study. To avoid contamination from the high abundance of mineral inclusions in these megacrysts, milled transects were not set in a
23
Sr Isotopic Transects
87Sr/86Sr
(i) was calculated using the youngest recorded zircon age of Kcp at 88.1 Ma
(Table 2-1; Coleman et al., 2004). In order to quantify the impact of age correction on the isotopic compositions, Sr isotopes were corrected to three different ages ranging in total 8 Ma. CalculatedSr(i) values change less than 0.000025 over an 8 Ma age range (Fig. 10), which is
much less than the calculated analytical uncertainty in each of the analyses (see appendix for methods of uncertainty calculation). Thus, age assumptions do not impact the interpretation of initial Sr isotopic compositions.
Figure 10: Different Sr isotopic composition based on different assumed crystallization ages (84.1 Ma,
88.1 Ma, 92.1 Ma). Difference in Sr isotopic compositions are less than 0.000025 between samples corrected at 84.1 Ma and 92 Ma.
25
Figure 11: Initial Sr isotopic compositions of samples along their normalized distances from core-to-rim. Error bars indicate calculated 2σ
Daff Dome megacryst initial Sr isotopic composition
Samples from the Daff Dome sample suite have little variation in Sr(i) from core-to-rim.
More abundant and larger magnitude excursions occur in JKCM3 than other JKCM samples; the largest negative excursion occurring 8 mm away from the rim, or approximately 2/3 of the distance across the crystal. JKCM4 and JKCM5 isotopic values from the transect closely parallel each other, with small increases and decreases in Sr(i) occurring near the core before becoming
less radiogenic near the rim. All analyses at the rims for the samples of the Daff Dome suite are within analytical uncertainty at a value of ~0.70636 (Fig. 11).
Tuolumne Falls megacryst initial Sr isotopic composition
Samples from the Tuolumne Falls area contain generally more restricted values for initial Sr isotopic compositions than megacrysts from other sample locations. Samples JTF1 and JTF2 have excursions in Sr(i) of 0.0005 or greater occurring in the middle of the transects. Otherwise,
Sr(i) compositions across the crystals are relatively flat compared to other sample suites. JTF1 is
the only sample in which the rim values are significantly different than its core (> 0.0002) (Fig. 11).
Steelhead Lake megacryst initial Sr isotopic composition
Samples from the Steelhead Lake area are more radiogenic than the rest of the sample set from the TIS. The transect across each crystal shows the greatest variability in Sr(i) in this study.
The isotopic profile across each of these crystals show a scatter around the mean of values of the transects. Core (< 50% of transect) values of Sr(i) each average near 0.70644, and each crystal
U/Pb Trace Element Geochemistry and Pb Isotopic Compositions
Four megacrysts were analyzed for Pb isotopic compositions, leading to thirty-six analyses (Table 2-2). Uranium concentrations in megacrysts range from ~0.005 – 2.5 ppm, Pb concentrations range from ~0.75 – 64.5 ppm, and U/Pb ratios are ~0.0005 – 0.08. Initial Pb isotopic compositions range from 18.78 – 18.99 for 206Pb/204Pb(i) and 0.825 – 0.835 for 207Pb/206Pb
(i). The Pb isotopic compositions of megacrysts are similar to previously published
28
Figure 12: U/Pb ratios, 206Pb/204Pb(i), 207Pb/206Pb(i) compositions of megacrysts. Transect distances of each crystal are normalized and referenced
JKCM3 U/Pb ratios and initial Pb isotopic composition
The U/Pb ratios in sample JKCM3 vary from 0.0016 to 0.02. The largest U/Pb ratio occurs at the rim. Excluding the rim analysis, the U/Pb ratios are fairly homogenous and low compared with other megacrysts. 206Pb/204Pb(i) values range from 18.41 to 18.99, 207Pb/206Pb(i)
values range between 0.825 and 0.831. The largest excursion from the mean 206Pb/204Pb(i) and 207Pb/204Pb
(i) values occur near the center of the transect (Fig. 12). The rim analysis has a 206Pb/204Pb
(i) value of 18.86 and 207Pb/206Pb(i) value of 0.831, which is significantly different than
analyses at the core.
JKCM4 U/Pb ratios and initial Pb isotopic composition
The U/Pb ratios in sample JKCM4 range from 0.0004 and 0.07 and the minima and maxima occur in analyses that are adjacent to each other along the transect. JKCM4’s
206Pb/204Pb
(i) values range from 18.82 to 18.93, with the highest value being 4 mm from the
center of the core and the lowest value at 8 mm away from the core. 207Pb/206Pb
(i) values range
between 0.827 and 0.832. In this sample the highest 206Pb/204Pb(i) value corresponds to the largest
U/Pb ratio in the sample (0.07). Analyses near the rim (16 mm – 23.5 mm) average 206Pb/204Pb(i)
composition is 18.89, which is slightly higher than average values at the interior of the crystal (Fig. 12).
JKCM5 U/Pb ratios and initial Pb isotopic composition
The U/Pb ratios in sample JKCM5 are variable between 0.002 and 0.08. 206Pb/204Pb(i)
isotopic compositions range from 18.79 to 18.95, 207Pb/206Pb(i) values range between 0.830 and
0.833. Only one large excursion occurs in 206Pb/204Pb(i) near the core of the crystal with the
maximum value of 18.95. 207Pb/206Pb(i) values are fairly homogenous compared with other
JTF2 U/Pb ratios and initial Pb isotopic composition
The U/Pb values range from 0.0015 to 0.032, and show a slight increase in the first 4 mm of the transect; the remainder of U/Pb ratios along the transect show little variability from the mean value of the transect. 206Pb/204Pb(i) values range from 18.79 to 18.95, 207Pb/206Pb(i) values
range from 0.827 to 0.835. 206Pb/204Pb(i) increases and 207Pb/206Pb(i) decreases near the core of the
megacryst, with the largest excursions of each ratio occurring near the center of the transect (Fig. 12). Rim values of 206Pb/204Pb
(i) show little variation from the core, whereas 207Pb/206Pb(i) rim
DISCUSSION
Microsamples of megacrysts were analyzed for trace element and isotopic compositions in order to assess their origin in the TIS. If crystals nucleated and grew in a closed environment with a high-melt fraction, then microsamples should be isotopically homogeneous from core-to-rim. Alternatively, if magma mixing or mingling occurred the megacrysts could have recorded isotopic and compositional variations. If the K-feldspars formed from late stage coarsening, in a low-melt fraction, then their trace element and isotopic signatures should record the composition of the local, cannibalized material. In order to evaluate these hypotheses, it is necessary to describe and account for the isotopic and trace element profiles. Moreover, it is important to establish whether the analyses are primary feldspar values and do not represent contamination by inclusions or some other artifact that occludes a primary feldspar signature.
Isotopic Variation in the Megacrysts
Crystal transects from this study show little variation relative to the values recorded in the cores (Fig. 13). The variation in each transect in Sr(i) relative to the core analysis typically falls
below 0.0002 (Fig. 13a). Differences in Pb isotopic compositions are similarly small with
207Pb/206Pb
Figure 13: Absolute differences between isotopic compositions along transects relative to isotopic
compositions in the grain core. Values are plotted along normalized distances of the crystals length from core (0)-to-rim (1). a) Differences between initial Sr isotopic compositions. Most differences between analyses from core value fall under 0.0002. Rim analyses of JSL1 (0.7) and JSL2 (1.0) have the greatest differences relative to their cores. b) Differences of 207Pb/206Pb(i) relative to core values. Most differences
Isotopic compositions of K-feldspar megacrysts are more restricted than whole-rock compositions from the TIS. Kernel density estimations of Sr(i) values were plotted against
compiled whole-rock values (Kistler et al., 1986; Gray, 2003; Burgess and Miller, 2008) to compare the isotopic variabilities (Fig. 14). K-feldspar megacryst mean Sr(i) is 0.7064, similar to
mean Sr(i) of Kcp and Khdp. Initial Srisotopic compositions of Khd have much higher variance
and a distinctly different mean Sr(i) at 0.7062. Whole-rock data from the TIS span a large range
in Sr and Pb isotopic compositions (~0.705 – 0.707 in Sr(i), ~18.3 – 19.2 in 206Pb/204Pb(i), ~0.81 –
0.83 in 207Pb/206Pb(i)), but Kcp and Khd have a much smaller range in Sr(i), 0.7058 to 0.7066.
Figure 14: Kernel density estimations (KDE) of Sr(i) of K-feldspar megacrysts and granodiorites of the
TIS. The mean of the units of these compiled data are 0.70643 for megacrysts (n=63), 0.70641 for Kcp (n=32), 0.70640 for Khdp (n=17), and 0.70622 for Khd (n=33). Although the megacryst data fall into a sharp peak, there is some scatter which leads to a larger base than Kcp. Whole-rock data compiled from Kistler et al. (1986), Gray, (2003) and Burgess and Miller (2008). Data for units’ age corrected for youngest recorded zircon ages. The uncertainty in the age of the whole-rock samples produces
uncertainty in the calculated 87Sr/86Sr(i) values. However, for interpretations here the uncertainty in the
isotopic composition related to age uncertainty is negligible. For example, an age uncertainty of 4 Ma yields 87Sr/86Sr(i) variations less than 1 x 10⁻⁴ for the whole-rock data.
Gross, 2015; Doorn, 2016). Although this process seems unlikely in K-feldspar since Sr concentrations and isotopic retention would occur in all but the most extreme thermal events (Cherniak and Watson, 1992). Moreover, the comparable low variation in Pb isotopes reinforces the idea that Sr(i) is a primary signal, and geochemical compositions were not reset through
alteration or diffusion of Sr. The limited variability in Sr(i) among individual megacrysts and the
similarity of these values to the isotopic compositions of Kcp and Khdp suggest that megacryst Sr(i) isotopic compositions were acquired through crystallizing from a magma of Kcp or Khdp,
36
Figure 15: Initial Sr plotted against initial Pb isotopic ratios of the feldspars. Whole-rock data plotted as grey squares from Gray (2003). Kcp
samples plotted as blue squares. Daff dome samples plotted as colored circles. JTF2 plotted as purple triangles. a) 87Sr/86Sr(i) vs 206Pb/204Pb(i) b) 87Sr/86Sr
(i) vs 207Pb/206Pb(i). Kernel density estimations (KDE) are plotted along their respective axes. Red lines indicate KDE for megacrysts, grey
Trace Element Variation in the Megacrysts
The trace element stratigraphy of megacrysts show scattered variability around a mean from core-to-rim. How this variability developed is important in understanding the crystallization settings in which the megacrysts grew. Although the trace element variations are small,
interpretations from their radiogenic isotopes are crucial to this study. Therefore, it is important to address weather these heterogeneities are in fact primary signals recorded by the megacrysts, or an artifact of methodology.
Contamination During Microsampling
An unavoidable uncertainty in microsampling is that mineral inclusions below the surface of K-feldspar megacrysts were sampled. The most common inclusions in the megacrysts are biotite and plagioclase. Due to the low modal abundance of these inclusions in the megacrysts, the fact that the inclusions tend to be concentrated in narrow bands within the megacrysts (Fig. 4, 5, 6), careful placement of drill holes, it is unlikely significant phases other than K-feldspar were sampled. The isotopic compositions of these phases were not independently measured. However, the limited isotopic variability of the data suggests that, if biotite and plagioclase contaminated the analyses, they were isotopically similar to the host megacrysts. Otherwise, it would be fortuitous that random contamination of isotopically variable phases would yield such
homogeneous results. It is, however, possible to evaluate potential contamination by examining trace element ratio (Rb/Sr) variations along the transects.
39
Figure 16: Two-component mixing plots between K-feldspar and biotite (a) and plagioclase (b). Red lines indicate ranges for data of K-feldspar
Trace Element Modeling
Several crystallization models were tested to evaluate their predicted impact on trace element profiles. Three variations of crystallization were modeled: equilibrium crystallization (Eq.3), Rayleigh fractionation (Eq.4), and insitu crystallization (Eq. 5). Trace element concentration profiles were calculated for K-feldspar crystallizing in each of these regimes.
The Nernst distribution coefficient (Kd) describes the equilibrium distribution of a trace element between a mineral and melt and is defined by:
𝐾𝑑𝑖 = 𝐶𝑒𝑙𝑒𝑚𝑒𝑛𝑡 𝑖
𝑚𝑖𝑛𝑒𝑟𝑎𝑙
𝐶𝑒𝑙𝑒𝑚𝑒𝑛𝑡 𝑖𝑚𝑒𝑙𝑡 (1)
where C is the concentration of the trace element i in the mineral and melt. A bulk distribution coefficient (Di) can be calculated for any element according to mineral proportions by weight (xi)
in a melt through:
𝐷𝑖 = ∑ 𝑥𝑖𝐾𝑑𝑖
(2) Equilibrium crystallization is the processes where there is complete equilibrium between all solids and the melt during crystallization. Trace element concentrations for this model can be estimated by:
𝐶𝑅 𝐶0 =
𝐷
[𝐷 + 𝐹(1 − 𝐷)] (3)
where CR is the concentration of a trace element in the solid and C0is the concentration of a given trace element in the original melt.
𝐶𝑅
𝐶0 = 𝐷𝐹
(𝐷−1)
(4) In situ crystallization developed by Langmuir (1989) describes crystallization taking place on the cool exteriors of magma chambers and residual liquids reacting in situ with the crystal mush at the walls of a magma chamber. This is similar to Rayleigh fractionation but trace element distributions are dependent on the fraction of residual melt interacting with the
solidification zone. This model can be modeled as:
𝐶𝑅 𝐶0 = 𝐷𝐹
𝑓(𝐷−1) [𝐷(1−𝑓)+𝑓]⁄
(5) where f is the fraction of melt interacting with the solids near the edges of the magma chamber; the limiting case is when f = 1.0, which is Rayleigh fractionation. Modeling used values of f of 0.2, 0.5, and 0.8.
model the concentrations of each trace element across a transect of a feldspar the concentrations are represented with respect to the cubic root of the total mass of the feldspar crystal formed in each interval.
Table 1: Kds and modal percentages of minerals used in trace element modeling
Plagioclase K-feldspar Hornblende Biotite Quartz
Weight Fraction 0.17 0.69 0 0 0.13
KdSr 19.90 5.90 0.22 0.41 0.00
KdRb 0.13 1.80 0.01 3.20 0.00
KdPb 1.31 2.55 0.26 0.85 0.00
KdBa 1.52 11.45 0.04 23.53 0.00
Data sources: Arth and Barker, 1976; Nash and Crecraft, 1985.
Model results (Fig. 14) show simple equilibrium crystallization and fractional crystallization cannot produce the concentrations profiles of trace elements observed in
megacrysts (Fig. 7, 8, 9, 12). At low melt fractions, and high f values, the in situ model results are the closest to matching the actual ranges of concentrations observed in the megacrysts, but not their profile.
The recharge model was initialized with same parameters listed for F = 1 to 0.5. For melt fractions less than F = 0.5, a new recharge melt with different trace element concentrations is added to the system, and new concentrations in the mixed liquid are calculated before the next crystallization cycle. The recharged magma is modeled with aplite trace element compositions. Two types of aplitic liquids are modeled in the recharge scenario. The first contains trace-element concentrations of aplites from Kcp. Aplite data from the TIS are used because their mineral compositions and textures suggest late-stage melt extraction from a granitoid plutons (Glazner et al., 2008). The second modeled aplite composition is a hypothetical enriched endmember with high concentrations of Sr, Rb, Pb and Ba. Trace element concentrations in the residue, the remaining liquid, and the feldspar are numerically estimated by using bulk partition coefficients of a rhyolite (Table 1).
44
Figure 17: K-feldspar concentrations for Sr, Rb, and Pb were modeled under for three crystallization models a) equilibrium crystallization b)
Figure 18: Recharge model trace element profiles of Sr, Rb, Pb, and Ba in K-feldspar modeled with (a)
Comparison of Data from Cathedral Peak Granodiorite Megacrysts with Megacrysts from Other Studies
Isotopic and trace element heterogeneity recorded by single mineral grains have been attributed to magma mixing and mingling in other studies (Cox et al., 1996; Davidson and Tepley, 1997; Tepley et al., 1999; Słaby et al., 2007). Gagnevin et al. (2005a) analyzed initial Sr isotopic compositions of K-feldspar megacrysts from the Monte Capanne monzogranite (Elba, Italy). The Sr isotopic profiles of megacrysts recorded large differences between cores and rims, often up to ~0.005, in contrast to the total variation of 0.0015 and the more typical variation of only 0.0002 measured in this study. The Pb isotopic profiles of the same Elba crystals (Gagnevin et al., 2005b) also showed larger variations in 207Pb/206Pb(i) isotopic compositions than
megacrysts from Kcp. The heterogeneity of isotopic transects in megacrysts from Elba, and other locations (Cox et al., 1996; Waight et al., 2001) has led authors to invoke scenarios in which K-feldspars initially grew in a relatively silicic melt, acquiring radiogenic cores, and then through mafic recharge and magma mixing recorded less radiogenic rims.
Similar scenarios of K-feldspar growth in a magma chamber with a high melt fraction have been used in the Sierra Nevadan granodiorites (Vernon, 1986; Vernon and Paterson, 2008). However, because the isotopic transects of megacrysts from Kcp show little variability, a
recharge model seems unlikely and a different model for their origin is required.
The Origin of K-Feldspar Megacrysts in the Cathedral Peak Granodiorite
in a magma chamber with a high melt fraction, or coarsen through the injection of additional material into the system.
Predicted profiles from trace element modeling suggests that recharge from an
isotopically similar, yet trace element enriched aplite could have created the slight fluctuations in Rb, Sr , and Pb concentrations, and saw-tooth zoning patterns observed in Ba (Kerrick, 1969; Słaby et al., 2007; Moore and Sisson, 2008). This is consistent with a model that calls on minor, late melt retention in a diachronous and inward-moving melt zone during protracted
accumulation of the TIS (Johnson and Glazner, 2010; Glazner and Johnson, 2013).
The existence of both small interstitial K-feldspar and megacrystic K-feldspar can be achieved through crystal cannibalization if temperatures are buffered near the liquidus of K-feldspar (Higgins, 1999; Mills et al., 2011; Mills and Glazner, 2013). The trace element
stratigraphy in this study add to this interpretation, in that the megacrystic textures which define some units of the TIS (Fig. 6) are developed through open-system processes rather than
CONCLUSIONS
This is the first study which conducted microsampling of K-feldspar megacrysts from the Cathedral Peak Granodiorite for Sr and Pb trace element and initial isotopic compositions. Several important observations and conclusions can be derived from the data:
Isotopic signatures (Sr and Pb) show minimal variation, indicating that, if the feldspars crystallized in an open-system environment, recharge magmas were isotopically very similar.
The variation from core-to-rim of radiogenic isotopes is not comparable to variations documented in other volcanic and plutonic systems. This suggests that mafic recharge was not as significant in the development of the Kcp as in the other systems.
Initial Sr and Pb compositions form a tight cluster similar to Kcp whole-rock data, indicating feldspar growth occurred in Kcp.
49
APPENDIX 1: TABLES OF GEOCHEMCIAL DATA
Table 2-1: Rb and Sr Trace Element and Isotopic Data
Sample Distance from Core Measured Rb Sr Calculated Initial Uncertainty (mm) 87Sr/86Sr ppm ppm 87Rb/86Sr 87Sr/86Sr (±)
JKCM3-1 2.00 0.707047 67 302 0.6424 0.706298 0.0000339
JKCM3-2 3.25 0.707066 59 265 0.7072 0.706328 0.0000506
JKCM3-3 4.50 0.707095 136 538 0.7337 0.706234 0.0000446
JKCM3-4 5.75 0.707123 379 1689 0.6489 0.706361 0.0000298
JKCM3-5 7.00 0.707043 203 905 0.6485 0.706265 0.0000283
JKCM3-6 8.25 0.707065 208 709 0.8495 0.706060 0.0000356
JKCM3-7 9.50 0.707035 155 640 0.7005 0.706209 0.0000309
JKCM3-8 10.75 0.707322 169 656 0.7434 0.706430 0.0000296
JKCM3-9 12.00 0.707229 176 582 0.8749 0.706194 0.0000338
JKCM3-10 13.25 0.707386 75 245 0.8847 0.706386 0.0000852
JKCM4-1 1.00 0.707216 207 899 0.6677 0.706422 0.0000199
JKCM4-2 3.50 0.707135 115 563 0.5947 0.706428 0.0000192
JKCM4-3 6.00 0.706964 165 1072 0.4469 0.706446 0.0000182
JKCM4-4 8.50 0.707022 127 751 0.4919 0.706442 0.0000187
JKCM4-5 11.00 0.707046 244 1310 0.5412 0.706408 0.0000187
JKCM4-6 13.50 0.707046 163 842 0.5603 0.706383 0.0000184
JKCM4-7 16.00 0.707099 73 343 0.6141 0.706388 0.0000217
JKCM4-8 18.50 0.707081 127 626 0.5898 0.706389 0.0000193
JKCM4-10 23.50 0.707651 190 505 0.3763 0.706345 0.0000258
JKCM5-1 0.00 0.707115 86 423 0.5846 0.706412 0.0000188
JKCM5-2 2.25 0.707408 768 2718 0.8174 0.706419 0.0000214
JKCM5-3 4.50 0.707116 211 1119 0.5453 0.706478 0.0000199
50
JKCM5-7 13.5 0.707057 79 385 0.5947 0.706355 0.0000202
JKCM5-8 15.75 0.707056 252 1281 0.5698 0.706379 0.0000188
JKCM5-10 20.25 0.707359 105 359 0.8458 0.706359 0.0000238
JTF1-1 2.00 0.707112 101 492 0.5923 0.706398 0.0000191
JTF1-2 3.00 0.707086 155 839 0.5359 0.706437 0.0000183
JTF1-3 4.00 0.707136 346 1585 0.6320 0.706372 0.0000195
JTF1-4 5.00 0.707123 789 3981 0.5736 0.706430 0.0000187
JTF1-5 6.00 0.707238 178 788 0.6540 0.706504 0.0000201
JTF1-6 7.00 0.707091 172 900 0.5525 0.706429 0.0000185
JTF1-7 8.00 0.707051 180 928 0.5613 0.706371 0.0000189
JTF1-8 9.00 0.707113 226 1094 0.3461 0.706404 0.0000165
JTF1-9 10.00 0.707082 136 687 0.7786 0.706394 0.0000223
JTF1-10 11.00 0.707161 195 805 0.9542 0.706313 0.0000263
JTF2-1 1.00 0.707326 488 1852 0.7321 0.706406 0.0000210
JTF2-2 2.00 0.707243 280 1138 0.6607 0.706391 0.0000208
JTF2-4 4.00 0.707330 136 660 0.8309 0.706620 0.0000215
JTF2-5 5.00 0.707307 175 682 0.8946 0.706412 0.0000216
JTF2-6 6.00 0.707130 460 2213 0.6550 0.706399 0.0000191
JTF2-7 7.00 0.707018 464 2469 0.3664 0.706367 0.0000192
JTF2-8 8.00 0.707070 208 1117 0.5381 0.706430 0.0000189
JTF2-9 9.00 0.707064 292 1588 1.3140 0.706428 0.0000201
JTF3-1 1.00 0.707125 329 1536 0.6198 0.706379 0.0000192
JTF3-2 2.00 0.707186 245 1105 0.6420 0.706421 0.0000201
JTF3-3 3.00 0.707183 156 710 0.6361 0.706416 0.0000193
JTF3-4 4.00 0.707091 75 351 0.6169 0.706368 0.0000200
JTF3-5 5.00 0.707044 138 704 0.5672 0.706366 0.0000193
JTF3-6 6.00 0.707104 76 379 0.5792 0.706411 0.0000194
JTF3-7 7.00 0.707136 291 1365 0.6171 0.706407 0.0000205
JTF3-8 8.00 0.706992 106 623 0.4937 0.706411 0.0000193
JMSL1-1 1.00 0.707788 179 559 0.9255 0.706644 0.0000282
51
JMSL1-3 3.00 0.707882 165 384 1.2445 0.706355 0.0000314
JMSL1-4 4.00 0.707855 173 453 1.1047 0.706502 0.0000270
JMSL1-5 5.00 0.709199 379 862 1.2742 0.707651 0.0000299
JMSL2-1 1.00 0.707978 191 544 1.2511 0.706454 0.0000289
JMSL2-2 2.00 0.707861 117 400 1.1286 0.706487 0.0000273
JMSL2-3 3.00 0.708199 365 786 1.3442 0.706558 0.0000458
JMSL2-4 4.00 0.708272 188 482 0.8494 0.707235 0.0000223
JMSL2-5 5.00 0.707735 156 360 1.0147 0.706486 0.0000279
JKW-1 1.25 0.708112 53 344 0.4467 0.707604 0.0000171
JKW-2 2.50 0.708261 117 627 0.5412 0.707635 0.0000180
JKW-3 3.75 0.708218 290 1638 0.5129 0.707636 0.0000187
JKW-4 5.00 0.708260 113 621 0.5275 0.707646 0.0000180
JKW-5 6.25 0.708228 100 611 0.4744 0.707677 0.0000174
JKW-6 7.50 0.708160 74 513 0.4157 0.707688 0.0000170
JKW-7 8.75 0.708199 56 344 0.4741 0.707654 0.0000173
JKW-8 10.00 0.708095 87 604 0.4158 0.707625 0.0000171
JKW-9 11.25 0.708109 75 512 0.4246 0.707620 0.0000174
JKW-10 12.50 0.708134 69 436 0.4592 0.707600 0.0000171
All samples from Kcp corrected to 88.1 Ma. Sample JKW corrected to 84.9 Ma. Data are normalized to naturally occurring
86Sr/88Sr = 0.1194. Ratios reported relative to 87Sr/86Sr = 0.71025 for NBS 987. Decay constant; 87Rb = 1.393 x 10⁻¹¹/yr (Nebel et
52
Table 2-2: U and Pb Trace Element and Isotopic Data
Measured Initial
206Pb 207Pb U Pb Age 238U 235U 206Pb 207Pb 207Pb
53
JKCM5-9 18.8602 15.6891 0.061 15.072 88.1 0.124057 0.0009 18.8345 15.6891 0.8330 JTF2-1 18.8240 15.6509 0.073 16.649 88.1 0.134434 0.000975 18.8105 15.6509 0.8320 JTF2-2 18.8176 15.6290 0.143 11.895 88.1 0.365699 0.002652 18.7982 15.6290 0.8314 JTF2-3 18.8611 15.6611 0.273 8.951 88.1 0.932488 0.006763 18.8734 15.6611 0.8298 JTF2-4 18.9075 15.6694 0.336 10.480 88.1 0.982775 0.007128 18.9541 15.6694 0.8267 JTF2-5 18.8314 15.6565 0.027 15.077 88.1 0.054163 0.000393 18.8116 15.6565 0.8323 JTF2-6 18.8298 15.6849 0.062 8.020 88.1 0.23838 0.001729 18.8779 15.6849 0.8309 JTF2-7 18.8898 15.6758 0.062 40.739 88.1 0.046903 0.00034 18.8571 15.6849 0.8318 JTF2-8 18.8482 15.6681 0.053 8.439 88.1 0.192186 0.001394 18.8513 15.6681 0.8311 JTF2-9 18.8069 15.6868 0.048 15.931 88.1 0.092738 0.000673 18.7889 15.6868 0.8349
Uncertainty in 206Pb/204Pb= 0.12%, 207Pb/204Pb= 0.18%. Decay constants 238U = 1.55125 x 10⁻¹⁰/yr, 235U = 9.84858 x 10⁻¹⁰/yr,
APPENDIX 3: ESTIMATION OF ERRORS IN MEASURED AND INITIAL ISOTOPIC RATIOS
Measured and Initial Pb Isotopic Ratios
Initial isotopic compositions were calculated through their respective age equations:
( 𝑃𝑏
206
𝑃𝑏
204 ) 𝑖
= ( 𝑃𝑏
206
𝑃𝑏
204 ) 𝑚
− ( 𝑈
238
𝑃𝑏
204 ) (𝑒𝜆𝑡− 1) (A1)
( 𝑃𝑏
207
𝑃𝑏
204 ) 𝑖
= ( 𝑃𝑏
207
𝑃𝑏
204 ) 𝑚
− ( 𝑈
235
𝑃𝑏
204 ) (𝑒𝜆𝑡− 1) (A2)
Where the subscript i indicates initial ratios and m the measured ratios. Decay constants λ238U =
1.55125 x 10⁻¹⁰/yr, and λ235U = 9.84585 x 10⁻¹⁰/yr after Steiger and Jäger (1977).
Measured Pb ratios were corrected by reference to a standard material, NBS 981. Long- term measurements of NBS 981 in the UNC TIMS laboratory yielded a fractionation correction of 0.12 ± 0.06% per amu, yielding uncertainties during mass fractionation in 207Pb/204Pb
, 206Pb/204Pb
, 205Pb/204Pb of ± 0.18%, ± 0.12%, and ± 0.06%, respectively. Total uncertainty in the
measurements is found by combining the fractionation uncertainty with the analytical uncertainty for each sample. Because these uncertainties are from two independent measurements, they are combined in quadrature (Taylor, 1997):
𝜎 = √𝑒𝑟𝑟𝑜𝑟 𝑖𝑛 𝑓𝑟𝑎𝑐𝑡𝑖𝑜𝑛𝑎𝑡𝑖𝑜𝑛 𝑐𝑜𝑟𝑟𝑒𝑐𝑡𝑖𝑜𝑛2+ 𝑇𝐼𝑀𝑆 𝑚𝑒𝑎𝑠𝑢𝑟𝑚𝑒𝑛𝑡 𝑒𝑟𝑟𝑜𝑟2
(A3)
𝜎 ( 𝑃𝑏
206
𝑃𝑏
204 ) 𝑚
= √(0.0012)2+ 𝑇𝐼𝑀𝑆 𝑚𝑒𝑎𝑠𝑢𝑟𝑚𝑒𝑛𝑡 𝑒𝑟𝑟𝑜𝑟2
(A4)
𝜎 ( 𝑃𝑏
207
𝑃𝑏
204 ) 𝑚
Sr Isotopic Data Reduction and Estimation of Uncertainties
Initial Sr isotopic values and combined uncertainties were corrected using an R program (code below description). Since complexity arises from the separate measurements of
measurements of Rb and Sr, estimation of the total analytical uncertainty as well as Sr(i) value
were calculated through a Monte Carlo simulation. The Monte Carlo simulation starts by creating normal distributions (n = 10,000) with means corresponding to the measurements of
85Rb/87Rb, 87Sr/86Sr and 84Sr/86Sr, and 2σ values based on the internal reproducibility of these
measurements (0.01 for 85Rb/87Rb, 0.000015 for 87Sr/86Sr, 0.0003 for 84Sr/86Sr). With these distributions the data were then reduced to remove the tracer contribution to the measurement by normalizing to 86Sr/88Sr to 0.1194. This can be solved for a spiked sample by writing the
following equations:
𝑁𝑠× ℎ + 𝑁𝑡× (1 − ℎ) = 𝑁 × (1 + 𝑏 𝑚)
𝑚×𝛼
(A6)
𝑇𝑠× ℎ + 𝑇𝑡× (1 − ℎ) = 𝑇 × (1 +
𝑎 𝑚)
𝑚×𝛼
(A7) Where N is the normalizing isotopic ratio (84Sr/86Sr), T is the known tracer isotopic ratio,
subscript s is the sample, t is the tracer, unscripted is the measured isotopic ratio, h is ratio of the number of atoms of the reference isotope in the sample to the total number of atoms of the reference isotope, m is the reference isotope (86Sr), a is the mass difference for T (2), and b is the mass difference for N (2). These two equations can be solved and equated yielding:
𝑋 (1 + 𝑏
𝑚) 𝑚×𝛼
− 𝑌 (1 + 𝑎
𝑚) 𝑚×𝛼
+ Z = 0 (A8)
Where:
𝑋 = 𝑁
𝑌 = 𝑇
𝑇𝑠− 𝑇𝑡 (A10)
Z = Tt (𝑇𝑠− 𝑇𝑡)
− Nt (Ns− Nt)
(A11) This equation (Eq.A11) can be solved for α, by defining:
𝐹(𝑎) = 𝑋 (1 + 𝑏 𝑚)
𝑚×𝛼
− 𝑌 (1 + 𝑎 𝑚)
𝑚×𝛼
+ 𝑍 (A12)
and
𝐹′(𝑎) = 𝑋 (1 + 𝑏 𝑚)
𝑚×𝛼
× ln(𝑚 + 𝑏) − 𝑌 (1 + 𝑎 𝑚)
𝑚×𝛼
× ln(𝑚 + 𝑎) (A13)
Using Newton’s method, alpha can be determined by iteration on the equation:
𝑎 = 𝑎0 − 𝐹(𝑎)/𝐹′(𝑎) (A14)
Through this, the first estimate of a0can be determined by solving the N and T equation (Eq. A6
& Eq. A7) using a linear fractionation law to get:
𝛼𝑙𝑖𝑛𝑒𝑎𝑟 =
(𝑌 − 𝑋 − 𝑍)
(𝑋 × 𝑏) − (𝑌 × 𝑎) (A15)
This is iterated until the 84Sr/86Sr value is 0.1194.
Once the spike and blank contributions have been removed from the measurement data, the corrected 87Sr/86Sr and 87Rb/86Sr ratios can be substituted into the decay equation to obtain
87Sr/86Sr (i):
(
87𝑆𝑟𝑆𝑟
86
)
𝑖
=
(
87𝑆𝑟𝑆𝑟
86
)
𝑚
− (
87𝑅𝑏𝑆𝑟
86
) (𝑒
𝜆𝑡− 1)
(A16)
Where i is the initial isotopic ratio, m is the corrected measured ratio, t is time. A decay constant,
87Rb = 1.393 x 10⁻¹¹ was used after Nebel et al., (2011). Once Sr
APPENDIX 4: DEVELOPED SOFTWARE
Monte Carlo-ReduceR
####
#TIMS Rb / Sr Reducer with Monte Carlo simulation #Jonathan Munnikhuis ############Spike Data################# #############Spike-b3 sp_86Sr84Sr=0.000589149 sp_87Sr84Sr=9.28084E-05 sp_88Sr84Sr=0.000387453 sp_ppm84Sr=0.144529 sp_85Rb87Rb=0.008030983 sp_ppm87Rb=0.968349 #Abundances sp_AbSr84=0.998832 sp_AbSr86=0.000588461 sp_AbSr87=0.0000927 sp_AbSr88=0.000387 sp_AbRb87=0.992033 sp_AbRb85=0.007967 ########################################
#Create delimited text file with sample info per column. If there are multiple samples you can change sample by modifying the upcoming "co" variable.
# Important = make sure Rb data is fractionated corrected before inputting in 85Rb/87Data.
#Latest alpha value is = +.30823 3/16/2016 #############Sample Info##############
input <- read.delim("/~”) #read input file here ##########
co=1 #change columns per sample here # Reading in sample information SampleName=input[1,co] Sa_weight=input[2,co] RbAliquotFrac=input[3,co] sp_RbWeight=input[5,co] RbBlank=input[6,co] sa_85Rb87Rb=input[7,co] SrAliquotFrac=input[8,co] sp_SrWeight=input[10,co] SrBlank=input[11,co] sa_84Sr86Sr=input[12,co] sa_87Sr86Sr_linNoRb=input[13,co] sa_86Sr88Sr=input[14,co] int_87sr86sr_guess=input[15,co] guess_Age=input[16,co] Bias=input[17,co] blank87Sr86Sr=input[18,co] normval_86Sr88Sr=input[19,co]
########Monte Carlo portion########### roll the dice.
# Creates "data clouds" from UNC-TIMS internal reproducibility #twosigabs85Rb87Rb
stdRb=.01/2
stdSr_2=.000030/2
#Here's the number of iterations you want to send through the output n=10e3
#create random normal distribution of data spreadRb=rnorm(n, sa_85Rb87Rb, stdRb)
spread8786=rnorm(n, sa_87Sr86Sr_linNoRb, stdSr_1) spread8486=rnorm(n,sa_84Sr86Sr,stdSr_2)
#spread8688=rnorm(n,sa_86Sr88Sr,stdSr_3)
#Some histograms of the data clouds, make sure mean is where it should be.
hist(spreadRb) hist(spread8786) hist(spread8486) hist(spread8688)
###Monte Carlo is now about to roll several dice, before putting through reduction.
SCont8786=N8786-TCont8786 SCont8886=N8886-TCont8886
#################################Beginning of Output####
SampleComp8486=SCont8486/SCont8686 SampleComp8786=SCont8786/SCont8686 SampleComp8886=SCont8886/SCont8686 Normalized8688=SCont8686/SCont8886 ####### ####### a=Normd_8688/normval_86Sr88Sr b=86/88 c=86*86 ExpCorr8786=SampleComp8786*sqrt((1-(log(a)/log(b)/c))) ExpCorr8786=signif(ExpCorr8786, 6) BiasCorr8786=ExpCorr8786+(ExpCorr8786*(Bias/1e6)) BiasCorr8786=signif(BiasCorr8786, 6) ############## ##Rb Ratios Rb8587m=sa_85Rb87Rb #measured Rb8587t=sp_85Rb87Rb #tracer Rb8587s=Rb8587m-Rb8587t #sample #########Isotopic concentrations umol86Sr=(SCont8686/TCont8486)*(sp_ppm84Sr/83.913429)*sp_SrWeight umol87Sr=BiasCorr8786*umol86Sr umol84Sr=umol86Sr*SampleComp8486 umol88Sr=umol86Sr*SampleComp8886 ## umol87Rb=(Rb8587s/(2.59265-Rb8587m))*((sp_ppm87Rb/86.909186)*(sp_RbWeight/RbAliquotFrac))#replace 1 here for Rb Aliquot fraction
ppm86Sr=signif(ppm86Sr,5) TotRb=ppm87Rb/((BlCor_umol87Rb*86.9092)/((BlCor_umol87Rb*86.9092)+(BlCo r_umol85Rb*84.9118))) TotRb=signif(TotRb,6) ugRb=TotRb*Sa_weight ugRb=round(ugRb, 3) TotSr=ppm86Sr/((BlCor_umol86Sr*85.9093)/((BlCor_umol86Sr*85.9093)+(BlCo r_umol87Sr*86.9089)+ (BlCor_umol88Sr*87.9056)+(BlCor_umol84Sr*83.9134))) TotSr=signif(TotSr,6) ugSr=TotSr*Sa_weight ugSr=round(ugSr, 3) RbSr_weight=TotRb/TotSr RbSr_weight=round(RbSr_weight,4) Rb87_Sr86=BlCor87Rb86Sr Rb87_Sr86=round(Rb87_Sr86,digits= 4) Cal87Sr86Sr_i=Sr8786-Rb87_Sr86*(exp(0.00000000001393*guess_Age*1000000)-1) Cal87Sr86Sr_i=round(Cal87Sr86Sr_i,6)##############
########STUFF YOU CARE ABOUT############# twosigCal87sr86sr=sd(Cal87Sr86Sr_i)*2
Sr_i=mean(Cal87Sr86Sr_i)
Sr_i
twosigCal87sr86sr
############################################
#Here are some more things that might matter to you. #just uncomment the variables below if you care about it
# Sr8786=mean(Sr8786) # TotSr=mean(TotSr) # ppm86Sr=mean(ppm86Sr) # TotRb=mean(TotRb) # ppm87Rb=mean(ppm87Rb) # ugRb=mean(ugRb) # Rb87_Sr86=mean(Rb87_Sr86) # RbSr_weight=mean(RbSr_weight)
RechargR – A Dynamic Crystallization Model
#RechargR#
#Developed by Jonathan Munnikhuis
#Simulate Recharge into a Crystallizing Magma Chamber
#Variables - Plag, Kspar, Hornblende, Biotite, Quartz
wt_frac = c(0.17301138, 0.699127742, 0, 0, 0.127860878) #wt
frac of hypothetical residual 25% of plg remaining, Kfs, and Qtz
##### 50% %25 %25 ##Rhyolite Kds from Nash & Crecraft 1988
kd_sr=c(19.9, 5.9, 0.022, 0.41, 0)
kd_rb=c(0.125, 1.8, 0.014, 3.2, 0)
kd_pb=c(1.31, 2.545, 0.255, 0.85, 0) kd_ba=c(1.515, 11.45, 0.044, 23.533, 0)
kd_feldspar = c(kd_sr[2], kd_rb[2], kd_pb[2], kd_ba[2]) ### Bulk rock concentrations
##
Bulk_D_sr = sum(wt_frac*kd_sr) Bulk_D_rb = sum(wt_frac*kd_rb) Bulk_D_pb = sum(wt_frac*kd_pb) Bulk_D_ba = sum(wt_frac*kd_ba)
bulkDs = c(Bulk_D_sr, Bulk_D_rb, Bulk_D_pb, Bulk_D_ba) #######
ml=100; # units of initial mass of melt mx=100; # initial mass of crystals
ppm_o=c(914, 176, 19, 587) #Original Concentration from Frac Xtlz
#ppm_add = c(604.25,128.5576923,17.38461538, 699.0730769 # Set recharge liquid here
#ppm_add = c(27, 297, 38, 20 ) # Ex. Concentraion of Elements in Kcp aplites
### Set variables 1 = Sr, 2 = Rb, 3 = Pb, 4 = Ba BulkD = bulkDs
cl = ppm_o ca= ppm_add D = kd_feldspar ############
dl = 6 #mass crystallized between melt additions da = 3#mass liquid added
dx = 0.05 # increment of interval between cycles n = 20 # number of cycles
###########
mxc = seq(0,dl,dx) # range of crystal growth ml=100; # units of initial mass of melt mx=100; # initial mass of crystals
### initialize variabiles as emtpy vectors to be filled C_sr <- vector()
Z_sr<- vector() C_rb <- vector() Z_rb<- vector() C_pb <- vector() Z_pb<- vector() C_ba <- vector() Z_ba <- vector() Fmelt <-vector() R <-vector()
#initialize index values ind = 1
################ ################ ###Loop####
for (i in 1:n){
mel_sr = cl[1]*ml mel_rb = cl[2]*ml mel_pb = cl[3]*ml mel_ba = cl[4]*ml
for (k in mxc){
ml = ml-dx #mass of liquid after xtls removed mxn = mxn+dx #mass of new xl in this step mx = mx +dx
Fmelt[ind] = ml/(ml+mx) R[ind] = (mxn^(1/3))
#Sr
Z_sr[ind] = cl[1] * D[1] CB_sr = BulkD[1] * cl[1]
C_sr[ind] = ((ml+dx) * cl[1] - CB_sr*dx) / ml cl[1] = C_sr[ind]
mel_sr = cl[1]*ml
#Rb
Z_rb[ind] = cl[2] * D[2] CB_rb = BulkD[2] * cl[2]
C_rb[ind] = ((ml+dx) * cl[2] - CB_rb*dx) / ml cl[2] = C_rb[ind]
mel_rb = cl[2]*ml
#Pb
Z_pb[ind] = cl[3] * D[3] CB_pb = BulkD[3] * cl[3]
C_pb[ind] = ((ml+dx) * cl[3] - CB_pb*dx) / ml cl[3] = C_pb[ind]
mel_pb = cl[3]*ml
#Ba
Z_ba[ind] = cl[4] * D[4] CB_ba = BulkD[4] * cl[4]
C_ba[ind] = ((ml+dx) * cl[4] - CB_ba*dx) / ml cl[4] = C_ba[ind]
mel_ba = cl[4]*ml
ind=ind+1
}
ml = ml+da
mel_sr = mel_sr+da*ca[1] cl[1]=mel_sr/ml
mel_rb = mel_rb+da*ca[2] cl[2]=mel_rb/ml
cl[3]=mel_pb/ml
mel_ba = mel_ba+da*ca[4] cl[4]=mel_ba/ml
}
par(mfrow =c(2,2))
plot(R,Z_sr, type="l", ylab = "[Sr]", main = "Sr concentration in Feldspar")
plot(R,Z_rb, type="l", ylab = "[Rb]", main = "Rb concentration in Feldspar")
plot(R,Z_pb, type="l", ylab = "[Pb]", main = "Pb concentration in Feldspar")
plot(R,Z_ba, type="l", ylab = "[Ba]", main = "Ba concentration in Feldspar")
output = data.frame( "Fraction of Melt"=Fmelt, "Radius of Crystal" = R, "[Sr]" = Z_sr,
"[Rb]" = Z_rb, "[Pb]" = Z_pb, "[Ba]" = Z_ba)
REFERENCES
Arth, J.G., and Barker, F., 1976, Rare-earth partitioning between hornblende and dacitic liquid and implications for the genesis of trondhjemitic-tonalitic magmas: Geology, v. 4, p. 534–536, doi: 10.1130/0091-7613(1976)4<534:RPBHAD>2.0.CO;2
Bachmann, O., and Bergantz, G.W., 2004, On the origin of crystal-poor rhyolites: extracted from batholithic crystal mushes: Journal of Petrology, v. 45, p. 1565–1582, doi:
10.1093/petrology/egh019
Barboni, M., and Schoene, B., 2014, Short eruption window revealed by absolute crystal growth rates in a granitic magma: Nature Geoscience, v. 7, p. 524–528, doi: 10.1038/ngeo2185 Bateman, P.C., and Chappell, B.W., 1979, Crystallization, fractionation, and solidification of the
Tuolumne Intrusive Series, Yosemite National Park, California: Geological Society of America Bulletin, v. 90, p. 465–482, doi:
10.1130/0016-7606(1979)90<465:CFASOT>2.0.CO;2
Bateman, P.C., 1992, Plutonism in the central part of the Sierra Nevada Batholith, California: U.S Geological Survey Professional Paper 1483, 186 p.
Bauer, J.E., 2015, Complex zoning patterns and rare earth element variations across titanite crystals from the Half Dome Granodiorite, central Sierra Nevada, California: [M.S. Thesis], Chapel Hill, University of North Carolina at Chapel Hill, 76 p.
Bowring, J.F., McLean, N.M., and Bowring, S.A., 2011, Engineering cyber infrastructure for U-Pb geochronology: Tripoli and U‐U-Pb_Redux: Geochemistry, Geophysics, Geosystems, v. 12, doi: 10.1029/2010GC003479
Burgess, S.D., and Miller, J.S., 2008, Construction, solidification and internal differentiation of a large felsic arc pluton: Cathedral Peak granodiorite, Sierra Nevada Batholith: Geological Society, London, Special Publications, v. 304, p. 203–233, doi: 10.1144/SP304.11 Charlier, B.L.A., Ginibre, C., Morgan, D., Nowell, G.M., Pearson, D.G., Davidson, J.P., and
Ottley, C.J., 2006, Methods for the microsampling and high-precision analysis of strontium and rubidium isotopes at single crystal scale for petrological and geochronological applications: Chemical Geology, v. 232, p. 114–133, doi: 10.1016/j.chemgeo.2006.02.015
Cherniak, D.J., and Watson, E.B., 1992, A study of strontium diffusion in K-feldspar, Na-K feldspar and anorthite using Rutherford Backscattering Spectroscopy: Earth and Planetary Science Letters, v. 113, p. 411–425, doi:10.1016/0012-821X(92)90142-I Christensen, J.N., Rosenfeld, J.L., and DePaolo, D.J., 1989, Rates of tectonometamorphic
Christensen, J.N., and DePaolo, D.J., 1993, Time scales of large volume silicic magma systems: Sr isotopic systematics of phenocrysts and glass from the Bishop Tuff, Long Valley, California: Contributions to Mineralogy and Petrology, v.113, p. 100–114, doi: 10.1007/BF00320834
Coleman, D.S., and Glazner, A.F., 1997, The Sierra Crest Magmatic Event: Rapid formation of juvenile crust during the Late Cretaceous in California: International Geology Review, v. 39, p. 768–787, doi: 10.1080/00206819709465302
Coleman, D.S., Gray, W., and Glazner, A.F., 2004, Rethinking the emplacement and evolution of zoned plutons: Geochronologic evidence for incremental assembly of the Tuolumne Intrusive Suite, California: Geology, v. 32, p. 433–436, doi: 10.1130/G20220.1 Coleman, D.S., Bartley, J.M., Glazner, A.F., and Pardue, M.J., 2012, Is chemical zonation in
plutonic rocks driven by changes in source magma composition or shallow-crustal differentiation?: Geosphere, v. 8, p. 1568–1587, doi: 10.1130/GES00798.1
Connelly, J.N., and Thrane, K., 2005, Rapid determination of Pb isotopes to define Precambrian allochthonous domains: An example from West Greenland: Geology, v. 33, p. 953–956, doi: 10.1130/G21720.1
Cox, R.A., Dempster, T.J., Bell, B.R., and Rogers, G., 1996, Crystallization of the Shap Granite: evidence from zoned K-feldspar megacrysts: Journal of the Geological Society, v. 153, p. 625–635, doi: 10.1144/gsjgs.153.4.0625
Davidson, J.P., de Silva, S.L., Holden, P., and Halliday, A.N., 1990, Small-scale disequilibrium in a magmatic inclusion and its more silicic host: Journal of Geophysical Research, v. 95, p. 17661–17675, doi: 10.1029/JB095iB11p17661
Davidson, J.P., and Tepley, F.J., 1997, Recharge in volcanic systems: Evidence from isotope profiles of phenocrysts: Science, v. 275, p. 826–829, doi: 10.1126/science.275.5301.826 Doorn, C.J., 2016, Rb-Sr isotopic characterization of pegmatite dikes from the Tuolumne
Intrusive Suite, California, USA: [Senior Honors Thesis], Chapel Hill, University of North Carolina at Chapel Hill, 24 p.
Gagnevin, D., Daly, J.S., Poli, G., Morgan, D., 2005, Microchemical and Sr isotopic
investigation of zoned K-feldspar megacrysts: Insights into the petrogenesis of a granitic system and disequilibrium crystal growth: Journal of Petrology, v. 46, p. 1689–1724, doi: 10.1093/petrology/egi031