IDENTIFYING LONG TERM EMPIRICAL RELATIONSHIPS BETWEEN STORM
CHARACTERISTICS AND EPISODIC GROUNDWATER RECHARGE
Arik Tashie
A thesis submitted to the faculty at the University of North Carolina at Chapel Hill in partial
fulfillment of the requirements for the degree of Master of Science in the Department of
Geological Sciences.
Chapel Hill
2016
ii
© 2016
Arik Tashie
iii
ABSTRACT
Arik Tashie: Identifying long term empirical relationships between storm characteristics and
episodic groundwater recharge
(Under the direction of Tamlin Pavelsky)
Shallow aquifers are an important source of water resources and provide baseflow to
streams, yet actual rates of groundwater recharge are difficult to estimate. While climate change
is predicted to increase the frequency and magnitude of extreme precipitation events, the
resulting impact on groundwater recharge remains poorly understood. We quantify empirical
relations between storm characteristics and recharge to precipitation ratios (RPR) for a variety of
geographic and land-use types across North Carolina. Increased RPR correlates with increased
storm duration, whereas RPR decreases with increasing storm magnitude and intensity,
iv
ACKNOWLEDGEMENTS
v
TABLE OF CONTENTS
LIST OF TABLES……….vii
LIST OF FIGURES………..viii
LIST OF ABBREVIATIONS……….ix
CHAPTER 1: INTRODUCTION………1
1.1 Background………1
1.2 Study Area……….6
CHAPTER 2: METHODS………...9
2.1 The EMR Method………..9
2.2 Parameterization and Data Analysis………11
CHAPTER 3: RESULTS AND CONCLUSIONS………18
3.1 Storm Characteristics………...18
3.2 Seasonality………...22
3.3 Hydrologic and Seasonal Controls on RPR……….25
vi
3.5 Implications for Water Resources………31
3.6 Summary and Conclusions………..32
APPENDIX: ALL RECHARGE EVENTS: RAW EMR OUTPUT……….33
vii
LIST OF TABLES
Table 1: Summary of physical characteristics at each location………...8
Table 2: Percent change in median RPR values………19
Table 3: Relationship among storm characteristics………...26
viii
LIST OF FIGURES
Figure 1: Location of the 10 water table records used in this study………7
Figure 2: Example implementation of the EMR method………...11
Figure 3: Recharge and RPR against storm characteristics at P2………..12
Figure 4: Normalized RPR values against storm characteristics at P2………..…13
Figure 5: Median RPR values against storm characteristics at P2……….16
Figure 6: Strength of relationships between RPR and storm characteristics……….18
Figure 7: RPR to recharge relationships………....21
Figure 8: Seasonality of RPR values……….23
ix
LIST OF ABBREVIATIONS
AVG
Average rate of precipitation during a storm event
cm
Centimeter
d
Days
d
TMaximum fluctuation of the water table due to a factor other than recharge
DEP
Depth to the water table
DUR
Duration of a storm event
EMR
Episodic Master Recession method
H
Elevation of the water table
INT
Intensity of precipitation during storm event
m
Meters
MAG
Total depth of precipitation during a storm event
MRC
Master recession curve
NLCD
National Landcover Database
NOAA
National Oceanic and Atmospheric Administration
RECH
Recharge
x
RPR
Recharge-to-precipitation ratio
S
ySpecific Yield
t
Time
USGS
United States Geological Survey
1
CHAPTER 1: INTRODUCTION
11.1 Background
Groundwater is essential both as an economic resource and for maintaining ecological
functions in natural systems. Humans have increasingly come to rely on groundwater as a
primary water source and an important buffer to less reliable sources of freshwater from
precipitation and surface water. Accordingly, in many regions groundwater is being extracted at
rates that far exceed sustainable levels (Famiglietti, 2014). Recharge of groundwater reservoirs
depends chiefly on infiltration of precipitation and subsequent percolation of infiltrated water
below the root zone. Climate model simulations suggest that changing climatic conditions will
substantially alter precipitation characteristics, especially by increasing the magnitude, intensity,
and frequency of the largest storm events (Allen and Ingram, 2002; Pall et al., 2007; Trenberth et
al., 2003). However, the influence of these altered precipitation characteristics on groundwater
recharge is complex and remains poorly understood (Taylor et al., 2012).
Since human alteration of the landscape has major impacts on the groundwater system
(Calder, 1993), the coupled influence of land-use, vegetation, and soil type on net recharge has
been well studied. Across various climates, the reduction of vegetative cover has often been
shown to result in an increase in recharge. For example, many studies have found large increases
in average annual recharge by the conversion of forests and shrubs to crops and grasses (Allison
1 This work previously appeared as an article in Water Resources Research. The original citation is as follows:
2
et al., 1990; Hornbeck et al., 1993; Pyrch, 1988; Leterme and Mallants, 2011) or the conversion
of grass cover to bare ground (Zhang and Schilling, 2006). In Texas, Keese et al. (2005) showed
that recharge tends to increase with a decrease in the density of vegetation. Similarly, in the
American southwest Scanlon et al. (2005) showed that the conversion of agricultural land to
natural brush and scrub led to decreased rates of recharge. These negative relationships between
recharge and vegetative density are due largely to the interception of precipitation and
transpiration of soil water (Bosch and Hewlett, 1982; Brown et al., 2005).
However, in many other locations continued human alteration of the landscape has
decreased recharge, since spatially averaged infiltration rates can be reduced by urbanization
(Dams et al., 2008), deforestation, and certain agricultural practices (Dias et al., 1985a and
1985b; Hanson et al., 2004). Forest clearing for agriculture and urbanization has reduced
recharge in east Java (Bruijnzeel, 1988) and urbanization has decreased recharge in China’s
Guishui River Basin (Pan et al., 2011) as well as across the majority of the Upper Illinois River
Basin (Arnold and Friedel, 2000). Apart from land cover, soil texture is also a primary control of
recharge rates (Anuraga et al., 2006; Zhang et al., 1999), with clayey soils generally
accommodating less recharge than sandy soils (Cook et al., 1992; Keese et al., 2005).
3
annual precipitation. Crosbie et al. (2012) similarly found that the majority of annual recharge in
the Murray-Darling Basin, Australia, was generated by a small number the largest precipitation
events. A positive correlation between magnitude of precipitation and fractional recharge has also
been shown in the agricultural region of the North China Plain (Kendy et al., 2003, 2004).
Further, seasonality of precipitation, antecedent soil moisture conditions, and climate variability
have also been shown to significantly impact recharge rates across diverse geographic regions
(Lee et al., 2006; Vivoni, 2009).
These seemingly contradictory explanations of the relationships between groundwater
recharge and land cover, soil type, and storm characteristics reflect the complex,
geographically-dependent variations in infiltration and unsaturated zone storage dynamics. For infiltration to
occur, precipitation must first exceed interception by the vegetation canopy. Subsequently, for
infiltration to contribute to recharge, the soil must be wetted enough to allow vertical drainage
below the root zone (i.e., matric potential is above field capacity). However, if the intensity of
the precipitation reaching the ground surface exceeds the soil’s infiltration capacity or
precipitation magnitude exceeds unsaturated zone storage, runoff will occur and thereby limit the
fraction of precipitation that can contribute to recharge. Thus in some situations increasing
rainfall intensity might decrease recharge because thresholds for infiltration excess overland flow
are reached. In other locations increased rainfall duration may lead to decreased recharge
because thresholds for saturation excess overland flow are reached. Thresholds for runoff
generation by either infiltration or saturation excess depend not only on rainfall characteristics,
but also on the complex non-linear influences of soil stratigraphy, hydraulic properties,
4
largely on the of non-linear unsaturated zone response to precipitation. Given the predictions of
altered storm characteristics due to climate change and ever-evolving land-use patterns, it is
important to understand the relationships between recharge and storm characteristics across
land-uses and soil types. What is lacking from the scientific record is a long-term empirical study of
how storm characteristics have affected recharge across a climactically similar but
physiographically diverse landscape.
One potential obstacle to empirical studies of this type is the dearth of methods available
for estimating groundwater recharge which have fine spatial resolution and applicability over
long periods of time and diverse landscapes (Scanlon et al., 2002). For example, the baseflow
discharge method (e.g., Meyboom, 1961) and isotopic or chemical tracers (e.g., Taylor et al.,
1989) are both capable of calculating recharge over tens of years (or centuries). However, these
methods tend to integrate over months or years making it impossible to isolate individual
recharge events. Conversely, seepage meters (Scanlon et al., 2002), heat tracers (e.g., Rorabough,
1964), and lysimeters (e.g., Allen et al., 1991) may be used to measure recharge over very small
time scales. Unfortunately, their expense and relative complexity have inhibited development of
long term data sets, making rigorous statistical analysis difficult. Finally, diffuse flow methods
for calculating recharge from unsaturated hydraulic conductivity and soil moisture
measurements, such as the zero plane flux method (Richards et al., 1956) and various Darcian
methods (e.g., Nimmo et al., 1994), ignore preferential flow, which is often a major contributor
to recharge (Cuthbert et al., 2013; Mirus and Nimmo, 2013).
5
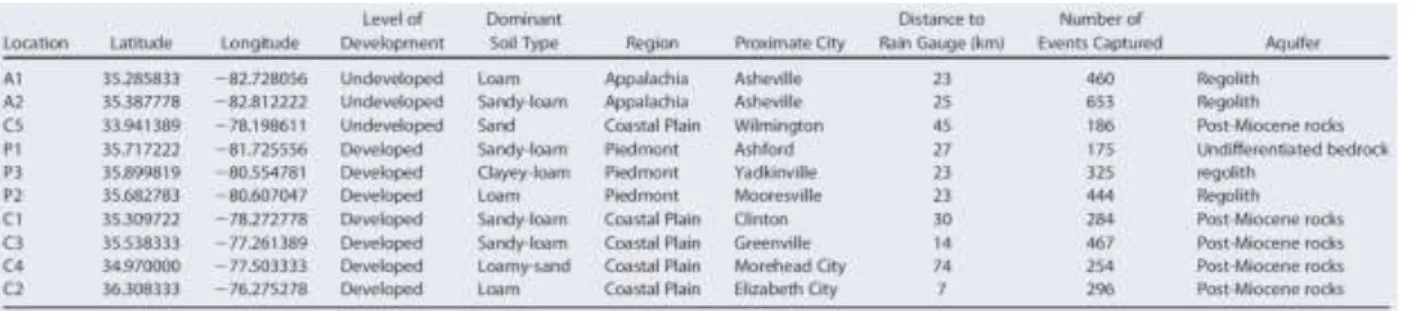
isolated and associated with individual precipitation events. The Episodic Master Recession
(EMR) method (Nimmo et al., 2015), is an adaptation of the WTF method that facilitates
analysis of groundwater recharge and concomitant precipitation at high temporal resolution in a
consistent and rigorous manner. Further, the EMR method relies primarily on two of the most
widely available and readily accessible types of long-term hydrologic data (groundwater levels
and precipitation), which facilitates large-scale studies across geographically diverse regions.
Given water table and precipitation records of sufficient duration and temporal resolution it is
thus possible to use the EMR method to evaluate the influence of storm characteristics on
episodic groundwater recharge.
6
1.2 Study Area
We selected the state of North Carolina, USA, as the study area due to its geographic
diversity across a consistent latitude, as well as the availability of high-resolution water table
data within a variety of land-use and land cover types. North Carolina is divided into three
physiographic provinces from east to west: the Coastal Plain, the Piedmont, and Appalachia. The
Coastal Plain is flat, experiences heavy annual precipitation (120 to 160 cm) (State Climate
Office of North Carolina, 2015), has sandy soils, and is underlain by shallow localized
sedimentary aquifers (U.S. Geological Survey, 2015). The Piedmont consists of rolling hills and
experiences somewhat less annual precipitation (100 to 120 cm), while Appalachian precipitation
is location dependent (100 to 180 cm), in part because the region is characterized by some of the
greatest relief in the eastern United States. The Piedmont and Appalachia are both underlain by
complex fractured Triassic rocks covered by thick regolith. Though most accessible groundwater
is stored in shallow regolith, the secondary fractures of the crystalline bedrock are also tapped for
groundwater extraction (U.S. Geological Survey, 2015).
7
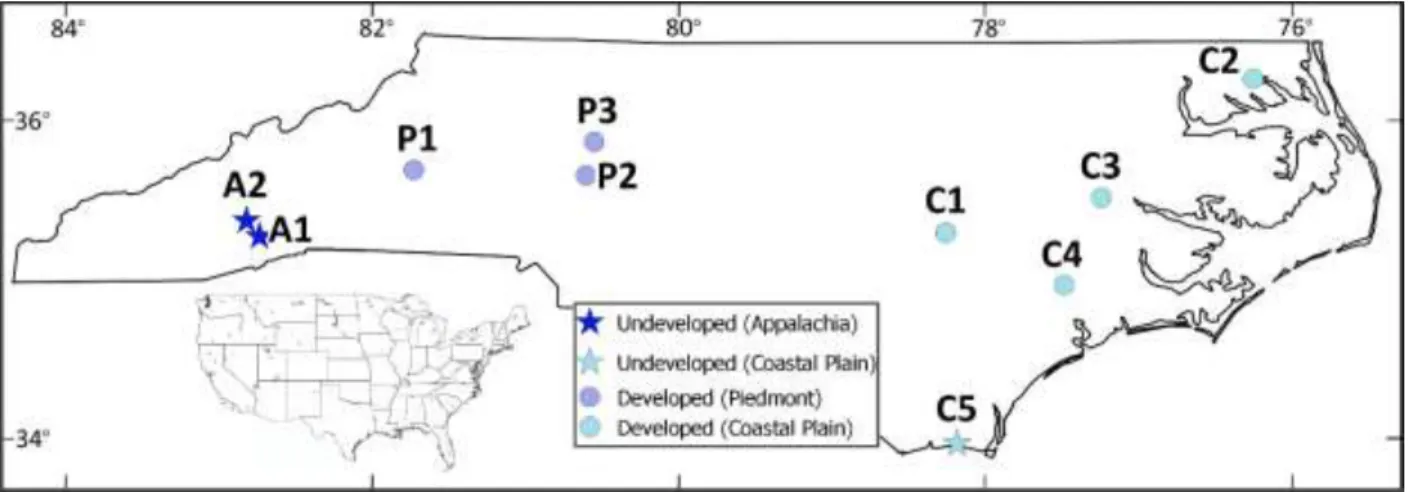
precipitation measurements. Figure 1 shows the locations of the ten sites considered and Table 1
summarizes the physical characteristics of each location.
Figure 1:
Location of the 10 water table records used in this study.
All of the ten wells that met the selection criteria (Figure 1, Table 1) are in relatively
shallow surficial aquifers, with an average depth to water table of two to three meters and a
typical seasonal range of water table depths of one to two meters. Two of the data sets (A1 and
A2) represent relatively undeveloped locations in the Pisgah National Forest in the Appalachian
Mountains, though A2 abuts a trail network and has seen moderate landscape alteration. Both
Appalachian wells are in sandy loam soils (Soil Survey, 2015). The next two locations (P2 and
P3) are in the central Piedmont and have thick clayey or loamy clayey soils, as does the fifth
location (P1) located in the border region between the western Piedmont and the eastern
8
Coastal Plain wells are in shallow post-Miocene rocks with overlying soils ranging from loamy
(C2), to loamy-sandy (C1, C3, and C4), to sandy (C5).
Table 1:
Summary of physical characteristics at each location.
9
CHAPTER 2: METHODS
2.1 The EMR Method
The WTF method relates rises in groundwater levels to recharge arriving at the water
table:
R = S
y∆H
e(1)
where R is recharge [L]; S
yis specific yield [-]; and ∆H
e[L] is the effective rise in the water
table, which is actual groundwater rise due to recharge corrected for ongoing groundwater
recession (discussed below). The WTF method can be applied to shallow, unconfined aquifers
that show steep water level rises and declines (Healy and Cook, 2002). Possible sources of error
include changes in the water table elevation due to anything other than recharge or steady water
table recession, including: 1) strong evapotranspiration-driven diurnal fluctuations (White,
1932), 2) heavy groundwater pumping (Healy and Cook, 2002), 3) changes in atmospheric
pressure (Weeks, 1979), 4) pressure changes due to entrapped air (Krul and Liefrinck, 1946), and
5) rapid conversion of capillary water to phreatic water where the water table is near the ground
surface (Heliotis and DeWitt, 1987). We eliminate the first two of these errors by careful site
selection (see criteria described above) while the remaining types of error described above are
inherently minimized by application of the EMR method (see Nimmo et al, 2015).
10
(d
T) [L T
-1]. An MRC is a mathematical representation of expected water table decline in the
absence of episodic recharge as a function of hydraulic head (Heppner and Nimmo, 2005;
Crosbie et al., 2005) and d
Tis an estimate of the maximum magnitude of water table fluctuations
caused by factors other than recharge. Thus, a recharge event is identified if:
∆H
a> d
T− ∆H
MRC(2)
where ∆H
ais the actual change in water table level; and ∆H
MRCis the MRC extrapolated water
table decline in the absence of recharge. Since recharge has already begun when ∆H
MRCexceeds
this threshold, the beginning of the event (t
i) is set to the time when ∆H
afirst exceeds ∆H
MRC. A
recovery time parameter (t
p) is then used to determine the precipitation event window to attribute
to each recharge event.
The end of a recharge event is often characterized by non-recharge related water table
declines (e.g., escape of entrapped air). To account for the effects of these fluctuations, the end
of a recharge event (t
f) is defined as the earliest time when ∆H
aequals ∆H
MRCafter having first
decreased to some value below ∆H
MRC, then water levels are extrapolated forwards and
backwards in time from t
iand t
fusing the MRC. ∆H
eis defined as the difference between these
11
Figure 2:
Graph illustrating an example implementation of the EMR method using observed
data at C3 in late January, 1993. The black line shows water table height above datum, made
bold during periods of recharge and thin between periods of recharge. Red lines are MRC
extrapolations forward and backward in time from the start and end of a period of recharge. Rise
in water table is calculated as the difference between these extrapolations at each event.
Cumulative precipitation is shown in blue, with medium blue indicating the time window during
which precipitation may have generated recharge (i.e., the Precipitation Window) and dark blue
indicating the time period when 90% of this precipitation fell (i.e., the Storm Event).
2.2 Parameterization and Data Analysis
12
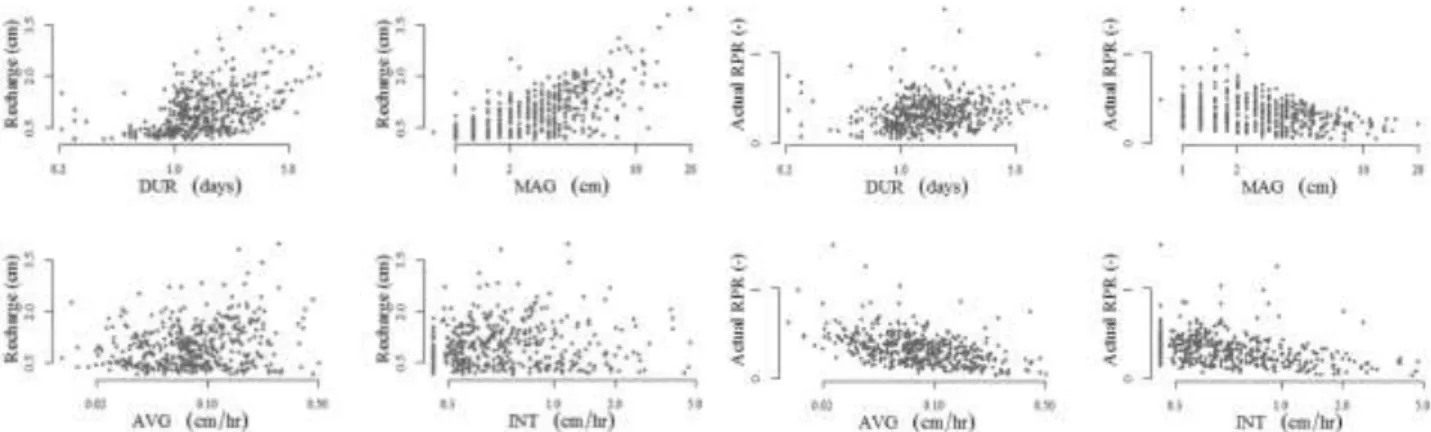
Figure 3:
Recharge and RPR values plotted against precipitation characteristics for all events at
P2 from 11/1/1989 to 10/1/2013.
location. We assigned t
pan initial value of 2.5 days then decreased this value in one hour
increments until recharge events were maximally disaggregated while precipitation windows still
contained all precipitation likely to have impacted the associated recharge event.
Although S
yhas a substantial impact on R (see equation 1) and is a major source of
uncertainty in the WTF method (Healy and Cook, 2002), accurate estimates of S
yare not
available for all sites. However, in the absence of spatial or temporal variability of soil moisture
retention characteristics, specific yield may be treated as a scaling factor. Since our objective is
to understand long-term RPR trends as a function of storm characteristics rather than to calculate
accurate estimates of actual recharge, we normalize RPR values at each location by first
13
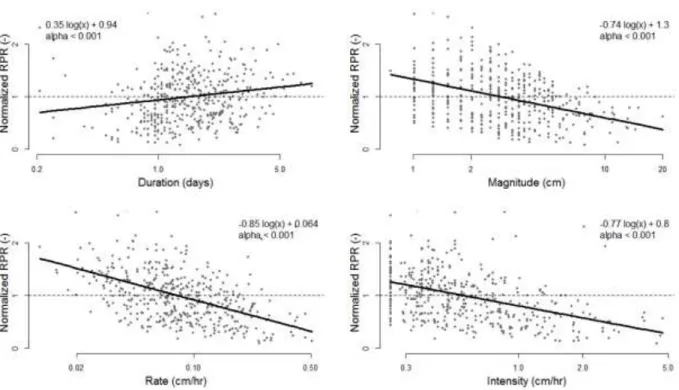
Figure 4:
Normalized RPR values plotted against precipitation characteristics for all events at P2
from 11/1/1989 to 10/1/2013. Reported alpha values represent results of both Kendall and
Spearman correlation rank tests. Dark black lines are models of logarithmic regression, the
equation of which is reported at the top of each plot.
14
events for which RPR was calculated to be negative or orders of magnitude greater than the
median for the location, which we attributed either to measurement errors in precipitation, to
water table fluctuations that overwhelmed the recharge signal, or to wet antecedent conditions
that were not accounted for in our time lag selection criteria. These isolated anomalies
represented less than 0.4% of the 3,556 events examined, leaving 3,544 individual events
suitable for analysis.
For these events, the duration of a storm event (DUR) was defined as the time period
within the precipitation window beginning after 5% of total precipitation had fallen and ending
when 95% had fallen. Therefore, the magnitude of a storm (MAG) was set to 90% of the
precipitation that fell during the precipitation window. We defined the depth to water table (DEP)
of an event as the depth in meters to the water table at t
i. While DUR, MAG, and DEP are useful
variables for assessing the impact of saturation excess runoff on recharge, to assess the impact of
infiltration excess runoff and antecedent soil moisture conditions on recharge, we derived three
additional variables: average rate of precipitation (AVG), weighted hourly intensity (INT), and
precipitation recurrence interval (RCR). We defined AVG as the mean rate of precipitation
during a storm (i.e., MAG/DUR) and INT with the following equation:
INT =
∑(AVGi)2MAG
(3)
where AVG
iis hourly rainfall rate. RCR is the length of time prior to the initiation of a storm
15
For each location, we tested values of RPR, DUR, MAG, DEP, AVG, INT, RCR, and
actual recharge (RECH) for normality using the Shapiro-Wilk test (Birnbaum and Tingey, 1951).
At 99% confidence, none of the data sets were normally distributed. Therefore, we tested the
significance of the relationships between RPR and each storm characteristic with both the
Kendall (Kendall, 1938) and Spearman (Spearman, 1904) rank correlation tests at each location.
We analyzed the change in typical RPR values along incremental increases of storm
16
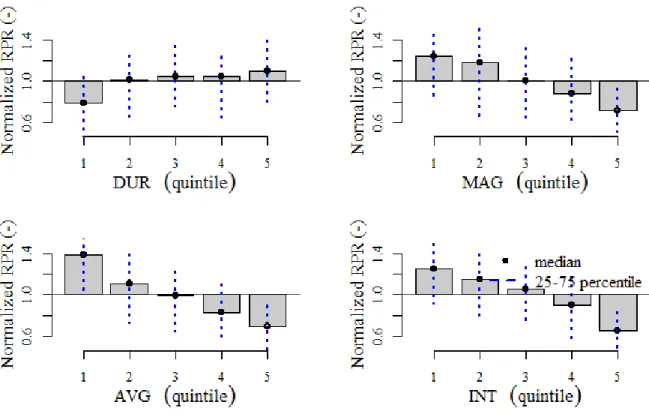
Figure 5:
RPR value to precipitation characteristics for all events at P2 from 11/1/1989 to
10/1/2013. X-axes are binned quintiles of storm characteristic values. Reported RPR values are
the median value of each quintile relative to the mean RPR value for the period of record.
At no location was RCR significantly correlated with RPR, leading to the conclusion that
the length of time between precipitation events is a poor predictor of RPR in North Carolina, so
it was excluded from further analysis. While DEP was not significantly correlated with RPR at
six of the ten locations, it showed a weak positive correlation with RPR at one location (P2) and
a weak negative correlation with RPR at three locations (C1, C2, C4). We assessed the internal
correlation of the storm characteristic variables used in this study by evaluating the r
2values of
17
independent at four locations and relatively convolved (.25 ≤ r
2≤ .51) at six locations, MAG
18
CHAPTER 3: RESULTS AND DISCUSSION
3.1 Storm Characteristics
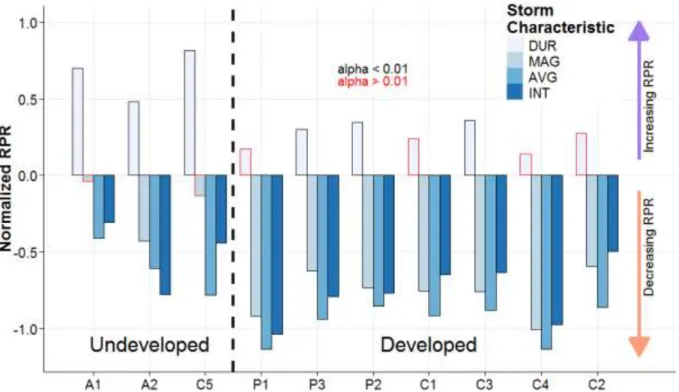
Figure 6 illustrates the relative strength of the relationships between RPR and storm
characteristics at each location. At all locations, MAG, AVG, and INT were negatively correlated
with RPR, while DUR and RPR were positively correlated. However, while the correlations
between RPR and AVG
and INT were universally significant at 99% confidence, the significance
of relationships involving DUR and MAG
was location dependent.
19
AVG exhibited the strongest negative constraint on RPR in nine of the ten locations
studied. The relative strength of this relationship was greatest in the developed locations, with
median RPR values for the first and fifth quintiles decreasing by as much as 69% (see Table 2).
The three locations where RPR values showed the weakest relationship with AVG were in areas
classified as undeveloped, with sandy or sandy loamy soils. A similar, though muted, response to
land-use type was evident in the relationship between RPR and INT.
UllA1 UslA1 UssC1 DslP1 DclP1 DllP1 DslC1 DslC2 DlsC1 DllC1
DUR 81% 72% 196% 28% 59% 62% 18% 37% 14% 24%
MAG 13% -11% -7% -48% -44% -41% -45% -41% -53% -36%
AVG -13% -44% -50% -54% -58% -51% -48% -57% -69% -55%
INT -28% -52% -62% -49% -49% -54% -40% -43% -38% -46%
Table 2:
Percent change in median RPR values of the fifth quintile to first quintile of each storm
characteristic at each location. Blue and red highlighting represent positive and negative
relationships (respectively), with darker hues indicating stronger relationships
20
also showed a strong positive response to DUR, although DUR was not the single greatest
control on RPR.
The S
yvalues we used in calculating both actual RPR and RECH are poorly constrained
and a source of major uncertainty. However, since S
yis included as a scaling factor in the
calculation of each term, the value of S
ydoes not affect the relation between actual RPR and
RECH. To examine how the relations in Figure 4 influence actual recharge amounts we compare
RPR and RECH using a linear model (Figure 7). At all locations RECH was positively correlated
with RPR with 99% confidence, though the relationship was relatively weak (r
2≤ 0.3). At the
21
22
3.2 Seasonality
23
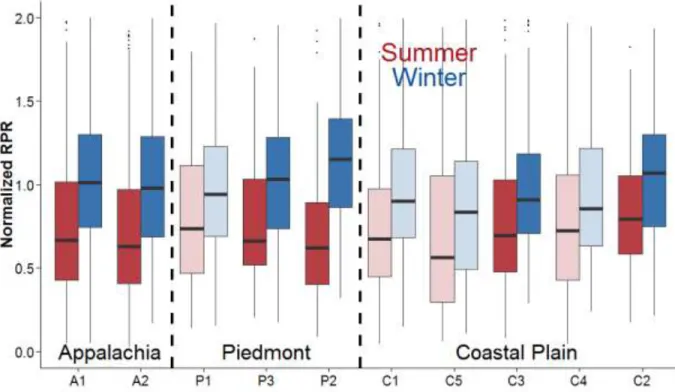
Figure 8:
Normalized RPR values of summer and winter events during the period of record for
each location. Red and blue boxes represent 25
thto 50
thpercentile RPR values during the
summer and winter, respectively. Dark boxes represent statistically significant differences
between summer and winter RPR values, and faded boxes represent seasonal RPRs that are not
significantly different. Sites are organized by geographic region.
24
25
Figure 9:
Relative sensitivity of RPR-to-storm characteristic relationships during the summer as
compared to during the winter. A value of 0.3 represents a 30% increase in sensitivity during the
summer, a value of -0.3 represents a 30% decrease in sensitivity during the summer. Sensitivity
is defined as the difference between the relative value of the scaling component of the
logarithmic model relating RPR to storm characteristic at each location during the summer and
during the winter.
3.3 Hydrologic and Seasonal Controls on RPR
Overall, our results suggest that RPR is strongly influenced by storm characteristics, and
that the nature and magnitude of that influence is somewhat influenced by the physiographic
characteristics of the landscape. These complex interrelationships are indicative of the subtle
interplay of the various hydrologic components governing interception, infiltration,
26
consider, would also contribute to the inter-site variability we observed. Regardless, careful
analysis of the EMR results reveals some insights about the dominant processes and seasonal
controls that influence episodic recharge across the southeastern United States and as well as
specific insights at each site.
Location
DUR to MAG
DUR to AVG
DUR to INT
MAG to AVG
MAG to INT
AVG to INT
P1 0.11 0.07 -0.01 0.51 0.30 0.40 A1 0.05 0.14 0.01 0.49 0.21 0.19 A2 0.04 0.21 0.00 0.32 0.15 0.11 C1 0.15 0.08 0.00 0.28 0.18 0.34 C2 0.17 0.07 0.00 0.03 0.16 0.12 C3 0.12 0.09 0.00 0.04 0.17 0.18 P2 0.07 0.14 0.02 0.36 0.18 0.32 C4 0.19 0.11 0.00 0.18 0.19 0.33 C5 0.06 0.15 0.00 0.38 0.19 0.19 P3 0.25 0.07 0.00 0.00 0.17 0.17
Mean r2 0.12 0.11 0.0002 0.26 0.19 0.24
Table 3:
Summary of r^2 values of linear models describing the relationships among all storm
characteristics at all locations.
27
development of surface seals on certain types of bare soils. Another possible explanation of this
result is that lower infiltration capacities of compacted urban and agricultural soils lead to a
greater magnitude and earlier onset of runoff, thus reducing recharge.
The relationship between MAG and RPR also illustrates the potential impact of landscape
alteration on infiltration processes in humid climates. A negative relationship between MAG and
RPR indicates that saturation excess overland flow is an important constraint on episodic
recharge. Furthermore, our finding that MAG is a powerful constraint on RPR at the developed
locations, but generally irrelevant at the undeveloped locations suggests that anthropogenic
alteration of the landscape has decreased the natural storage capacity of soils. This may be due to
a variety of factors associated with landscape disturbance and vegetation removal, including the
compaction of shallow subsurface clays, reduction of macropore and soil structures, and the loss
of relatively porous topsoil.
The positive relationship between DUR and RPR is evident across North Carolina. The
higher fractional recharge resulting from longer duration storms may be attributed to: 1)
hydraulic conductivities of soils increasing with increasing soil moisture content, allowing
enhanced drainage when rainfall intensities are sufficiently low; 2) enhancement of macropore
flow under near-saturated conditions; and 3) the filling of interception and antecedent soil
moisture stores before significant recharge can occur. However, the influence of storm duration
is notably weaker or negligible at the more developed locations, which can be attributed to both
the decrease in macropores in compacted urban and disturbed agricultural soils, and the decrease
in vegetative cover (and therefore interception capacity) at developed locations.
28
aquifers in Minnesota, where RPR is minimized at very shallow depths (< 1 meter) likely due to
a reduction in available storage and decreases with increasing depth thereafter partly due to the
attenuation of the recharge signal by the unsaturated zone. The long-term average impact of DEP
on RPR may be somewhat obscured at the locations used in this study due to the strong influence
of seasonality on RPR, with RPR being much higher in the winter (when the water table is
relatively high) and much lower in the summer (when the water table is relatively low).
While the actual values of RPR and RECH used in this analysis are poorly constrained
due to the absence of accurate estimations of S
y, it is interesting to note the character of the
relationship between them. Though RPR is not the primary constraint on RECH, the relationship
is universally positive and generally greater than one-to-one, with an incremental increase in
RPR tending to lead to a disproportionate increase in RECH. Therefore, the long-term average
decrease in RPR predicted by this analysis may substantially underestimate long-term average
decrease in actual recharge in North Carolina.
Our analysis clearly shows the somewhat expected result that RPR in North Carolina is
greater in the winter than in the summer, but we also show that recharge is more sensitive to
storm characteristics during the summer than during the winter. In the summer, fractional
recharge likely decreases due to increased canopy interception and higher rates of
29
such as interception storage and rates of evapotranspiration. Also, since summer storms that
generate recharge (e.g., hurricanes) tend to be slightly larger and substantially more intense than
winter storms, the relative impact of the various storm characteristics may be heightened during
the summer.
3.4 Contradictions, Limitations, and Future Considerations
Our results demonstrate that large, short, high intensity storms tend to generate the lowest
relative RPR, which is contrary to some previous findings that have shown a positive
30
Of course our study is not without assumptions and uncertainty. In particular, diffuse
recharge, which is not captured by the EMR method, is also important for water resources and
groundwater levels. It is likely that climate and land-use change will also subtly influence the
complex factors governing this constant rate component of recharge, particularly through
increased potential evapotranspiration. However, since there is strong evidence that climate
change will influence the size, severity, and frequency of extreme storm events (Kirtman et al.,
2013), and little is known about how this will impact recharge, we have focused on quantifying
those potential impacts first. The distance between the wells and precipitation gauges used in this
study is another potential source of uncertainty. We mitigated this uncertainty by limiting our
study to locations with exceptionally long periods of record, thereby allowing us to identify
statistically significant relationships from a large number of unique events. We suspect that
future studies using more precisely collocated wells and precipitation gauges may see stronger
(but qualitatively similar) relationships between RPR and storm characteristics. Further, though
this is the largest high-resolution study of its kind to date, ten locations remains a relatively small
sample size, and hourly precipitation data may be of too coarse a resolution to adequately
31
3.5 Implications for Water Resources
Our results suggest that lengthening summer growing seasons and an increase in the
frequency and intensity of large storms in the coming century may lead to a decline in RPR and
thus in groundwater availability across the American southeast absent increases in precipitation.
Recent studies show little evidence for large precipitation increases in North Carolina
(Sobolowski and Pavelsky, 2012). This result calls into question the foundation of the
sustainable yield concept underpinning many municipal development policies, since such
methods use static average annual recharge rates to estimate sustainable withdrawals from
shallow aquifers (e.g., Sophocleous, 2000). Furthermore, since stream baseflow is dependent on
groundwater, lower groundwater levels may also damage or destroy fragile riparian ecosystems
(Brunke and Gonser, 1997). Whether the problem of declining groundwater recharge is
ameliorated or exacerbated may hinge on future land-use policy. One potentially positive outlook
of our findings is that declining recharge in Appalachia may actually decrease the potential for
natural hazards such as landslides.
32
of precipitation on recharge deserves particular attention since 1) these characteristics play an
outsized role in governing RPR in developed environments and 2) they are likely to increase
substantially as the global climate continues to change.
3.6 Summary and Conclusions
33
APPENDIX A
ALL RECHARGE EVENTS: RAW EMR OUTPUT
A1
Episode DUR RECH MAG AVG Max PPT Rate (m/d)
1 4.118274 0.00082 0.023114 0.005439 0.048768
2 5.183138 0.007013 0.021082 0.00422 0.085344
3 6.536854 0.003691 0.046736 0.00701 0.118872
4 4.440243 0.004589 0.04445 0.009704 0.155448
5 7.255583 0.001772 0.022098 0.00298 0.112776
6 7.626181 0.002965 0.028702 0.003703 0.088392
7 7.254526 0.004587 0.051816 0.007026 0.149352
8 4.479355 0.001433 0.01778 0.003844 0.12192
9 4.144915 0.000673 0.003556 0.000829 0.021336
10 6.33654 0.001927 0.010922 0.001691 0.036576
11 6.749275 0.003555 0.061937 0.009143 0.146304
12 5.106777 0.003218 0.021844 0.004161 0.188976
13 5.497164 0.001034 0.012192 0.002167 0.064008
14 4.264108 0.000816 0.029464 0.006671 0.18288
15 3.383858 0.00066 0.072552 0.020674 0.377952
16 10.22517 0.002907 0.071882 0.006928 0.164592
17 11.20855 0.003325 0.05461 0.004819 0.09144
18 6.176571 0.004263 0.051308 0.008155 0.134112
19 10.8215 0.004323 0.031508 0.00301 0.100584
20 10.66405 0.011866 0.089408 0.008285 0.231648
21 3.667665 0.004401 0.033528 0.008843 0.073152
22 4.158003 0.00162 0.027702 0.006589 0.064008
23 5.192012 0.005448 0.048006 0.009001 0.100584
24 6.448125 0.004352 0.045466 0.006961 0.09144
25 4.774413 0.001363 0.013462 0.002738 0.064008
26 4.435281 0.000816 0.007112 0.001552 0.073152
27 11.65667 0.003282 0.0508 0.004367 0.112776
28 5.178711 0.013547 0.099314 0.018768 0.219456
29 4.270345 0.00103 0.020574 0.004658 0.0762
30 9.00891 0.002685 0.038862 0.0043 0.115824
31 5.679329 0.001555 0.034036 0.005849 0.0762
32 4.571359 0.001946 0.043942 0.009433 0.27432
33 7.032048 0.002285 0.010668 0.001489 0.051816
34 4.507116 0.000584 0.116078 0.025201 0.826008
35 5.311685 0.001138 0.030734 0.005674 0.118872
34
37 13.02558 0.01023 0.021336 0.001626 0.088392
38 11.60013 0.010038 0.154178 0.013122 0.219456
39 2.481622 0.000472 0.001524 0.000581 0.018288
40 3.474464 0.000615 0.012446 0.003473 0.085344
41 6.714931 0.001951 0.038608 0.00565 0.316992
42 7.500084 0.002455 0.028194 0.003677 0.097536
43 6.794873 0.001904 0.011684 0.001689 0.04572
44 9.857104 0.004535 0.037592 0.003759 0.109728
45 6.875285 0.001766 0.017018 0.002431 0.067056
46 7.189571 0.009696 0.052832 0.007204 0.170688
47 4.588648 0.000873 0.011684 0.00246 0.036576
48 7.297338 0.001288 0.008128 0.00109 0.018288
49 8.634852 0.001644 0.01524 0.001733 0.042672
50 4.163371 0.000706 0.01016 0.002367 0.10668
51 7.12885 0.003189 0.029972 0.004134 0.097536
52 5.29455 0.002478 0.039624 0.007315 0.176784
53 7.894387 0.001367 0.011684 0.001453 0.039624
54 5.324219 0.001308 0.044196 0.00843 0.195072
55 10.61133 0.002701 0.056896 0.005293 0.204216
56 6.144118 0.001423 0.019304 0.003089 0.067056
57 8.697799 0.002606 0.060198 0.006815 0.210312
58 6.782134 0.001627 0.019304 0.002791 0.085344
59 15.08152 0.0059 0.065532 0.004309 0.094488
60 12.06462 0.005763 0.031958 0.002744 0.082296
61 9.577023 0.004073 0.035052 0.003611 0.057912
62 3.850175 0.000803 0.005361 0.001601 0.03048
63 9.612523 0.00626 0.051562 0.005288 0.09144
64 3.9863 0.004495 0.051562 0.0129 0.082296
65 4.568006 0.003526 0.023368 0.005124 0.057912
66 6.901083 0.003747 0.04191 0.006268 0.109728
67 8.179303 0.003136 0.042164 0.005121 0.195072
68 10.95547 0.007212 0.111252 0.010038 0.490728
69 9.480095 0.005429 0.081026 0.008455 0.225552
70 4.710159 0.011493 0.077568 0.016207 0.27432
71 4.732823 0.005742 0.087122 0.01772 0.481584
72 2.258626 6.45E-05 0.018542 0.009587 0.158496
73 4.461897 0.008742 0.047244 0.010308 0.12192
74 4.300956 0.001158 0.025146 0.005693 0.112776
75 4.28369 0.00367 0.066548 0.015067 0.707136
76 7.144272 0.001238 0.065786 0.009074 0.597408
77 5.642091 0.001495 0.013857 0.00243 0.067056
78 3.622649 0.000397 0.013716 0.003658 0.04572
35
80 7.926414 0.003775 0.089916 0.011138 0.240792
81 5.25711 0.012974 0.089408 0.016716 0.094488
82 4.996644 0.00186 0.055372 0.010804 0.179832
83 4.46644 0.000852 0.017526 0.003844 0.158496
84 5.266657 0.008343 0.05842 0.010869 0.332232
85 3.382456 0.001227 0.028956 0.008295 0.094488
86 8.157567 0.003627 0.062738 0.007566 0.097536
87 13.03924 0.004594 0.0508 0.003858 0.100584
88 9.688693 0.00335 0.04064 0.004133 0.112776
89 3.635361 0.000849 0.01143 0.002982 0.04572
90 4.18232 0.001947 0.039878 0.009205 0.185928
91 4.100757 0.00343 0.044196 0.010399 0.192024
92 4.043122 0.009788 0.085344 0.020483 0.377952
93 3.166999 0.000713 0.019558 0.005942 0.0762
94 3.649685 0.001374 0.025654 0.006766 0.094488
95 4.385811 0.008649 0.10922 0.024271 0.188976
96 3.112865 0.000338 0.010668 0.003282 0.100584
97 4.737116 0.000787 0.023114 0.004782 0.13716
98 3.930181 0.003303 0.033782 0.008358 0.323088
99 3.68245 0.001564 0.032766 0.008548 0.082296
100 4.607291 0.00071 0.046736 0.009839 0.192024
101 10.96781 0.002825 0.094742 0.008516 0.277368
102 3.557758 0.000416 0.014224 0.003793 0.146304
103 8.492175 0.001899 0.018796 0.002203 0.064008
104 6.252778 0.00193 0.141478 0.022193 1.118616
105 5.936653 0.002605 0.035306 0.005804 0.21336
106 9.573129 0.007216 0.106426 0.01101 0.201168
107 4.026091 0.003013 0.042164 0.010019 0.207264
108 3.847619 0.002896 0.046736 0.01204 0.100584
109 7.123461 0.002571 0.031242 0.004309 0.176784
110 6.520943 0.00152 0.012446 0.001879 0.057912
111 8.735752 0.006821 0.077724 0.008799 0.374904
112 5.801352 0.005191 0.04699 0.007922 0.082296
113 3.801366 0.00219 0.022352 0.005647 0.124968
114 12.23711 0.003638 0.035052 0.002832 0.070104
115 6.513561 0.002403 0.032258 0.004869 0.12192
116 5.783554 0.001389 0.008382 0.001417 0.03048
117 5.351399 0.012832 0.100838 0.018474 0.283464
118 2.899584 0.000334 0.01778 0.006149 0.079248
119 5.145628 0.001447 0.019812 0.003744 0.036576
120 3.674792 0.001443 0.061976 0.016021 0.176784
121 5.39534 0.001046 0.033528 0.006217 0.143256
36
123 4.118623 0.000794 0.020828 0.004949 0.18288
124 3.092902 0.000535 0.00889 0.002771 0.039624
125 5.553801 0.001265 0.107696 0.018835 0.588264
126 4.072252 0.00066 0.016002 0.003802 0.10668
127 8.116277 0.002778 0.091186 0.011077 0.286512
128 8.459257 0.002181 0.033528 0.003918 0.064008
129 6.346285 0.002861 0.034544 0.00536 0.170688
130 4.617728 0.000913 0.001778 0.000378 0.012192
131 7.384477 0.002473 0.018542 0.002472 0.073152
132 6.732556 0.005838 0.05842 0.008554 0.204216
133 5.576423 0.010001 0.109474 0.019178 0.268224
134 12.33804 0.003403 0.047498 0.003813 0.146304
135 4.275153 0.00097 0.017018 0.004006 0.13716
136 6.675134 0.002949 0.032766 0.004824 0.18288
137 5.060613 0.001109 0.017272 0.003316 0.051816
138 7.473261 0.007677 0.075184 0.00986 0.118872
139 4.36428 0.00436 0.04318 0.009596 0.18288
140 3.854328 0.001686 0.020828 0.005153 0.10668
141 5.698764 0.00107 0.018288 0.003135 0.134112
142 6.10585 0.003427 0.071882 0.011501 0.283464
143 6.307149 0.004708 0.097028 0.015024 0.118872
144 5.36332 0.002289 0.033782 0.006142 0.231648
145 5.283022 0.001581 0.017526 0.003275 0.027432
146 4.53824 0.002658 0.051308 0.010897 0.271272
147 5.562005 0.005691 0.06477 0.011386 0.201168
148 5.981343 0.001363 0.040132 0.006552 0.204216
149 15.08322 0.008566 0.128778 0.008444 0.158496
150 3.45963 0.001251 0.025146 0.006937 0.12192
151 5.349496 0.005385 0.034798 0.006375 0.271272
152 5.040157 0.001024 0.03302 0.006391 0.115824
153 6.24605 0.004699 0.056388 0.008788 0.146304
154 3.585481 0.000818 0.014478 0.003861 0.079248
155 9.359631 0.006758 0.09398 0.009893 0.216408
156 4.501168 0.002037 0.02794 0.006041 0.124968
157 7.760639 0.011843 0.094996 0.012067 0.128016
158 2.940251 0.00032 0.013716 0.004448 0.073152
159 5.50743 0.007432 0.046736 0.008309 0.097536
160 5.00074 0.000901 0.021336 0.004163 0.100584
161 3.484263 0.000647 0.016002 0.004364 0.134112
162 8.484545 0.00179 0.032004 0.003711 0.0762
163 3.649135 0.000131 0.037405 0.010199 0.149352
164 10.95348 0.010026 0.05162 0.004678 0.158496
37
166 3.413182 0.000817 0.022606 0.006539 0.073152
167 3.654198 0.002972 0.037084 0.00978 0.170688
168 4.423015 0.002272 0.049276 0.01085 0.332232
169 3.508817 0.001358 0.006604 0.001801 0.04572
170 6.929429 0.003269 0.01651 0.002345 0.140208
171 4.274754 0.00094 0.026924 0.006096 0.0762
172 7.014846 0.001729 0.009398 0.001304 0.048768
173 6.633661 0.003643 0.062484 0.009257 0.158496
174 6.285738 0.00346 0.042926 0.006647 0.21336
175 11.90067 0.004422 0.027686 0.002299 0.048768
176 5.905773 0.002999 0.029464 0.004877 0.124968
177 4.116685 0.001899 0.02921 0.006806 0.112776
178 4.028788 0.005964 0.04064 0.009912 0.170688
179 4.883857 0.003657 0.042672 0.008534 0.12192
180 4.264217 0.009201 0.086614 0.019797 0.256032
181 4.122854 0.002444 0.03175 0.007554 0.06096
182 6.215585 0.012127 0.141224 0.02238 0.222504
183 6.917943 0.005335 0.061976 0.008801 0.24384
184 3.207631 0.000451 0.018288 0.005486 0.0762
185 7.181889 0.004217 0.09144 0.01254 0.673608
186 4.311756 0.00183 0.009144 0.00207 0.051816
187 3.592877 0.00073 0.005588 0.00149 0.027432
188 5.44332 0.00515 0.042926 0.007688 0.374904
189 3.525332 0.001039 0.049784 0.013734 0.25908
190 5.206799 0.019017 0.131572 0.024675 0.268224
191 4.57097 0.003457 0.037084 0.007876 0.268224
192 5.6613 0.001524 0.024384 0.00421 0.143256
193 8.2125 0.007789 0.060706 0.007248 0.097536
194 3.983593 0.0009 0.018542 0.004495 0.115824
195 6.335109 0.001944 0.023876 0.003697 0.16764
196 5.254077 0.00218 0.031242 0.005768 0.082296
197 4.312613 0.003156 0.051816 0.011732 0.188976
198 3.84798 0.000651 0.007366 0.001842 0.027432
199 6.142293 0.002428 0.038354 0.006096 0.268224
200 5.861059 0.010353 0.12446 0.020744 0.393192
201 5.708556 0.007135 0.048026 0.008275 0.143256
202 5.0253 0.002383 0.021336 0.00413 0.033528
203 6.279024 0.004132 0.03937 0.006155 0.231648
204 4.16789 0.000585 0.020574 0.004748 0.088392
205 5.68976 0.001312 0.059182 0.010145 0.445008
206 10.53139 0.008695 0.100076 0.009419 0.252984
207 12.65329 0.004127 0.09271 0.007248 0.234696
38
209 5.077976 0.002019 0.017272 0.003316 0.204216
210 8.13297 0.003238 0.011938 0.001454 0.051816
211 5.848848 0.012576 0.137414 0.022902 0.204216
212 5.953562 0.012165 0.146558 0.024092 0.323088
213 3.881505 0.001207 0.024638 0.006255 0.115824
214 9.610266 0.003347 0.043688 0.0045 0.109728
215 3.841861 0.003944 0.037592 0.009497 0.19812
216 5.540682 0.001194 0.02159 0.00381 0.176784
217 6.210983 0.001587 0.013716 0.002166 0.09144
218 3.608596 0.000608 0.007112 0.001897 0.036576
219 3.573874 0.00058 0.018729 0.005046 0.051816
220 6.756929 0.009136 0.05842 0.008497 0.316992
221 8.549775 0.004772 0.088646 0.010309 0.207264
222 3.47537 0.000694 0.012954 0.003616 0.0762
223 5.897622 0.002101 0.0254 0.004204 0.09144
224 4.708808 0.000803 0.019812 0.004099 0.12192
225 8.470935 0.002353 0.032766 0.003817 0.088392
226 5.798235 0.001514 0.014986 0.002678 0.118872
227 6.795507 0.004647 0.035814 0.005178 0.124968
228 5.38912 0.002234 0.002286 0.000416 0.027432
229 6.919132 0.001926 0.05461 0.007755 0.28956
230 30.21374 0.013059 0.18542 0.006113 0.384048
231 4.504587 0.00896 0.04064 0.008787 0.246888
232 4.944975 0.005356 0.04953 0.009744 0.252984
233 6.72327 0.002994 0.048768 0.007137 0.28956
234 7.452854 0.011887 0.088138 0.011623 0.161544
235 6.232286 0.002322 0.033074 0.005228 0.131064
236 4.928132 0.001311 0.019558 0.003879 0.143256
237 9.175662 0.003778 0.050038 0.005385 0.134112
238 4.323761 0.002929 0.032258 0.007235 0.09144
239 5.525131 0.002441 0.02413 0.004429 0.054864
240 3.830087 0.001227 0.016764 0.004235 0.12192
241 5.916734 0.004749 0.062992 0.010426 0.16764
242 3.874139 0.003922 0.04699 0.011747 0.131064
243 3.785811 0.001741 0.04445 0.011349 0.170688
244 4.632463 0.000789 0.040132 0.008449 0.170688
245 5.164343 0.002684 0.038354 0.007191 0.201168
246 3.646204 0.001407 0.029464 0.007771 0.128016
247 8.317617 0.003819 0.07239 0.008589 0.225552
248 4.443841 0.001274 0.048514 0.010585 0.225552
249 3.723149 0.000659 0.03556 0.009792 0.185928
250 5.167709 0.001053 0.01778 0.00336 0.094488
39
252 6.930678 0.006395 0.087122 0.012372 0.249936
253 4.900262 0.00109 0.006681 0.001378 0.054864
254 9.751189 0.004652 0.053848 0.005466 0.10668
255 9.48533 0.00974 0.125476 0.013056 0.374904
256 4.162697 0.00327 0.046482 0.011051 0.085344
257 3.900453 0.002346 0.029955 0.007493 0.112776
258 4.621047 0.001558 0.044704 0.009654 0.170688
259 4.322711 0.009599 0.055118 0.012363 0.085344
260 4.36619 0.007938 0.069596 0.01561 0.131064
261 2.52069 -0.00025 0.011176 0.004191 0.06096
262 2.276464 6.92E-05 0.011938 0.005337 0.067056
263 4.357033 0.005293 0.04572 0.01016 0.185928
264 4.823977 0.002073 0.04318 0.008882 0.103632
265 3.735851 0.000601 0.02405 0.006305 0.09144
266 3.486936 0.000526 0.017272 0.00482 0.16764
267 5.798774 0.008106 0.112014 0.018932 0.41148
268 3.523256 0.001238 0.030115 0.008675 0.097536
269 3.436131 0.000767 0.03302 0.009599 0.085344
270 3.220178 0.000387 0.01524 0.004572 0.082296
271 4.058206 0.000596 0.035814 0.00851 0.210312
272 3.720098 0.000519 0.010668 0.002753 0.057912
273 6.636453 0.001632 0.027178 0.004026 0.128016
274 4.979729 0.001095 0.026162 0.005105 0.283464
275 9.672039 0.00415 0.045212 0.004617 0.161544
276 12.63968 0.003761 0.055626 0.004363 0.109728
277 11.48485 0.003782 0.042418 0.003649 0.155448
278 7.75681 0.002775 0.019812 0.002675 0.064008
279 5.68956 0.004012 0.050292 0.008684 0.204216
280 8.588424 0.002983 0.034798 0.003996 0.109728
281 3.737259 0.00296 0.054102 0.013968 0.170688
282 6.822939 0.003004 0.03937 0.005658 0.073152
283 7.47568 0.002329 0.022098 0.002914 0.064008
284 9.868646 0.006136 0.044704 0.00447 0.094488
285 13.11711 0.004364 0.054867 0.00416 0.0762
286 5.240912 0.001263 0.03556 0.006616 0.143256
287 8.622652 0.002898 0.062484 0.007342 0.109728
288 7.289545 0.002938 0.027432 0.003763 0.0762
289 3.850175 0.000712 0.076454 0.019113 0.569976
290 21.81862 0.006544 0.116332 0.005298 0.1524
291 6.50853 0.001579 0.021336 0.0032 0.082296
292 7.618077 0.001897 0.032512 0.004195 0.115824
293 6.978123 0.004832 0.047752 0.006702 0.149352
40
295 7.586089 0.00372 0.038862 0.005042 0.134112
296 10.39932 0.006108 0.043688 0.004161 0.18288
297 14.14496 0.011129 0.093218 0.006523 0.19812
298 5.446026 0.005676 0.05588 0.010008 0.222504
299 5.913857 0.001689 0.03302 0.005465 0.0762
300 4.696955 0.001807 0.001524 0.000315 0.018288
301 5.600515 0.001086 0.011684 0.002047 0.067056
302 5.009285 0.001039 0.024618 0.005125 0.103632
303 7.358465 0.002064 0.04318 0.005757 0.13716
304 7.156471 0.004517 0.035814 0.004894 0.085344
305 7.095965 0.001713 0.059944 0.008316 0.256032
306 8.715696 0.003768 0.062484 0.007116 0.146304
307 7.879904 0.00362 0.032004 0.004001 0.088392
308 7.498259 0.005336 0.054854 0.007263 0.085344
309 7.561816 0.005087 0.043688 0.005698 0.097536
310 8.21823 0.002847 0.02413 0.002896 0.1524
311 6.657438 0.003708 0.036689 0.005395 0.12192
312 12.91335 0.006675 0.074168 0.005687 0.13716
313 4.546776 0.002999 0.037592 0.008055 0.124968
314 13.25554 0.005821 0.051816 0.003874 0.13716
315 4.560105 0.000929 0.018034 0.00383 0.179832
316 15.69908 0.004729 0.084836 0.005344 0.249936
317 8.446357 0.002578 0.005842 0.000677 0.033528
318 13.34901 0.005411 0.053594 0.00397 0.149352
319 7.341665 0.003494 0.033274 0.004461 0.094488
320 6.325241 0.001394 0.010922 0.001742 0.054864
321 9.431403 0.002411 0.035814 0.003767 0.103632
322 13.59432 0.004967 0.054864 0.004003 0.128016
323 5.063648 0.001171 0.02032 0.003901 0.124968
324 10.36148 0.007016 0.068072 0.006483 0.112776
325 7.094144 0.00201 0.02794 0.003876 0.067056
326 8.401016 0.002554 0.02159 0.00254 0.097536
327 14.25172 0.004473 0.053848 0.003746 0.079248
328 5.753582 0.001201 0.020066 0.003415 0.088392
329 7.039905 0.00213 0.026162 0.003651 0.085344
330 6.91087 0.002468 0.054102 0.007683 0.13716
331 4.691929 0.000891 0.005842 0.001209 0.012192
332 6.995206 0.005658 0.122682 0.017219 0.573024
333 3.910236 0.000778 0.023876 0.00597 0.118872
334 4.473355 0.000944 0.011863 0.00266 0.094488
335 5.677411 0.00134 0.01905 0.003269 0.09144
336 17.63893 0.008922 0.137414 0.007742 0.146304
41
338 18.23795 0.007556 0.065278 0.003561 0.094488
339 4.408441 0.003249 0.048006 0.01057 0.161544
340 13.37696 0.006753 0.076962 0.005701 0.134112
341 4.311513 0.002531 0.030988 0.007016 0.185928
342 3.897586 0.003829 0.04826 0.011941 0.252984
343 15.41931 0.010629 0.089154 0.005738 0.256032
344 5.538397 0.002402 0.027686 0.004886 0.118872
345 8.095513 0.007495 0.066548 0.008066 0.097536
346 7.239858 0.006437 0.087122 0.01188 0.21336
347 5.122647 0.008303 0.107442 0.020465 0.19812
348 9.033525 0.003079 0.055118 0.006013 0.12192
349 4.170562 0.002471 0.049784 0.0116 0.112776
350 4.167109 0.000433 0.045466 0.010764 0.134112
351 4.916096 0.005494 0.059436 0.011789 0.313944
352 4.77362 0.000967 0.024638 0.005139 0.173736
353 9.165748 0.003421 0.110236 0.011864 0.27432
354 4.208863 0.000989 0.001524 0.000352 0.006096
355 3.713619 0.000718 0.024638 0.00646 0.262128
356 4.554155 0.001407 0.00508 0.001079 0.06096
357 6.125711 0.001084 0.048768 0.007803 0.21336
358 5.481976 0.004284 0.053848 0.009573 0.371856
359 8.107119 0.001679 0.021082 0.002555 0.088392
360 6.859014 0.003073 0.03556 0.00508 0.112776
361 6.111713 0.001996 0.02667 0.004267 0.118872
362 5.502529 0.005882 0.057404 0.010205 0.170688
363 4.746364 0.000965 0.00889 0.001893 0.04572
364 13.6592 0.004612 0.049022 0.003544 0.064008
365 8.21491 0.008892 0.080518 0.009662 0.149352
366 6.554846 0.003964 0.050038 0.007506 0.13716
367 3.794073 0.000719 0.023876 0.006096 0.103632
368 6.413369 0.001741 0.022098 0.003388 0.115824
369 3.025966 0.000475 0.000508 0.000203 0.003048
370 13.78182 0.004603 0.120142 0.008633 0.231648
371 4.402377 0.000596 0.010414 0.002306 0.042672
372 10.09033 0.003244 0.06858 0.00673 0.27432
373 4.827966 0.000925 0.028956 0.00584 0.201168
374 10.40375 0.006048 0.006096 0.000578 0.036576
375 8.301473 0.00519 0.073152 0.008649 0.131064
376 3.872605 0.020246 0.118872 0.029581 0.173736
377 3.851855 0.0137 0.110744 0.027987 0.47244
378 3.38148 0.003027 0.065024 0.018578 0.210312
379 5.599097 0.002241 0.04826 0.008393 0.158496
42
381 6.019765 0.002193 0.033782 0.005515 0.09144
382 4.510444 0.000805 0.018796 0.004064 0.085344
383 6.892806 0.003072 0.043688 0.006183 0.179832
384 5.331841 0.003218 0.030988 0.005677 0.0762
385 6.545303 0.001921 0.033782 0.005036 0.231648
386 9.513183 0.002263 0.02413 0.002507 0.048768
387 11.97035 0.002897 0.045466 0.003763 0.0762
388 5.523196 0.001282 0.014224 0.00251 0.039624
389 10.07916 0.005522 0.060198 0.005873 0.13716
390 10.74872 0.003213 0.041656 0.00383 0.109728
391 7.5096 0.003398 0.032258 0.004208 0.070104
392 7.735451 0.005441 0.075438 0.009579 0.149352
393 14.05521 0.007227 0.188468 0.013304 0.420624
394 4.593989 0.003914 0.081788 0.017959 0.48768
395 3.985111 0.002717 0.022098 0.005412 0.103632
396 4.575084 0.001237 0.0635 0.013487 0.164592
397 5.273381 0.00116 0.018542 0.00345 0.067056
398 5.207297 0.002969 0.04064 0.00762 0.252984
399 8.008698 0.002402 0.03048 0.003751 0.088392
400 12.00177 0.004014 0.059182 0.004881 0.195072
401 5.93826 0.004931 0.031496 0.005177 0.057912
402 3.336081 0.001649 0.018796 0.005815 0.039624
403 4.209769 0.001272 0.019304 0.004455 0.0762
404 4.530589 0.002828 0.037592 0.008055 0.118872
405 6.62849 0.001661 0.01778 0.002634 0.143256
406 9.903377 0.004984 0.05461 0.005438 0.158496
407 4.105479 0.000605 0.011938 0.002782 0.042672
408 6.130695 0.003158 0.053086 0.008494 0.435864
409 4.06682 0.00075 0.014478 0.003475 0.048768
410 7.288755 0.003759 0.076708 0.010607 0.353568
411 5.92572 0.001506 0.091186 0.015093 0.24384
412 7.30659 0.002726 0.022606 0.003048 0.10668
413 8.287515 0.003174 0.109474 0.013007 0.637032
414 10.49798 0.006095 0.134366 0.012646 0.390144
415 4.453485 0.000849 0.019558 0.004267 0.057912
416 4.205184 0.000866 0.003968 0.000938 0.039624
417 8.531695 0.005473 0.043942 0.00507 0.109728
418 5.459148 0.002216 0.020828 0.00373 0.082296
419 6.79382 0.001573 0.045723 0.006944 0.143828
420 5.807848 0.005186 0.049022 0.008227 0.143256
421 6.93797 0.002508 0.018288 0.002595 0.04572
422 8.711866 0.006826 0.062992 0.007131 0.109728
43
424 6.856793 0.004136 0.075946 0.010785 0.262128
425 9.290994 0.007253 0.081534 0.008658 0.16764
426 6.02647 0.001654 0.042418 0.006925 0.134112
427 5.383038 0.001105 0.028387 0.005284 0.085344
428 9.117499 0.004631 0.014986 0.00162 0.079248
429 5.962398 0.001695 0.052832 0.008685 0.408432
430 4.105061 0.000757 0.000508 0.000121 0.006096
431 7.099039 0.001927 0.08636 0.011912 0.3048
432 3.975394 0.000826 0.023114 0.005631 0.067056
433 10.60712 0.003249 0.03937 0.003677 0.16764
434 6.733596 0.001649 0.013208 0.001921 0.048768
435 18.51716 0.009252 0.100076 0.005361 0.118872
436 6.185326 0.001765 0.02667 0.004277 0.128016
437 6.289707 0.001113 0.017272 0.002677 0.051816
438 5.48551 0.004872 0.0508 0.009099 0.134112
439 3.29231 0.000461 0.007874 0.002493 0.04572
440 6.595895 0.003118 0.032512 0.004847 0.204216
441 8.561406 0.006869 0.060706 0.006971 0.16764
442 6.764436 0.003086 0.04572 0.00661 0.161544
443 6.901694 0.002415 0.036322 0.005222 0.103632
444 8.841055 0.003698 0.138176 0.015424 0.4572
445 4.183727 0.000984 0.026924 0.006213 0.085344
446 7.289957 0.00467 0.082042 0.011062 0.286512
447 5.043471 0.001045 0.018288 0.003533 0.04572
448 4.036368 0.000745 0.006604 0.001611 0.039624
449 6.002986 0.006327 0.05588 0.009123 0.109728
450 10.89805 0.002996 0.010922 0.000989 0.064008
451 8.353223 0.00349 0.034798 0.004074 0.067056
452 7.615018 0.002872 0.032004 0.00413 0.079248
453 7.408916 0.006942 0.056896 0.007544 0.10668
454 7.422808 0.002437 0.040132 0.005475 0.21336
455 4.743784 0.002277 0.023876 0.004856 0.115824
456 6.469482 0.001506 0.039116 0.005942 0.173736
457 5.474574 0.006175 0.107442 0.019101 0.8382
458 5.510052 0.010481 0.04572 0.00862 0.155448
459 4.582799 0.000872 0.016764 0.00356 0.109728
460 3.757792 0.000696 0.013471 0.003507 0.054864
461 5.808508 0.001394 0.02286 0.003899 0.149352
462 9.431476 0.024138 0.156718 0.016353 0.277368
463 3.125696 0.000391 0.022352 0.007192 0.088392
464 6.437336 0.002233 0.025349 0.004333 0.103632
465 8.436084 0.005882 0.0635 0.007434 0.1524
44
467 4.466361 0.00874 0.10414 0.022517 0.16764
468 3.746425 0.001539 0.012446 0.003431 0.036576
469 4.213878 0.003608 0.052324 0.01196 0.143256
470 4.05905 0.005031 0.050038 0.012009 0.16764
471 2.879773 0.000262 0.0127 0.004215 0.033528
472 4.522405 0.010298 0.06731 0.014424 0.210312
473 3.976875 0.002289 0.042418 0.010283 0.18288
474 2.55871 0.000514 0.009652 0.003596 0.067056
475 3.974404 0.008146 0.085344 0.020901 0.316992
476 2.426507 0.000512 0.013716 0.005403 0.057912
477 4.224811 0.005817 0.052324 0.012075 0.09144
478 4.652504 0.000914 0.045466 0.009489 0.170688
479 4.289288 0.001012 0.027178 0.006154 0.128016
480 4.109581 0.001226 0.019304 0.004542 0.070104
481 4.698196 0.002362 0.03937 0.008216 0.19812
482 3.80311 0.001022 0.03048 0.007782 0.222504
483 2.738775 0.000451 0.009906 0.003446 0.082296
484 7.418355 0.004146 0.034544 0.00458 0.128016
485 4.928253 0.001931 0.015494 0.003128 0.13716
486 7.536833 0.002465 0.012192 0.00159 0.082296
487 6.564634 0.002523 0.027178 0.004051 0.115824
488 7.169649 0.005534 0.022098 0.003013 0.225552
489 3.943703 0.003872 0.026162 0.006473 0.176784
490 8.332063 0.002755 0.080264 0.009489 0.265176
491 6.089767 0.008659 0.072898 0.011742 0.25908
492 4.964758 0.001092 0.01143 0.002258 0.042672
493 5.69683 0.015336 0.120396 0.020739 0.3048
494 7.582513 0.001891 0.012192 0.001582 0.042672
495 4.411882 0.000903 0.001778 0.000391 0.012192
496 6.250481 0.001432 0.020828 0.003246 0.054864
497 8.78303 0.004654 0.049276 0.005501 0.192024
498 8.981165 0.00938 0.085344 0.009353 0.216408
499 3.860929 0.005477 0.046736 0.011684 0.161544
500 7.221736 0.002027 0.037338 0.005092 0.09144
501 4.70868 0.001352 0.027178 0.005575 0.128016
502 4.709454 0.005109 0.047244 0.009775 0.134112
503 2.625914 0.000323 0.00762 0.002771 0.033528
504 3.259795 0.000322 0.01905 0.005644 0.100584
505 3.074524 0.000544 0.010884 0.005542 0.097536
506 3.96705 0.000458 0.007874 0.001934 0.051816
507 9.173039 0.00378 0.060706 0.006533 0.338328
508 5.193914 0.004028 0.018288 0.003429 0.094488