Molecular Dynamics Simulations Study of Hydrophilic and Hydrophobic Interactions between Nanoscale Particles
Changsun Eun
A dissertation submitted to the faculty of the University of North Carolina at Chapel Hill in partial fulfillment of requirements for the degree of Doctor of Philosophy in the
Department of Chemistry.
Chapel Hill 2010
Approved By: Prof. Max Berkowitz Prof. Chris Fecko Prof. Andrew Moran
ABSTRACT
Changsun Eun: Molecular Dynamics Simulations Study of Hydrophilic and Hydrophobic Interactions between Nanoscale Particles
(Under the direction of Max L. Berkowitz)
This dissertation presents our research on hydrophilic and hydrophobic interactions performed using molecular dynamics (MD) simulations with nanoscale
model plates. Hydrophobic and hydrophilic interactions have been discussed in many places of chemistry and biology to explain water-involved phenomena such as solute aggregation and protein folding. However, until recently, the absence of appropriate methodology and insufficient computing power has prevented quantitatively detailed
discussions of these phenomena. In this dissertation, we design model hydrophilic and hydrophobic plates and use MD methodology to study the nature of the hydrophobic and hydrophilic interactions. These plates are simple enough to be computationally accessible but still applicable for understanding the essence of hydrophobic and hydrophilic
phenomena in nature. Since the hydrophobic and hydrophilic interactions are considered to be medium effects involving water molecules, we extract this medium contribution from the total interaction between two plates in water and analyze it. This analysis is applied to the case of two interacting model lipid plates across water and it demonstrates
indicate that strong plate-water interaction is responsible for the repulsive water-mediated interaction. Interestingly, when we remove electric charges from the model lipid plate,
the repulsive character due to water changes to the attractive character and the overall shape of the total interaction is very similar to typical hydrophobic interaction. We investigate the hydrophobic property of the charge-removed model lipid plate by comparing it with other hydrophobic plates based on the graphene plate model. From this
ACKNOWLEDGEMENTS
First of all, I would like to express my sincere gratitude to my advisor Prof. Max L. Berkowitz for his continuous support, guidance and encouragement through my Ph.D. study. He has always been a great advisor to me. I learned many things from him including a professional attitude in research, and how to think scientifically, to perform
research and to write papers. Without him, none of this work presented in this dissertation would have been possible.
I would also like to thank my committee members, Prof. Chris J. Fecko, Prof. Andrew M. Moran, Prof. Lee G. Pedersen and Prof. Sergei S. Sheiko for useful
suggestions and their help. They have been always friendly to me and I appreciate their encouragement.
Next, I would like to thank all past and present group members, especially Dr. Zhancheng Zhang and Dr. Charles Davis. I have always been pleased to discuss scientific
problems with Zhancheng and Charles, and they always gave me many useful and insightful ideas. Above all, they have all been really good friends throughout my Ph.D. I would also like to thank Dr. Sheeba Irudayam and Dr. Jhuma Das. In addition to their help and useful suggestions on this dissertation, they have provided an enjoyable work
I would like to thank my close friends in Chapel Hill. Dr. Ralph House has always been a good friend and I really appreciate his friendship. I would also like to thank Will
and Jessica Alexander. I have been very lucky to know them. They always support me and help me a lot in many ways. I will never forget my friendship with them. I also must thank my Korean friends in the chemistry department, particularly Dr. Chang Jun Lee, Dr. Sangwook Wu, Dr. Jae Ho Shin, Dr. Jinwoo Park, Dr. Doo-Hyun Ko, Dr. Wonhee Jeong,
Dr. Sungjin Park, Myoung-Ryul Ok, Ahyeon Koh and Soo Yeon Sim. Without them, my life in here would not be the same. I thank all other people at Chapel Hill who have interacted with me.
Finally, I would like to express my sincere love and my deepest gratitude to my
TABLE OF CONTENTS
Page
LIST OF TABLES ... xi
LIST OF FIGURES ... xii
ABBREVIATIONS ... xv
Chapter 1:Introduction ... 1
1.1 Scope of our study ... 3
1.2 Goal of our study ... 5
1.3 Model systems in our study ... 6
1.4 Outline of the dissertation ... 8
Chapter 2: Origin of the Hydration Force: Water-Mediated Interaction between Two Hydrophilic Plates ... 12
Abstract ... 13
2.1 Introduction ... 14
2.2 System and Computation Details ... 16
2.3. Results and Discussion ... 19
2.4 Conclusion ... 34
Appendix ... 37
Chapter 3: Thermodynamic and Hydrogen-Bonding Analyses of the Interaction between Model Lipid Bilayers ... 39
Abstract ... 40
3.2 System and Computational Details ... 46
3.3 Results and Discussion ... 49
3.3.1 Thermodynamics ... 49
3.3.2 Hydrogen bonding analysis ... 54
3.4 Summary and Conclusions ... 64
Chapter 4: Fluctuations in Number of Water Molecules Confined between Nanoparticles. ... 67
Abstract ... 68
4.1 Introduction ... 69
4.2 Methods... 73
4.3 Results and Discussion ... 75
4.4 Conclusion ... 83
Chapter 5: Molecular Dynamics Simulation Study of Interaction between Model Rough Hydrophobic Surfaces. ... 86
Abstract ... 87
5.1 Introduction ... 88
5.2 Methodology ... 93
5.3 Discussion ... 96
5.3.1 Role of electrostatic interaction in hydrophilic interaction ... 96
5.3.2 Hydrophilic interaction vs. hydrophobic interaction ... 99
5.3.3 “Carbon” plates as reference hydrophobic plates. ... 102
5.3.4 Hydrophobicity of the charge-removed PC-headgroup plate ... 105
5.3.7 Role of local flexibility due to non-polar headgroups ... 122
5.4 Summary and Conclusions ... 126
LIST OF TABLES
Page
Table 3-1. Contribution (in percentage) of each oxygen atom of the phosphates that are involved in the hydrogen bonding network as a function of interplate distance. ... 63 Table 4-1. Summary of the main results from our simulations related to the character
of interaction between “carbon” plates in water and liquid-vapor equilibrium in the confined space between the plates. ... 84
LIST OF FIGURES
Page
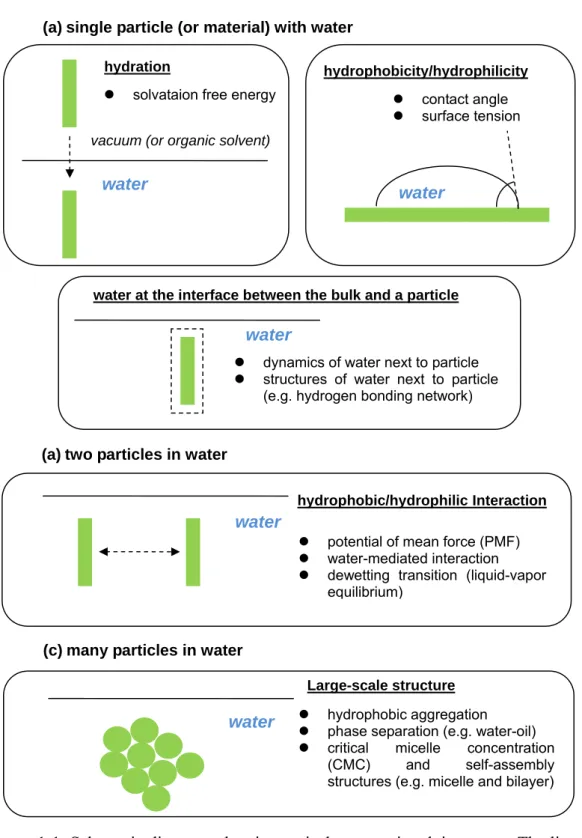
Figure 1-1. Schematic diagrams showing typical systems involving water ... 4
Figure 1-2. Schemactic of the model systems employed in our study... 7 Figure 2-1. Snapshot of the two PC−headgroup plates in water at an interplate
distance of 2.4 nm. ... 16
Figure 2-2. (a) PMFs between two PC−headgroup plates in water and in a vacuum as a function of the interplate distance defined as the distance between two graphene plates. (b) Logarithm of the PMF in water against the interplate distance. ... 20 Figure 2-3. Best fits for the three distinct regimes of the logarithm of PMF obtained
by a nonlinear curve fitting. ... 22 Figure 2-4. Number of water molecules in the interplate space, as a function of the
interplate distance. ... 23
Figure 2-5. Number of water molecules in the interplate space, as a function of the interplate distance. ... 25 Figure 2-6. Superposition of the density profile of water and the distributions of
COM of three end carbons of choline and COM of phosphate are shown in the top panels at different interplate distances of 2.00 nm (a), 1.40 nm (b), 1.20 nm (c), and 0.90 nm (d) and the distributions of the OH bond orientation of water molecules in the bottom panels at the corresponding distances. ... 28 Figure 2-7. Snapshots of the interplate space at 1 ns of the trajectory at an interplate
distance of 2.00 nm (a), 1.40 nm (b), 1.20 nm (c), and 0.90 nm (d). ... 32 Figure 3-1. (a) Schematic diagram of our model system with associated length scales.
(b) Snapshot of the PC-headgroup plates. (c) Detailed structure of the PC headgroup. ... 43 Figure 3-2. Decomposition of the PMF into contributions from the direct interaction
and from the water-mediated interaction. Inset is for large interplate distances. ... 45 Figure 3-3. (a) Enthalpic and entropic contributions to the PMF. (b) Decomposition
water-mediated interaction. (c) Decomposition of the entropic contribution into the direct interaction and the water-mediated interaction. ... 50 Figure 3-4. Potential energy contribution involving water molecules, further
decomposed into the following two terms: potential energy of interaction between the PC-headgroup plates and water and potential energy of interaction between water molecules. ... 53 Figure 3-5. (a) Average number of hydrogen bonds between the PC-headgroup
plates and water as a function of interplate distance. (b) Average number of hydrogen bonds between water molecules as a function of interplate distance. ... 56
Figure 3-6. Profiles of the number of hydrogen bonds per water molecule at the interplate distances of 2.8 (a), 2.4 (b), 2.0 (c), 1.6 (d), 1.2 (e), and 0.8 nm (f). ... 58 Figure 3-7. Profiles of the numbers of hydrogen bond donors and acceptors per
water molecule at the interplate distances of 2.8 (a), 2.4 (b), 2.0 (c), 1.6 (d), 1.2 (e), and 0.8 nm (f). ... 60
Figure 4-1. (a) Total PMF
Δ
G R
( )
, direct interaction contributionU R
( )
and water-mediated interaction contributionδ
G R
( )
as a function of distance between “carbon” plates. (b) Water-mediated interaction contributions into the PMFs. ... 77Figure 4-2. Number of water molecules as a function of time for the cases of CC
ε =0.3598 (a), 0.15 (b), 0.10 (c) and 0.05 kJ/mol (d) for different values of the interplate distance. ... 79 Figure 4-3. (a) Normalized water number fluctuations in the space next to a single
plate for different values of εCC . (b) Normalized water number fluctuations in the confined space between plates. ... 82 Figure 5-1. Decomposition of the PMF into contributions from the direct interaction
and from the water-mediated interaction between two PC-headgroup plates (a) and between two charge-removed PC-headgroup plates (b). ... 97 Figure 5-2. Contributions of electrostatic and Lennard-Jones interactions to the
potential energy interaction between the PC-headgroup plates and water molecules. ... 98 Figure 5-3. (a) Average number of water molecules in the confined space between
Changes in the number of water molecules in the confined space as functions of time at the distances of 1.82 nm, 1.79 nm, 1.74 nm and 1.7 nm. (c) For the case of an interplate distance of 1.79 nm, two snapshots taken at t = 3500ps and t = 7800ps ... 102
Figure 5-4. (a) PMF, direct interaction, and water-mediated interaction of “carbon” (graphene-like) plates with different water-plate interaction strength. (b) The PMF, its components and the number of water molecules as a function of distance between CRPC plates ... 105 Figure 5-5. Plate-water Lennard-Jones (LJ) interaction. ... 108
Figure 5-6. Schematic diagrams showing an inverse correlation between the changes in ΔGV :≡Gwater−mediated(d) and N (d), in the cases of μex(d)=μbulkex
(a), ex
bulk
ex μ
μ (d)> (b) and ex bulk
ex μ
μ (d)< (c). ... 114
Figure 5-7. Water number density profiles for the systems containing the CRPC plate (a) and “carbon” plates (b). ... 118 Figure 5-8. Profiles of the number of water molecules represented by oxygen atoms,
the center of mass (COM) of three end carbons of cholines, and the COM of phosphate along the z axis of four cases. ... 120
Figure 5-9. (a) Snapshots taken at 1 ns for some selected interplate distances. (b) xy-dimensional radial distribution functions of the red united carbon atoms of the bottom plate, with respect to the blue united carbon atom of the top plate. (c) Schematic diagrams for explaining why direct interaction has a small barrier between1.3 nm and 1.5 nm ... 124 Figure 5-10. Snapshots taken at 1 ns for a water nanodroplet on the PC-headgroup
ABBREVIATIONS
Å Angstrom
CNT Carbon Nanotube
COM Center of Mass
CP Choudhury and Pettitt
CRPC Charge-removed phosphatidylcholine-headgroup DPPC Dipalmitoylphophatidylcholine
fs Femtosecond(s)
ΔG Change in Gibbs Free Energy
ΔH Change in Enthalpy
k (or kB) Boltzmann Constant
K Kelvin kJ Kilojoule(s) LJ Lennard-Jones
MD Molecular Dynamics
mol Mole(s)
MR Marcelja and Radic
nm Nanometer(s) NPT Constant Pressure Simulation ns Nanosecond(s)
NVT Constant Volume Simulation
POPC Palmitoyloleoylphosphatidylcholine ps Picoseond(s)
ΔS Change in Entropy
SPC/E Simple Point Charge/Extended
PMF Potential of Mean Force T Temperature
Chapter 1: Introduction
Water is the most abundant molecule in living organisms and it is believed to be essential for all living systems. Molecular-level studies have shown that water plays a
very crucial role as a solvent or a biomolecule in biological processes and structuring biological systems.1-3 Microscopically, water can interact with individual biomolecules and affect their structure4-6 or dynamic behavior.7-10 It can also mediate the interaction between two biomolecules, as in protein-DNA11 and protein-ligand interactions12. In
particular the latter water-mediated interaction can induce large-scale molecular assemblies such as multiprotein complex13 and micelle/cell membrane14, which are very crucial components in living cells. However, the fundamental principles governing these water-involved interactions have not yet been fully understood at the molecular level. For
example, the prediction of three-dimensional structure of proteins from amino acid sequences, in which water-involved interaction plays an important role,6 is still a challenging problem.15 The reason for this difficulty probably comes from the many-body
One of the ways to simplify this complication would be to define particles (or molecules) as hydrophobic (“water-fearing”) or hydrophilic (“water-loving”) particles.
For example, instead of particle-water-particle interaction, we regard the interaction as hydrophobic particle-hydrophobic particle interaction, or hydrophilic particle-hydrophilic particle interaction and so on. In this way, we can reduce a many-body problem to a two-body problem. Thus, it is important to characterize whether a particle is hydrophobic or
hydrophilic.
There are two common ways to determine the hydrophobicity/hydrophilicity of a particle. One way is to measure the contact angle of a water droplet on the surface of the particle and the other is to determine the solubility (or the solvation free energy) of the
particles. If a particle is large and flat enough, it would be ideal to perform the contact angle measurement, but otherwise, the measurement of solubility would be ideal. These methodologies with the concept of hydrophobicity/hydrophilicity have proven to be useful, particularly in macroscale experiments. However, practically, when the size of the
system is reduced to the nanoscale level as in biomolecules in water, it is hard to use the above methods to determine the hydrophobicity/hydrophilicity.16,17 Thus, hydrophobic and hydrophilic concepts are not well-defined at the nanoscale level and the boundary between them is vague in some cases; for example, CNT (carbon nanotube), which is
commonly believed to be hydrophobic because of the non-polar atoms, can be regarded as hydrophilic in that it can hold water molecules inside it.18 Moreover, at such a microscopic scale, the interaction between a particle and water, determining hydrophobicity/hydrophilicity, is highly dependent on the molecular details such as the
atoms,20 and the local geometry of the particle.21 Complicating maters further, the behaviors of a particle in water depend on the presence/absence of other particles in the
system. For example, water molecules between two plates could be depleted as in hydrophobic cases, although each separate plate shows wetting next to the plates.22
The complex nature of hydrophobic and hydrophilic phenomena at the atomic scale raises many scientific issues and has broadened the research field. Finding out what
molecular properties of a particle cause hydrophobic or hydrophilic behavior, as well as making more clear and explicit definitions of hydrophobic/hydrophilic interactions are some of the important issues in this field that have yet to be resolved. In this dissertation, we study these issues systematically with model systems.
1.1 Scope of our study
The research fields associated with water are very broad and each field is a huge subject. Even within the field of physical chemistry, for example, research areas include
water structures in phase diagram, the dynamics of water next to a hydrophobic particle, the kinetics in the aggregation of hydrophobic particles, and other topics. Thus, we need to clarify the scope of our study. Here, we are mainly interested in the interaction between two nanoscale particles in water, as shown in Figure 1-1b. Although this type of
hydration
(a) single particle (or material) with water
z solvataion free energy
hydrophobicity/hydrophilicity
water
z contact angle z surface tension
water
(a) two particles in water
hydrophobic/hydrophilic Interaction
z potential of mean force (PMF) z water-mediated interaction z dewetting transition (liquid-vapor
equilibrium)
water at the interface between the bulk and a particle
z dynamics of water next to particle z structures of water next to particle
(e.g. hydrogen bonding network) water
vacuum (or organic solvent)
(c) many particles in water
Large-scale structure
z hydrophobic aggregation z phase separation (e.g. water-oil) z critical micelle concentration
(CMC) and self-assembly structures (e.g. micelle and bilayer) water
water
Figure 1-1. Schematic diagrams showing typical systems involving water. The list with bullet points indicates the physical properties or phenomena of interest from a physical
1.2 Goal of our study
Our primary goal is to understand the interaction between two nanoscale particles in water from a unified viewpoint. This requires the unification of the hydrophobic and hydrophilic interactions, which traditionally have been studied separately, into one single
framework. In order to do that, we adopt Ben-Naim’s definition of hydrophobic interaction defined by the attractive water-mediated interaction23 and extend it to the discussion of hydrophilic interaction. We then apply this definition to our model study. As an example of hydrophilic interaction, we first reexamine an old problem about the
origin of repulsive hydration force acting between two zwitterionic lipid bilayers.24,25 This study also resolves the controversy in the origin of the repulsion as to whether it is due to the structured water or the molecular protrusion.26,27 Then we devise a hydrophobic case derived from the lipid bilayers. This allows us to directly compare both
cases of hydrophobic and hydrophilic interactions in one model system.
However, this hydrophobic model is not a typical hydrophobic particle in that the model surface is rough. Thus, we consider a second system, a smooth-surface graphene
plate, as a more common type. The goal of the study with graphene is to systematically investigate the nature of hydrophobic and hydrophilic interactions between two plates as a function of the strength of water-graphene interaction. For this study, we use a smaller size of graphene plate, compared to the hydrophobic model lipid bilayer, to reduce the
The final objective is to understand the effect of the roughness of the surface on the hydrophobic interaction between two particles, by comparing the cases of the
hydrophobic model lipid bilayer and the “graphene” plate.
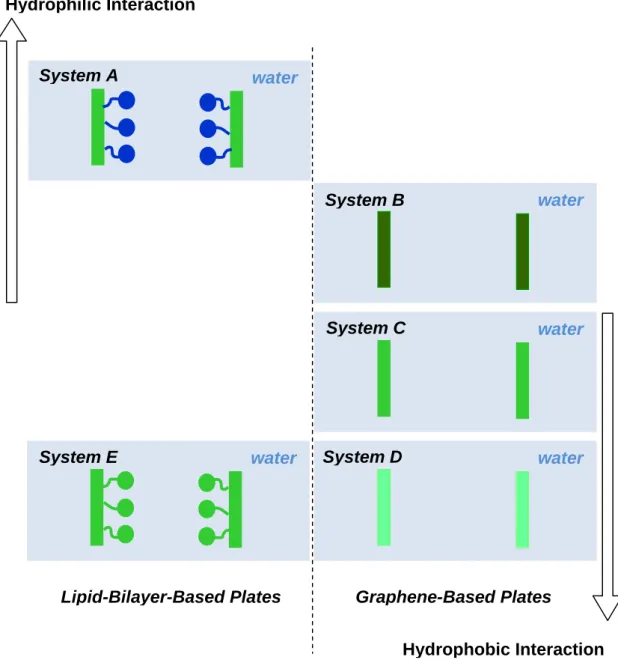
1.3 Model systems in our study
In this dissertation, we design multiple model systems for different purposes of
study. But basically, they can be categorized into two groups as demonstrated by the two columns of Figure 1-2. In Chapters 2 and 3, we use a model lipid bilayer named the PC(Phosphatidylcholine)-headgroup plate, a hydrophilic plate which has polar headgroups. This is shown in System A of Figure 1-2. This plate is used for the study of
the origin of the hydration force. In Chapter 4, we use graphene-based carbon plates shown in Systems B, C and D of Figure 1-2 for the study of hydrophobic and hydrophilic interactions. In Chapter 5, along with the above systems, we additionally prepare the hydrophobic plate simply by removing charges from the PC-headgroup plate,
Hydrophilic Interaction
water
water
water
water
water
Hydrophobic Interaction
Lipid-Bilayer-Based Plates Graphene-Based Plates
System A
System B
System C
System D System E
Figure 1-2. Schemactic of the model systems employed in our study. The plates in Systems A and E are based on a lipid biayer and the plates in Systems B, C and D are on graphene. Note that polar and non-polar parts are represented by blue and green colors,
1.4 Outline of the dissertation
The initial motivation of our research is to understand the origin of the “hydration force,” a repulsive interaction between zwitterionic lipid bilayers.24,25 This origin has been explained by two prevailing theories. One theory is that the origin is due to the
structured water molecules next to the lipid bilayers and the other one is that it is due to the protrusion of the headgroups of the lipid molecules. However, which one of these theories is correct still remains unclear, and only some indirect experimental evidence supporting the origin due to water exists.28 Thus, to resolve this issue clearly and to get a
more detailed molecular insight, we use molecular dynamics (MD) methodology. The recent advances in computational methodologies and computing power allow us to revisit this relatively old problem about the origin of the hydration force. Chapter 2 and Chapter 3 are devoted to this study.
In Chapter 2, we describe the details of our MD simulations and the model lipid bilayer plate used in the study, which is a simplified representation of the original lipid bilayers for computational advantage. First, we make sure that this model plate can
reproduce the characteristics of repulsive interaction observed in experiments. Then to understand the origin, we separate the interaction, or the potential of mean force (PMF) as a function of the interplate distance, into water-mediated interaction and direct interaction. Also, we investigate the structure of the confined space between model plates
In Chapter 3, we continue to the discussion of the origin of hydration force in terms of thermodynamics. To determine if the origin is entropic or enthalpic, we perform
thermodynamic analysis by decomposing the PMF into entropic and enthalpic components. Additionally, we consider the correlation between this thermodynamic change and the change in hydrogen bonding analysis by conducting hydrogen bonding analysis.
In another view, the interaction we study in Chapters 2 and 3 could be considered as the interaction between hydrophilic surfaces. Interestingly, this allows us to study another type of interaction, hydrophobic interaction. By noting that the hydrophilicity of model plate comes from strong electrostatic interaction between the plate and water, we
are able to prepare a hydrophobic plate by simply removing all the charges from the plate. Thus, we study the hydrophobic interaction between charge-removed model lipid bilayer plates. However, since this charge-removed plate is unique in that it has non-polar lipid headgroups, we also study how the roughness of the surface due to the non-polar
headgroups affects the hydrophobic interaction by comparing it to the interaction between the corresponding plates without the headgroups, or smooth plates. These smooth plates are graphene plates or the hydrophobic plates derived from the graphene plates by reducing the interaction parameter between water and the plate. However the
space, before we discuss the hydrophobic interaction of charge-removed plate in Chapter 5.
Chapter 4 investigates the hydrophobic and hydrophilic nature of the interaction between “graphene” plates, by calculating the PMF and the average number of water molecules in the confined space between two plates. Particularly, the latter is associated with the phenomenon known as dewetting transition. For a systematic study, we prepare
a series of “graphene” plates: strong hydrophobic, weak hydrophobic and weak hydrophilic plates by adjusting the strength of the interaction between water and the plate. Besides the attractive nature of water-mediated interaction, the large fluctuations in water structure next to hydrophobic solutes is known as one of the hydrophobic effects. In this
chapter, we apply this idea to study the hydrophobic interaction and we examine this property of fluctuation of water molecules between two plates, as a possible measure of the hydrophobic interaction. We discuss and summarize the changes in the characteristics of the PMFs as well as water number fluctuations in the interplate space, as functions of
the water-plate interaction.
In Chapter 5, we focus on the hydrophobic interaction between the model lipid plates when all the charges of the plates are removed. First, we carry out the PMF calculation to show that the (water-mediated) interaction is attractive, which is the
Chapter 2:
Origin of the Hydration Force: Water-Mediated Interaction between Two Hydrophilic Plates
Changsun Eun and Max L. Berkowitz
Department of Chemistry, University of North Carolina at Chapel Hill, Chapel Hill, North Carolina, 27599
Published in the Journal of Physical Chemistry B, 113, 13222-13228 (2009)
Abstract
We performed molecular dynamics simulations on systems containing
phosphatidycholine headgroups attached to graphene plates (PC−headgroup plates) immersed in water to study the interaction between phosphatidylcholine bilayers in water. The potential of mean force (PMF) between PC−headgroup plates shows that the interaction is repulsive. We observed three distinct regimes in the PMF depending on the
2.1 Introduction
Initial measurements of the interaction force acting between lecitin bilayers
demonstrated that this force is repulsive and that it could be fitted by an exponential function with the characteristic exponential decay length, λ, which was in the range of 3 Å.24 This length scale inspired the idea that the nature of the force originated from the presence of water molecules between the bilayers and that it was due to the induced
orientational polarization of water. For this reason, the force was named the hydration force.24 Subsequent experiments questioned the original idea that the total force has its origin in water only; instead, they indicated that just a part of the force has. Thus, according to McIntosh and Simon,28 the repulsive force acting between phospholipid
bilayers in water has three components: steric, hydration, and undulation. The steric component is dominant at short separations between membrane surfaces (when the fluid space between bilayers is below 0.4 nm), the hydration component is dominant at intermediate separation distances (0.4−0.8 nm), and the undulation component is
dominant at larger separation distances (above 0.8 nm). The Marcelja and Radic phenomenological theory29 initiated a series of theoretical papers where an attempt was made to clarify the nature of the hydration force.25,30-35 In some of the work, the idea that the force has a hydration component has been completely abolished; instead, it was
proposed that the repulsive force acting between lipid bilayers is due to the protrusion of lipid molecules.26 Computer simulations were also performed to study the nature of the force.36-38 Simulations of water next to lipid bilayers showed that indeed water in the vicinity of the bilayers was polarized and that this polarization did not propagate over a
to the one obtained from the experiments of McIntosh and Simon. Simulations using the grand canonical Monte Carlo ensemble were performed to calculate the force as a
function of distance at short distances.38,39 Due to the complexity of the system, it was observed that it is not simple to separate the total force into components and that the values of the components were strongly depending on the force field used. To eliminate such complexity and in search for generic features related to the influence of water on the
interaction between hydrophilic surfaces, Lu and Berkowitz proposed a simplified system where they represented a bilayer as a graphene plate and “dressed” up the plate with physical dipoles to represent the zwitterionic character of lipid molecules.40,41 Although Lu and Berkowitz were able to illustrate some of the theoretical predictions that the force
depends on the distribution of dipoles on the surface of the bilayer,42 the major shortcoming in their model was the rigid character of the dipoles. In this chapter, we present simulations that, although again are performed on a simplified model of a bilayer, are done using a more realistic model, where the headgroups of lipids are faithfully
2.2 System and Computation Details
We prepared our model phospholipid membrane surface by attaching 9
phosphatidylcholine (PC) headgroups to a graphene plate composed of 252 carbon atoms with a distance of 0.14 nm between the carbon atoms. The oxygen atom at the end of the phosphate group was bonded to the carbon atom of the graphene plate, but otherwise, the PC headgroup could freely move (see Figure 2-1). The graphene plate dimensions we
used are 2.425 nm by 2.380 nm, so that the area per headgroup is 64 Å2.
previously used to calculate the PMF between two graphene plates in water.43 Therefore, the states of the system were defined by this interplate distance, which was changed from
0.70 to 3.00 nm with an interval of 0.01 nm. The Gibbs free energy change between two adjacent states specified by r1 and r2 at a given temperature T was calculated on the basis
of the following formula assuming that the state of
r2 is slightly perturbed from the state of r1. Here, kB is Boltzmann’s constant and U is the
potential energy of the system. The bracket denotes an ensemble average with respect to
the reference state of r1. Since, equivalently, the r1 state can be considered as a perturbed state from the state r2, we also calculated Δg2 and took an average of Δg1 and Δg2 for the final Gibbs free energy change between the two states. Finally, by summing up all of these changes from a reference state to a given state defined by the interplate distance r
and assuming the PMF at the largest distance to have a value of zero, we obtained the PMF as a function of interplate distance. The relation between the free energy and the force acting between the plates is given by f = −∂g/∂r.
In order to evaluate the potential energies of each state and their perturbed states
for the PMF calculation and to calculate other physical quantities such as density profiles of water, we carried out a series of MD simulations under NPT conditions. For each interplate distance, the two prepared PC−headgroup plates were placed around the center of a cubic simulation box at a designated interplate distance and subsequently solvated by
saved every 1 ps, and a time step of 2 fs was used. The temperature and the pressure were maintained at 298 K by a Nose−Hoover thermostat44,45 and 1.0 bar by a
Parrinello−Rahman barostat,46 respectively. The coupling time constants for both are 0.5 ps. The particle mesh Ewald method47 with a cutoff length of 0.9 nm was used for the electrostatic interaction, and the same cutoff length was also used for the van der Waals interaction. The SPC/E model was employed for water.48 The force field for the
phosphatidycholine headgroup was based on the palmitoyl-oleoyl-phosphatidylcholine (POPC) force field from the Tieleman group (http://moose.bio.ucalgary.ca/index.php?page =Structures_and_Topologies), and that for
the graphene was from the G43a1 force field defined in GROMACS.49 For vacuum
2.3. Results and Discussion
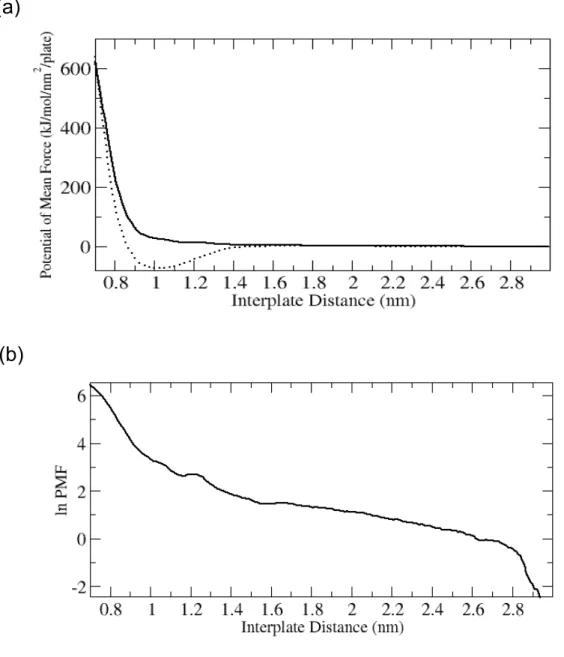
The calculated PMF as a function of the interplate distance between the
PC−headgroup plates is shown in Figure 2-2. As we can see from this figure, the plates repel as the distance between them decreases. We also display the curve for the interplate interaction when the water is not present in the system. In this case, the interaction has a minimum at a distance around 1 nm, predicting a stable associated state. The observed
repulsive interaction between the plates immersed in water is opposite in character to the so-called hydrophobic interaction, the interaction between hydrophobic particles in water.50 In our system, containing PC−headgroup plates in water, each headgroup is charge neutral, but the charge distribution produces a nonzero dipole moment. Because of
Figure 2-2. (a) PMFs between two PC−headgroup plates in water (solid line) and in a
vacuum (dotted line) as a function of the interplate distance defined as the distance between two graphene plates. The PMFs at the largest separation of 2.99 nm are set to zero. The original PMF values are rescaled by dividing them by the area of the plate and the number of plates. (b) Logarithm of the PMF in water against the interplate distance.
(a)
From Figure 2-2, we can see that our PMF curve can not be fitted to a single exponential function. Following the ideas from the experiment, we attempted to fit it
piece-wise and noticed that three distinct fitting regimes exist, as illustrated in Figure 2-3: a regime at small interplate distances (0.75−1.00 nm), intermediate interplate distances (1.00−1.60 nm), and large interplate distances (1.70−2.40 nm). In the small interplate distance regime, the PMF can be fitted to an exponential function exp(−x/λ) with a
characteristic constant λ = 0.809 Å. In the intermediate interplate distance regime, the PMF is also well fitted with an exponential function, but with a larger lambda, 2.95 Å. In the third, large distance regime, the PMF can also be fitted to an exponential with λ = 7.82 Å. Since the relationship between the force f and the PMF g is f = −∂g/∂r, the forces
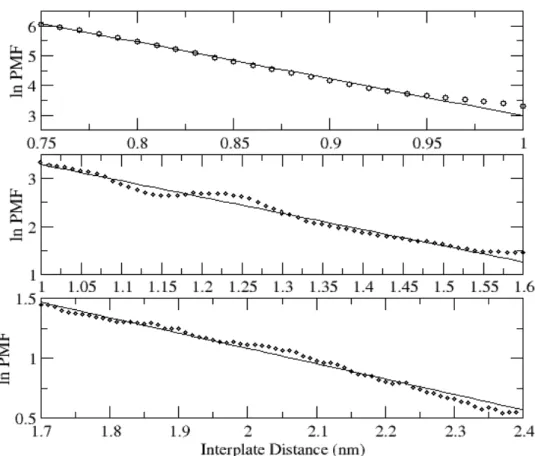
Figure 2-3. Best fits for the three distinct regimes of the logarithm of PMF obtained by a
nonlinear curve fitting. The circles are the log PMF values for each interplate distance. To get high correlation coefficients, we considered the data from 0.75 nm for the small interplate distance regime (top panel) and we did not include the data between 1.6 and 1.7 nm, which corresponds to the boundary region between the intermediate interplate
distance regime (middle panel) and the large interplate distance regime (bottom panel). In addition, we excluded the data beyond 2.40 nm for the large interplate distance regime. The correlation coefficients for the small, intermediate, and large interplate distance regimes are 0.99, 0.98, and 0.99, respectively. From the fitting curves, the characteristic
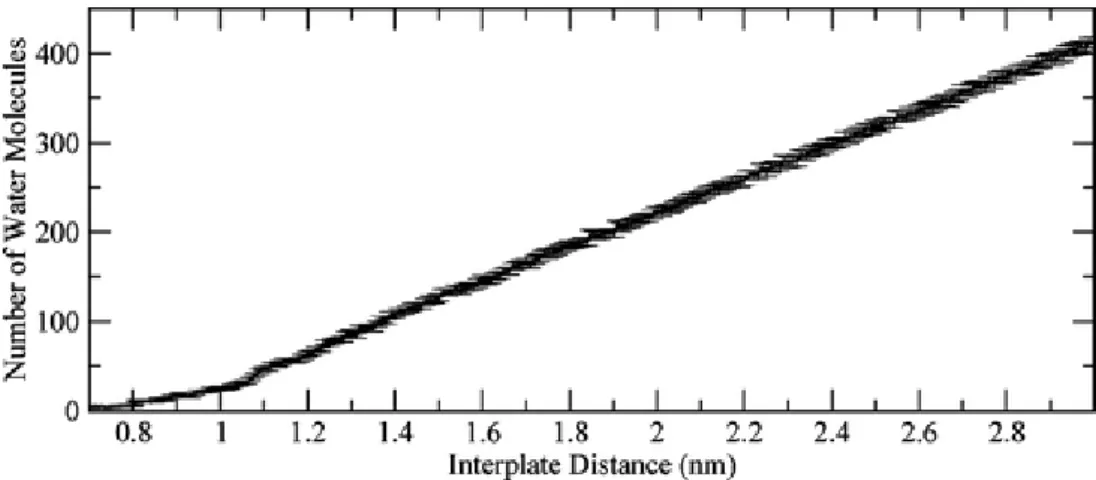
Because water plays such an important role in determining the shape of the PMF, we also calculated the number of water molecules in the interplate space as a function of
the distance between plates (see Figure 2-4) and found that the average water density, which is a slope of this curve, is a constant for the interplate distances above 1.05 nm and it corresponds to the normal water density of 1 g/cm3. The figure displays a clear break in the slope for distances below 1.05 nm. This confirms that the origin of the force
at distances above 1.0 nm is quite different from the origin of the force below 1.0 nm of the interplate space. Moreover, the reduction of water density at distances below 1.0 nm indicates that at these distances the headgroups may already engage in steric interactions.
Figure 2-4. Number of water molecules in the interplate space, as a function of the interplate distance. The value at each interplate distance represents the average number of
To get more detailed information on densities, we calculated density profiles at certain interplate distances. The water density profiles are displayed in Figure 2-5. From
the top panel of this figure, the water density profile at an interplate distance of 2.9 nm clearly shows that there are three kinds of water molecules in the interplate space: water molecules bound to the phosphates with the corresponding density peaks at −1.1 and 1.1 nm (we call this water phosphate water or inner water), water molecules next to choline
moieties of the phoshatidylcholine headgroups with the corresponding density peaks at −0.85 and 0.85 nm (interfacial water), and water molecules interacting mostly with the
other water molecules occupying space between −0.7 and 0.7 nm. The latter shows no density oscillations and has bulk-like density, and therefore, we call it bulk-like water. As
the second panel of Figure 2-5 clearly shows, when we start reducing the spacing between plates, but still remain in the large interplate distance regime, bulk-like water molecules are getting removed as the plates are brought together. When the distance reaches a value of 1.6 nm, most of the bulk-like water molecules are already removed
and the remaining water molecules are interfacial. These molecules significantly interact with the phoshatidylcholine headgroups, and therefore, the free energy cost for removing these water molecules is different from the one when the bulk-like water is removed. The removal of mostly interfacial water molecules between the two PC−headgroup plates,
that occurs when the interplate distance is in the interval from 1.6 to 1.0 nm, is responsible for the shape of the PMF at this distance interval. The profiles of water density in this regime are displayed in the third panel of Figure 2-5. In this regime, we observe that water density undergoes very substantial changes, from three peaks
interplate distance reaches a value of 1.0 nm, only the phosphate waters remain in the system (the last panel of Figure 2-5), and therefore, we expect that direct interactions
between headgroups significantly increase, as is also seen for the PMF in a vacuum (Figure 2-2). Notice that, in the small interplate distance regime, as the interplate distance decreases, the phosphate water molecules are removed and the two peaks in the water density corresponding to this water are merged into one peak that eventually disappears.
Our water density plots clearly display a layering structure next to PC plates and their headgroups, and this layering is reflected in the small oscillation we observe in the PMF for the intermediate interplate distance regime (see the middle panel of Figure 2-3).
Figure 2-5. Number of water molecules in the interplate space, as a function of the interplate distance. The value at each interplate distance represents the average number of water molecules over the trajectory, and the corresponding error bar is calculated from
Since we expect that the origin of the repulsive force in the small interplate distance regime is due to the strong steric interaction between the headgroups from each
plate, and also for the purpose of comparison between the experiments and our simulations, we calculated the distribution of the z positions of the headgroups of each plate, specifically, the positions of the center of mass (COM) of the phosphate group and the COM of three end carbons of the choline group. The distributions of these
coordinates are shown in the upper panels of Figure 2-6a−d. Generally, the distributions for phosphate groups are narrow, whereas the ones for choline are broad. From these panels, we observe that the overlap of z coordinates between the three carbons of choline is significantly increasing when the situation changes from the intermediate interplate
distance regime to the small interplate distance regime. This suggests that the steric repulsion between the headgroups belonging to the different plates might be responsible for the exponential decay of the PMF in the small interplate distance regime. At the same time, the removal of the inner water molecules can still contribute to the interaction
(a)
(b)
From the distributions shown in Figure 2-6, we estimated the values for the average distance along the z axis from the COM of the three carbons of the choline group of one plate to those of the other plate. Also, we did the same estimate for the phosphate
groups. This analysis showed that the phosphate group is located 0.27 nm away from the plate, and the COM of choline is 0.45 nm away from the plate. For the purpose of comparison between the experiments and our simulations, we assume that the bilayer edge is located at the COM of choline, i.e., at a distance 0.45 nm from the plate location.
That means that when the interplate distance is 1.6 nm, the fluid interbilayer distance is 0.7 nm.
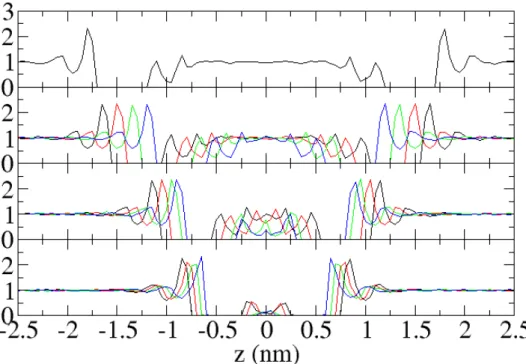
Figure 2-6. Superposition of the density profile of water (black) and the distributions of COM of three end carbons of choline (red) and COM of phosphate (green) are shown in
the top panels at different interplate distances of 2.00 nm (a), 1.40 nm (b), 1.20 nm (c), and 0.90 nm (d) and the distributions of the OH bond orientation of water molecules in the bottom panels at the corresponding distances. The water density is normalized by the density of bulk water and the distributions for choline and phosphate are normalized to
the value of unity. In the top panels, the abscissa corresponds to the z axis defined in the same way as in Figure 2-5; units are in nanometers. The bottom panels depict a series of the distributions for water in different regions, represented by different colors assigned below the density profiles (the same color is used to depict the distribution of the
To get a deeper understanding of the origin of the hydration force acting between PC−headgroup plates, we calculated the orientational distributions of OH bonds of water
molecules (see Figure 2-6) and looked at the snapshots taken from the simulations (Figure 2-7). To calculate the orientational distributions depending on the location of water molecules in the space between plates, we sliced the interplate space into intervals of 0.1 nm each along the z axis; the slice for the central bin corresponds to the interval
from −0.05 to 0.05 nm. In the distributions, θ is the angle between the z axis (parallel to the normal vectors of the plates) and the direction vector from the oxygen atom of a water molecule to its hydrogen atom. Therefore, there are two θ’s for each water molecule. We calculated cosθ for the water molecules in a designated space (each slice) and then
computed a distribution. Here, cosθ = 0 indicates that the OH bond is perpendicular to the z axis. In a large interplate distance regime, Figure 2-6a, the phosphate water molecules are roughly parallel to the PC plate rather than perpendicular, while the interfacial water molecules are situated in the opposite way. For the bulk-like water
molecules, there is no orientational preference displayed, as we expected. These conclusions can also be confirmed by an inspection of the snapshot picture made at 1 ns of the trajectory (Figure 2-7). In an intermediate interplate distance regime, we consider the situation at distances in the middle of this regime, i.e., at distances of 1.4 and 1.2 nm.
As Figure 2-6b shows, the distributions for the phosphate and the interfacial water molecules display the same tendency as for the corresponding waters from Figure 2-6a. Note that in this case there is no bulk-like water present in the system. In the intermediate interplate distance regime with one layer of interfacial water (1.2 nm), as Figure 2-6c
seen in Figure 2-6a and b, but the one for the interfacial water is different from those of Figure 2-6a and b. The presence of a single peak in the density profile of this water
implies that interfacial water molecules strongly interact with both plates, whereas interfacial water molecules in cases described by Figure 2-6a and b mostly interact with only one of the plates. This can be clearly seen from the snapshots in Figure 2-7b and c. In a small interplate distance regime, Figure 2-6d, the pattern of distribution for the
phosphate water molecules is different from those of the Figure 2-6a, b, and c cases. This is because some water molecules are interacting with both plates, as it is in the case of the interfacial water molecules from Figure 2-6c. Also, since the main properties of water are due to the presence of the hydrogen bonding network, we represent hydrogen bonds in
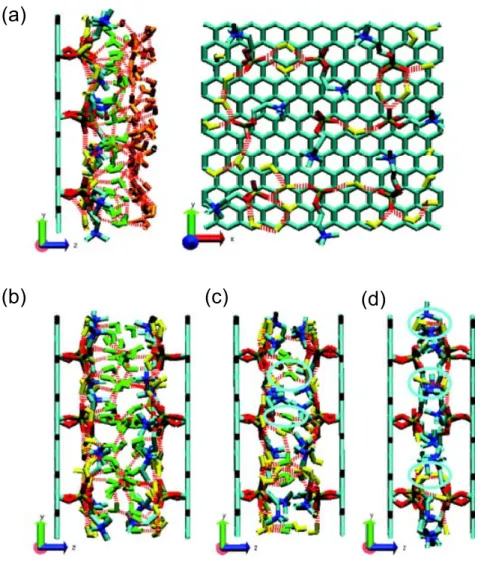
Figure 2-7. At a large interplate distance case, the left panel of Figure 2-7a clearly shows that, while the bulk-like water molecules are oriented without any preferential direction, one OH bond of the interfacial waters is likely to be oriented perpendicular to the plate. The two OH bonds of the phosphate water molecules are situated almost parallel to the
plate in order to maximize hydrogen bonding interactions with the phosphates. The right panel of Figure 2-7a presents the hydrogen bonding network between the phosphate water molecules and the phosphates of PC headgroups. As we see, the phosphate water molecules are located in between the PC headgroups and are interacting with the
phosphates. Figure 2-7b, which depicts the case of an intermediate interplate distance regime at a separation of 1.4 nm, clearly demonstrates that the phosphate water molecules (yellow) are almost parallel to the plates and the OH bonds of the interfacial water molecules (green) are oriented perpendicular to the plates. Note that the interfacial water
symmetrical with respect to z = 0 (middle of the two plates). Contrary to the case of Figure 2-7b, at an intermediate interplate distance regime at separation of 1.2 nm, shown
in Figure 2-7c, there is only one layer of the interfacial water molecules. These interfacial water molecules (circled with cyan) are interacting with both interfaces, while the water molecules in the case of Figure 2-7b are interacting with only one interface. For the case of the small interplate distance regime in Figure 2-7d, some of the OH bonds of the
Figure 2-7. Snapshots of the interplate space at 1 ns of the trajectory at an interplate
distance of 2.00 nm (a), 1.40 nm (b), 1.20 nm (c), and 0.90 nm (d). The phosphate water molecules, the interfacial water molecules, and the bulk-like water molecules are colored in yellow, green, and orange, respectively. The red dotted lines represent hydrogen bonds; we used for their definition a cutoff distance of 0.35 nm between a hydrogen bond
donor atom and a hydrogen bond acceptor atom and a cutoff angle of 30° for the hydrogen−donor−acceptor angle. Due to the symmetry, we omit the right part of the interplate space in the left panel of part a. The highlighted molecules with the cyan circles
(a)
Finally, we would like to compare the observations from our simulations and
from the experiments. The force in our MD simulations and the measured force from experiments have similar features: their action can be divided into three regimes fitted by exponential functions. Even the location of the regimes is somewhat similar. In the experiments of McIntosh and Simon, the hydration force regime appeared over distances
from 0.4 to 0.8 nm in the fluid thickness which is basically the distance from the edge of one bilayer to the edge of the other bilayer.28 In our simulations, the hydration force regime appeared when the range of interplate distances was from 1.0 to 1.6 nm. Since the fluid thickness is very close to the z directional distance between the choline groups, and
these were 0.45 nm from the plates, our hydration force regime is corresponding to the region from 0.1 to 0.7 nm in the fluid thickness. Despite some difference in the fluid distance interval, which might come from the uncertainty in determining the fluid thickness in both simulations and experiment and also the truncation of lipid tails and
absence of small scale protrusions in our model, the agreement on this issue between our result and the experiment is quite good. The agreement on the value of the exponent may depend on the quality of the fit of the curve to a multiexponential function, but for the hydration region of the force, we get a value of λ 0.3 nm, the value often quoted as the
2.4 Conclusion
We model lipid bilayers as graphene plates decorated with flexible
phosphatidylcholine headgroups attached to them and study the behavior of the free energy of interaction between these plates immersed in water as a function of distance between plates. The interaction energy displays three regions similar to the regions observed in the experiments, and like in the experiments, these regions can be fitted to
exponential curves. For the region when the fluid spacing between plates is large (in our case, this happens when the fluid thickness is above 0.9 nm) and when there is bulk-like water in the fluid space, the force is small. In the experiments, this force is mostly due to the membrane undulations. In our simulations, the bilayer undulations, although present
due to the flexible nature of the headgroups, have very different character compared to the ones in experimental bilayers. Our simulations clearly show the presence of the force correlated to the removal of water structures, the so-called hydration force, when we remove two to three layers of interfacial water, when the fluid space thickness is changed
from 0.7 to 0.1 nm. Once all of the interfacial water is removed, the steric factor due to the overlap of the headgroups is mostly contributing to the interaction force, although water is also still contributing, because some inner water remains in the system.
The main goal in this chapter is to show that even a simple model, as the one we chose, is
able to display the same features in the behavior of the interfacial force, as observed in experiments measuring the force acting between lipid bilayers. Specifically, the force is not a simple exponential force, but it can be represented as a force where different regions are dominated by forces of different origin. We observed that the hydration force
the restructuring of the hydrogen bonding network, as plates move toward each other and therefore the contributions to the force will have energetic and entropic components.
These can be estimated by performing simulations at different temperatures, although the results will be very sensitive to the numerical noise in the calculations. Direct interactions between our surfaces that include the electrostatic interactions between the headgroups and also van der Waals interactions between the opposing graphene plates and also
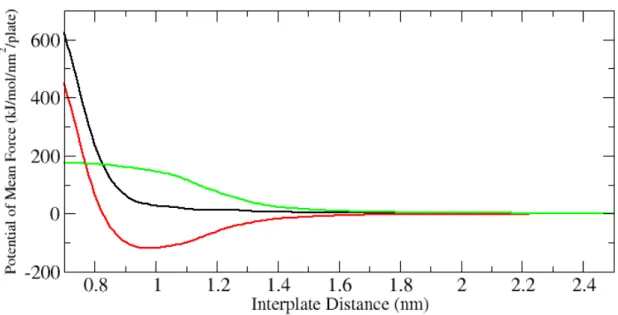
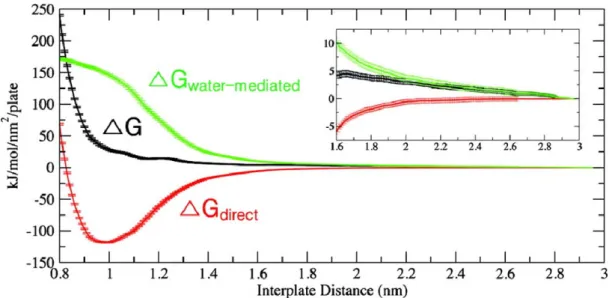
headgroups contribute to the force in the intermediate region, and the value of their contributions to the total free energy can be calculated. We describe how to perform such calculations in the Appendix. In Figure 2-8, we display the decomposition of the PMF into the contributions from the direct interaction and from the water-mediated interaction.
As we can see from this decomposition, the direct interaction which consists of the van der Waals and electrostatic interactions is attractive, and therefore, the water contribution is repulsive for all separation distances. This means that even the long-ranged repulsive character of the force, which is due to undulations in experiments, is due to water in our
simulations. From the form of the curve for the water-mediated interaction, we also can conclude that water-mediated force is mostly active at the interval between 1.6 and 1.0 nm, in agreement with our previous conclusion obtained from the consideration of the PMF. One should also understand that water indirectly influences the direct force by
Figure 2-8. Decomposition of the PMF (black) into the contributions from direct interaction (red) and from water-mediated interaction (green)
Our simulations also show that protrusions are not needed to obtain the hydration force, since the model excludes protrusions. Comparison of the results from this simulation and previous work of Lu and Berkowitz also shows that flexibility of the
headgroups plays an important role. Due to this flexibility, proper boundary conditions can be created to establish a nice hydrogen bonding network in water, while rigid dipoles on the plates can produce frustrations for creation of the hydrogen bonding network which results in a small hydration force. As we can see, although our model is still
Appendix
The Gibbs free energy change between two adjacent states specified by r1 and r2
at a given temperature T was calculated on the basis of the following formula
assuming that the state of r2 is slightly perturbed from the state of r1.
Since the potential is a sum of pairwise additive interactions, we can separate U(r1) into two terms, that is, U(r1) = u(r1) + w(r1). Here, u(r1) represents the interaction between the
atoms belonging to PC−headgroup plates, which does not explicitly depend on the coordinates of water molecules, whereas w(r1) is dependent on the coordinates of water
molecules. Using this separation, we get
where we denoted e−(u(r
1)−u(r2))/kBT 1 and e−(u(r
1)−u(r2))/kBT(e−(w(r1)−w(r2))/kBT − 1) 1 by A and B , respectively. The first term in the result above is the contribution from the direct interactions, and the second term is the
contribution from the water-mediated interactions. Therefore, we can define the first and
This result shows that the contribution from the direct interactions can be calculated by using the same trajectories obtained from our calculations of the total PMF. Note that, in the absence of water, Δg1,w = 0, since w(r1) = w(r2) = 0. The water contribution can be
obtained as a difference between the total PMF and the direct contribution.
Chapter 3:
Thermodynamic and Hydrogen-Bonding Analyses of the Interaction between Model Lipid Bilayers
Changsun Eun and Max L. Berkowitz
Department of Chemistry, University of North Carolina at Chapel Hill, Chapel Hill, North Carolina, 27599
Published in the Journal of Physical Chemistry B, 114, 3013-3019 (2010)
Abstract
We present further analysis of a system containing two graphene plates with
attached phosphatidylcholine lipid headgroups embedded in water, which models a lipid bilayer. In Chapter 2, we performed molecular dynamics simulations on this system, calculated the potential of mean force (PMF) between plates (Eun, C.; Berkowitz, M. L. J. Phys. Chem. B 2009, 113, 13222−13228), and also performed a structural analysis of water in the confined space between the plates. Here, we perform thermodynamic analysis of the PMF and, in addition to the previous analysis of water that considered density plots and the OH bond orientational profiles, we perform hydrogen bonding analysis of water. We show that the structural analysis of water is consistent with the
3.1 Introduction
The hydration force acting between neutral lipid bilayers was first measured by
LeNevue et al. in 1976.24 While initially it was assumed that the force is exponentially decaying over the whole distance interval, more detailed measurements51 showed that the force of interaction between neutral lipid bilayers in the liquid crystalline phase has three regimes: a long-range regime when the fluid spacing between membranes exceeds 1 nm
due to bilayer undulations, a short-range regime (when fluid spacing is below 0.4 nm) due to steric repulsion of bilayers, and, finally, the intermediate-range regime, which is actually due to water and represents the proper “hydration” force. In addition to experimental work, a large amount of theoretical and simulation work 25,29,30,32,34-36,38-40,52-55 has been done to explain the nature of the hydration force. In Chapter 2, we performed
molecular dynamics simulations on a model system, where the neutral lipid bilayer was represented as a graphene plate with attached phosphatidylcholine (PC) lipid headgroups, which we called PC-headgroup plates.56 We used a model system to be able to efficiently
calculate the free energy (or the potential of mean force, PMF) of plate interaction as a function of distance between plates and also to determine general principles related to the structure of water that induces the hydration force.
Lately, a lot of attention has been devoted to understanding the nature of
interaction between hydrophobic particles.50,57,58 To study characteristics of a possible hydrophobic interaction between nanoscale particles, Choudhury and Pettitt performed simulations on a system containing two graphene plates immersed in water.22,43,59 To study the interaction between model hydrophilic particles, Lu and Berkowitz40,41 used the
certain carbon atoms, so that the plates, while being neutral, had charges distributed on them. To connect their study to the problem of the hydration force acting between lipid
bilayers, Lu and Berkowitz assigned charges in such a way that the charges, in a coarse-grained fashion, represented the zwitterionic character of lipid bilayers, such as dipalmitoylphosphatidylcholine (DPPC). The major shortcoming of the model used by Lu and Berkowitz was the rigid character of the dipoles. In our previous work,56 we again
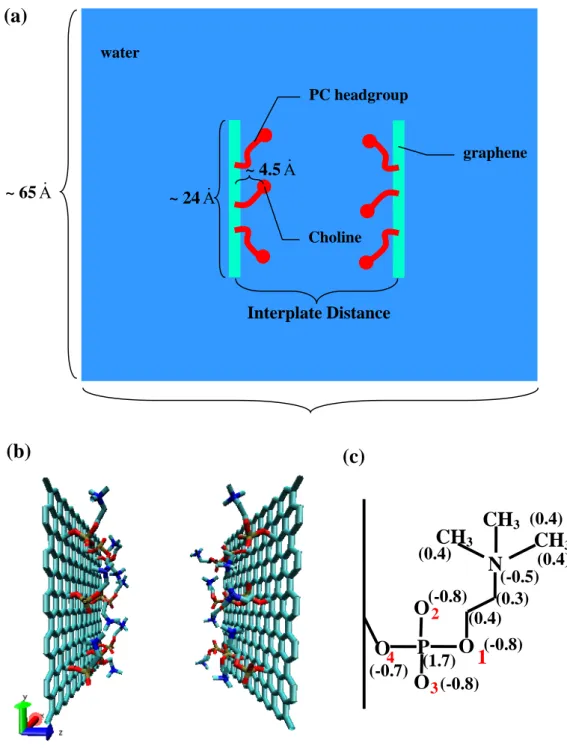
studied the interaction between model hydrophilic surfaces, though, this time, the headgroups of lipids were faithfully represented and were allowed to move. Thus, our system contained two graphene plates (2.425 nm × 2.380 nm) with nine phosphatidylcholine (PC) headgroups attached to these plates, so that the area per
headgroup is 0.64 nm2, a value typical of the PC area observed in lipid bilayer experiments60 and computer simulations.61,62 The two plates separated by a certain distance were immersed into a large simulation box containing 8800 SPC/E water48 molecules. The schematic picture of the system simulated, including a more detailed
(a)
Interplate Distance
graphene
Choline water
~ 24A& ~ 65A&
PC headgroup
~ 4.5A&
O
O
O
P
O
N
1
2 3 4
CH
3CH
3CH
3 (0.4) (0.4) (0.4) (-0.5) (0.3) (0.4) (-0.8) (1.7) (-0.8) (-0.8) (-0.7)(b)
(c)
Our previous calculations showed that the PMF has a repulsive character over all interplate distances. We also determined that the PMF has three regimes, and we were
able to fit each of these to an exponential function. In parallel to the total PMF calculation, we also calculated the contributions to the free energy change due to the direct interaction between the plates and the water-mediated interaction. The total PMF, the direct contribution, and the water-mediated contribution are shown in Figure 3-2. We
determined that the small distance regime of the interaction, when the plates are at distances below 1 nm and the fluid spacing below 0.1 nm, is due to steric repulsion between the headgroups. The intermediate distance regime, when the interplate distance is between 1 and 1.6 nm and the fluid spacing between 0.1 and 0.7 nm, is due to the
removal of water structured by the surfaces. Finally, the large distance regime was also determined to be due to water in our simulation. In both the intermediate and large distance regimes, the water-mediated contribution acts in opposition to the direct contribution while the mediated contribution dominates. While both the
water-mediated and direct contributions are small and nearly cancel in the large distance regime, the inset of Figure 3-2 with displayed error demonstrates that the total PMF in the large distance regime is due to water, which indicates that water is still slightly disturbed when the distance between the plates is in the range 1.6 to 2.2 nm with a fluid spacing of 0.7
structure of water is connected to the length scales of the three regimes observed in the PMF.
In this chapter, we further pursue our study of the nature of the PMF acting
between lipid bilayers by performing a thermodynamic analysis of this PMF. We also perform an analysis of the hydrogen bonding network for water in confined space and show that this analysis may explain why water contributes to the PMF in the long-range regime. Our present work should be considered as complementary to our previous work
that used the same model.
3.2 System and Computational Details
The same arrangement of the system as described in Chapter 2 is used in this
work, with a depiction of the system provided in Figure 3-1. Previously we calculated the potential of mean force (PMF) between the two plates at thermodynamic conditions of P = 1 bar and T = 298 K. For this purpose, we performed molecular dynamics (MD) simulations on the system with plates fixed at a set of different interplate distances and
used thermodynamic perturbation method43 to obtain the PMF curve. The interplate distance was defined by the distance between two graphene plates. During the simulations the box size fluctuated around values of 6.5 nm × 6.5 nm × 6.5 nm. For our NPT simulations we used Nose−Hoover44,45 temperature coupling and
Parrinello−Rahman46 pressure coupling algorithms. Electrostatic interaction was calculated through the particle mesh Ewald method.47 More details about the preparation of the system and molecular dynamics simulations were described in the previous chapter.
To separate the PMF into the enthalpy−entropy contributions, we used the
thermodynamic definition of entropy and employed the finite difference method59,63 for its calculation:
(3-1)
where ΔS(r) and ΔG(r) are the entropy and the Gibbs free energy changes from the reference state (r = 2.99 nm, where the free energy was assumed to have a zero value), to the state when the interplate distance had a value of r. In our calculation, the temperature difference, dT, was 10 K, thus requiring us to carry out an additional simulation at 308 K.
(3-2)
Since PMF can be decomposed into contributions originating from the direct interaction between plates and water-mediated interaction,56 as shown by eq 3-3:
(3-3) we applied the finite difference method to each type of interaction and calculated enthalpic and entropic contributions for both direct and water-mediated interactions as well. In addition, to obtain a better understanding for the details involved in the enthalpy
change, we calculated the potential energy change with respect to the reference state (ΔU(r)), directly from the MD simulation at each interplate distance r, and further decomposed ΔU(r) into multiple terms:
(3-4)
where ΔUdirect(r) and ΔUwater-mediated(r) are, respectively, the interaction potential energy between the PC-headgroup plates and the potential energy involving water molecules, which can be further separated into a water−water interaction (ΔUwater−water(r)) and a water−plate interaction (ΔUPCplate−water(r)). All terms except ΔUPCplate−water(r) are computed
directly from the simulations, and ΔUPCplate−water(r) is determined from eq 3-4.
Analysis of the hydrogen bonding network is a key ingredient for understanding the water−water and water−plate interactions. Therefore, we performed hydrogen bonding analysis using the standard geometry criterion for hydrogen bonds (H-bonds). According
to this criterion, when the distance between oxygen atoms of the H-bond donor and the
H-bond acceptor is less than 0.35 nm and the angle between of the H-bond
than 0.245 nm, a hydrogen bond is considered to be formed.64 Based on this criterion, we calculated the profiles of the number of H-bonds per water molecule and the number of
H-bond donors/acceptors per water molecule. In that calculation, the position of the oxygen atom in a water molecule is considered as the position of the water molecule. Errors for the PMF and the enthalpy−entropy calculation were estimated by using the block averaging method65 and the standard error propagation method. For potential
energy calculations and hydrogen bond calculations, we simply considered the standard deviation as an error.
3.3 Results and Discussion
3.3.1 Thermodynamics
Enthalpic and Entropic contributions
To understand the thermodynamic basis behind the repulsive character of the interaction between our two hydrophilic plates immersed in water, we carried out entropy−enthalpy analysis of the PMF curve through the use of eq 3-1. The result is shown in Figure 3-3a. As we can see from this figure, while the enthalpic contribution is
For a more detailed understanding of the enthalpic and entropic parts of the PMF, we separated the entropic and enthalpic contributions further into direct and water-mediated contributions as depicted in Figures 3-3b and 3-3c. Figure 3-3b illustrates that the enthalpy change is dominated by the water-mediated contribution that is unfavorable
due to removal of water from the interplate space. The direct contribution to the enthalpy change is favorable for large and intermediate distances and unfavorable for small distances; in its shape it is reminiscent of a van der Waals interaction as can be expected. The behavior of the direct and the water-mediated components contributing to the
entropic part of the free energy change is shown in Figure 3-3c. As the figure shows, due to the release of water into the bulk-like environment, the water-mediated contribution is favorable at both intermediate and small distances. The direct contribution to entropy change is unfavorable at intermediate distances, but it is favorable at small. This likely is
happening because, at intermediate distances, water restricts the conformational motion of the headgroups to support its hydrogen bonding network. Release of water, when the distance between plates decreases, removes the conformational constraints on these headgroups; as a result, the entropy increases. It is very hard to judge what is happening Figure 3-3. (a) Enthalpic (red) and entropic (green) contributions to the PMF (black). (b) Decomposition of the enthalpic contribution (red) into the direct interaction (blue) and the water-mediated interaction (orange). (c) Decomposition of the entropic contribution (green) into the direct interaction (blue) and the water-mediated interaction (orange).