Cover Page
The handle
http://hdl.handle.net/1887/20855
holds various files of this Leiden University
dissertation.
Author: Yildiz, Umut
Title: Warm and cold gas in low-mass protostars : Herschel Space Observatory and
ground-based surveys
W
arm and
C
old
G
as in
L
ow
-M
ass
P
rotostars
W
arm and
C
old
G
as in
L
ow
-M
ass
P
rotostars
H
erschel
S
pace
O
bservatory and
G
round
-B
ased
S
urveys
PROEFSCHRIFT
ter verkrijging van
de graad van Doctor aan de Universiteit Leiden, op gezag van de Rector Magnificus prof. mr. C. J. J. M. Stolker,
volgens besluit van het College voor Promoties te verdedigen op woensdag 1 mei 2013
klokke 16.15 uur
door
Umut Yıldız
geboren te Istanbul, TurkijePromotiecommisie
Promotor: Prof. dr. E. F. van Dishoeck
Co-promotor Dr. L. E. Kristensen (Harvard-Smithsonian Center for Astrophysics) Overige leden: Prof. dr. P. F. Goldsmith (NASA Jet Propulsion Laboratory;
California Institute of Technology) Prof. dr. P. Caselli (University of Leeds)
Prof. dr. A. G. G. M. Tielens Prof. dr. H. Röttgering Dr. M. R. Hogerheijde
Front Cover:Image of the dark cloud Barnard 86 in the neighbourhood of the bright star cluster NGC 6520. The image is taken by MPG/ESO 2.2-metre telescope at ESO’s La Silla Observatory in Chile. The image is modified and a forming baby as displayed in a womb with an echo is put inside. The analogy resembles that stars are born in those dark molecular clouds and can be observed at long wavelengths. The displayed spectrum is the HIFI spectrum centered at O2487 GHz toward NGC1333 IRAS 4A from Chapter 6.
Back Cover:Contour map of bipolar outflows driven by two protostars, NGC1333 IRAS 4A and IRAS 4B from Chapter 4. Solid contours represent the red outflow lobe whereas dashed contours represent the blue outflow lobe.
Wordle:Each chapter begins with aWordleimage showing 150 words proportional to the frequency of their usage in each of the chapters, which indirectly acts as summary of that chapter (www.wordle.net).
Warm and Cold Gas in Low-Mass Protostars:HerschelSpace Observatory and Ground-Based Surveys Copyright c!2013 Umut Yıldız
ISBN 978-90-8891-607-6
Printed byProefscriftmaken.nl"Uitgeverij BOXPress, ’s-Hertogenbosch, the Netherlands
9 789088 916076
“Staying steady is going back.”
Contents
1
I
ntroduction 11.1 Low-mass star formation . . . 2
1.1.1 Molecular clouds . . . 2
1.1.2 Stages of young stellar objects . . . 3
1.2 Molecules . . . 5
1.2.1 Molecular transitions . . . 6
1.2.2 Carbon monoxide - CO . . . 8
1.2.3 Molecular oxygen - O2 . . . 8
1.3 Observations . . . 9
1.3.1 HerschelSpace Observatory . . . 9
1.3.2 Heterodyne Instrument for the Far-Infrared (HIFI) . . . 10
1.3.3 Ground-based telescopes . . . 14
1.4 WISH . . . 15
1.5 WISH live data show . . . 16
1.6 This thesis . . . 18
1.7 Future outlook . . . 20
2
H
erschel-HIFI observations of high-JCO lines in the NGC 1333 low-mass star-forming region 23 2.1 Introduction . . . 252.2 Observations and results . . . 25
2.3 Analysis and discussion . . . 29
2.3.1 Broad and medium components: shocked gas . . . 29
2.3.2 Narrow component: bulk warm envelope . . . 31
2.4 Conclusions . . . 32
2.5 Additional materials . . . 33
2.5.1 Radex model . . . 33
2.5.2 Abundance profiles for IRAS 2A . . . 33
3
H
igh-JCO survey of low-mass protostars observed withHerschel-HIFI 41 3.1 Introduction . . . 433.2 Observations and complementary data . . . 45
3.3 Results . . . 48
3.3.1 CO line gallery . . . 48
3.3.2 12CO lines . . . . 48
3.3.3 13CO lines . . . . 53
3.3.4 C18O lines . . . . 53
3.4 Rotational diagrams . . . 55
3.4.1 Rotational diagram results . . . 56
3.4.2 CO ladders . . . 59
3.4.3 Two temperature components? . . . 60
Contents
3.4.5 Kinetic temperature . . . 62
3.5 Correlations with physical properties . . . 64
3.5.1 Integrated intensities . . . 64
3.5.2 Excitation temperature and comparison with evolutionary models . . . 65
3.5.3 High-JCO vs. water . . . 66
3.6 CO abundance and warm inner envelope . . . 68
3.6.1 CO abundance profiles . . . 68
3.6.2 Warm inner envelope . . . 70
3.7 Conclusions . . . 72
3.8 Additional materials . . . 75
4
A
PEX-CHAMP+high-JCO observations of low–mass young stellar objects: III. NGC 1333 IRAS 4A/4B envelope, outflow, and ultraviolet heating 79 4.1 Introduction . . . 814.2 Observations . . . 83
4.3 Results . . . 88
4.3.1 The CO line gallery . . . 88
4.3.2 Maps . . . 91
4.3.3 Morphology . . . 95
4.4 Analysis: Outflow . . . 97
4.4.1 Rotational temperatures and CO ladder . . . 97
4.4.2 Observed outflow parameters . . . 99
4.4.3 Outflow energetics . . . 103
4.5 Analysis: Envelope properties and CO abundance . . . 105
4.5.1 Envelope model . . . 105
4.5.2 CO abundance profile . . . 106
4.6 Analysis: UV-heated gas . . . 110
4.7 Conclusions . . . 113
4.8 Auxillary figures . . . 115
5
A
PEX-CHAMP+high-JCO observations of low–mass young stellar objects: IV. Mapping survey of low-mass protostars 119 5.1 Introduction . . . 1215.2 Sample and observations . . . 123
5.2.1 Sample . . . 123
5.2.2 Observations . . . 124
5.2.3 12CO maps . . . 125
5.2.4 13CO maps . . . 125
5.3 Results . . . 128
5.3.1 Outflow morphology . . . 128
5.3.2 Outflow parameters . . . 128
5.3.3 Other outflow parameters . . . 135
5.3.4 Correlations . . . 136
5.4 Discussion . . . 138
5.5 Conclusions . . . 139
Contents
6
D
eep observations of O2toward a low-mass protostar withHerschel 1496.1 Introduction . . . 151
6.2 Observations . . . 154
6.3 Results . . . 156
6.3.1 O2 . . . 157
6.3.2 NO . . . 157
6.3.3 C18O . . . 158
6.3.4 Column densities and abundances . . . 159
6.4 Gas-grain models for the protostellar envelope . . . 162
6.4.1 Gas phase O2and NO formation . . . 162
6.4.2 Grain chemistry specific to O2and NO . . . 163
6.4.3 Model results . . . 165
6.5 Tentative detection of O2in the 8 km s−1cloud . . . 167
6.6 Conclusions . . . 169
6.7 Additional materials . . . 171
A
C
entral source spectra 175 A.1 L1448MM . . . 176A.2 IRAS2A . . . 177
A.3 IRAS4A . . . 178
A.4 IRAS4B . . . 179
A.5 L1527 . . . 180
A.6 Ced110IRS4 . . . 181
A.7 BHR71 . . . 182
A.8 IRAS153981 . . . 183
A.9 L483mm . . . 184
A.10 SMM1 . . . 185
A.11 SMM4 . . . 186
A.12 SMM3 . . . 187
A.13 L723mm . . . 188
A.14 B335 . . . 189
A.15 L1157 . . . 190
A.16 L1489 . . . 191
A.17 L1551IRS5 . . . 192
A.18 TMR1 . . . 193
A.19 TMC1A . . . 194
A.20 TMC1 . . . 195
A.21 HH46 . . . 196
A.22 DK Cha . . . 197
A.23 GSS30IRS1 . . . 198
A.24 Elias29 . . . 199
A.25 Oph IRS63 . . . 200
A.26 RNO91 . . . 201
Nederlandse samenvatting 203
Contents
B
ibliography 222P
ublications 229C
urriculum Vitae 239A
cknowledgments 241Chapter 1 –
Introduction
1.1 Low-mass star formation
T
he query of where we come from or how our Solar System formed are ancient questions. Dur-ing human history, many different types of people including philosophers, religious leaders, and scientists have tried to come up with different suggestions to address these questions. Today, even with our advanced engineering tools and our improved scientific methods, we are still trying to find at least some clues. Especially after the invention of radio astronomy in the 1930s by Karl Jansky and the detection of the first molecule –the methylidyne radical (CH)– in the interstellar medium in 1937 by optical absorption lines (Swings & Rosenfeld 1937, McKellar 1940), a lot of progress has been made during the course of time. Many new molecules have been discovered in a variety of astronomical sources, which span a large range of conditions.The Sun is a G2 V-type main-sequence star comprising about 99.86% of the total mass of the Solar System. It largely consists of simple elements, like hydrogen and helium. Molecules, in-cluding some complex ones, are found throughout our Solar System. Most importantly, planets like our Earth and their atmospheres contain species like water that are key to the origin of life. To better understand their formation, low-mass stars similar to our Sun need to be studied at dif-ferent evolutionary stages. This thesis addresses theformation of the earliest stages of low-mass protostars.
1.1.1 Molecular clouds
Two forces in the Universe play an important role in the birth and death of the celestial sources. These are: first,gravity, which tends to compress material and second,pressure, which oppositely pushes the interstellar material apart. At the very outset of star formation, in order for a cloud to collapse, the force ofgravitymust overcome thethermal pressureso that the clouds must be cold. The only regions in theinterstellar mediumthat are dense enough for the force of gravity to overcome the relatively weak thermal pressure from low gas temperature and thus to allow star formation are thedark molecular clouds.
The simplest of those clouds are theBok globules. Their temperatures are around 10 K, the densities range from 104 to 105 cm−3, and their masses range from 10 to 100 M
$. While Bok
globules have typical sizes of a few parsec, dark clouds or cloud complexes can be significantly larger with sizes of tens of parsecs. These places are the ideal sites for low-mass star formation. Due to the high extinction (AV >100 mag), the earliest protostellar phase can only be observed at
longer wavelengths, e.g., far-infrared, submillimeter, and millimeter. Fig. 1.1 shows theHerschel
Space Observatory image of the Eagle Nebula (also known as the Pillars of Creation) taken with the PACS/SPIRE instruments. The three color composite image shows the areas of active star birth, where the tips of the pillars also contain protostars. In our Milky Way galaxy, there are many similar molecular clouds that harbor star-forming regions, which form new stars with planets surrounding them.
Observations show that stars form in these collapsing dense and dark molecular clouds ei-ther inisolatedor inclusteredenvironments (reviews by Shu et al. 1987, Bergin & Tafalla 2007, Kennicutt & Evans 2012). The outcome of the star formation process may depend on this initial environment. For example, clusters of massive stars together with thousands of low mass stars are formed in giant molecular clouds (GMCs) like those in Orion. However, isolated low-mass stars form in smaller condensations, e.g., B68 in the Pipe Nebula.
1.1 Low-mass star formation
Figure 1.1–Herschel-PACS/SPIRE image of the Eagle Nebula. This is a three colour composite with colours assigned as (blue=70µm, green=160µm, red=250µm). The 70µm and 160µm data are from PACS and the 250
µm from SPIRE. Credits: ESA/PACS & SPIRE Consortium, T. Hill, F. Motte, CEA/IRFU - CNRS/INSU - Uni. Paris Diderot, HOBYS Key Program Consortium.
1.1.2 Stages of young stellar objects
Low-mass YSOs have been classified by various methods, e.g., based on the infrared slope,αIR= dlog(λFλ)/dlogλ, of the spectral energy distribution at wavelengths from 2µm to 20µm (Lada & Wilking 1984),
αIR: Stage I
−→ 0.3−→ −Flat 0.3Stage II−→ −1.6Stage III−→ (1.1)
or based on their bolometric temperatureTbol, (Myers & Ladd 1993, Chen et al. 1995), Tbol:
Class 0
−→ 70 KClass I−→ 650 KClass II−→ 2800 KClass III−→ (1.2)
This sequence reflects that with the evolution of the protostellar phase from molecular clouds to protoplanetary disks, the peak emission shifts from longer to shorter wavelengths.
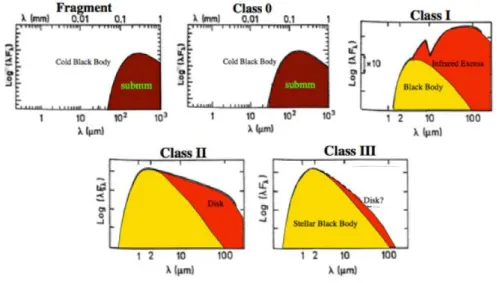
According to Lada (1987) and André et al. (2000), YSOs are characterized by four different evolutionary classes (Class 0–III) during their formation (Fig. 1.2; Evans et al. 2009, Dunham et al. 2013).
Class 0 —is the earliest and deeply-embedded stage of YSOs, where theprotostar is sur-rounded by a collapsingenvelopeand acircumstellar disk, from which material is accreted onto the protostar. The mass of the envelope is much larger than that of the central protostar (Menv>>M∗)
and the lifetime of this stage is typically 104- 105years. Very strongjetsandwindserupt from both
Chapter 1 –
Introduction
Figure 1.2–Low mass star formation sequence according to their evolving SEDs. Adapted from André et al. (2000).
Figure 1.3–Artist impression of the birth of a star. With submillimeter instruments, it is possible to penetrate the surrounding dust of a forming star. While matter accretes on the protostar, bipolar jets and molecular outflows erupt on both sides. Image credit: NASA/JPL-Caltech.
1.2 Molecules
in the form of a collimatedoutflow. These outflows are important for removing angular momentum and mass and helping the accretion process to be more efficient (Fig. 1.3; e.g., Tafalla et al. 2000, Arce et al. 2007). The interaction of the outflows with the surrounding envelope also heats up the material and leads to the formation of many molecules. The spectral energy distribution (SED) of this phase peaks at far-infrared and submillimeter wavelengths.
Class I —is the next stage in the evolution, where the envelope is being dispersed by the outflows while the circumstellar disk grows. This phase lasts a few×105 years and the mass of
the envelope is now less than the central protostar (M∗>Menv). The bipolar outflows are still seen
in this stage, however their strength is much lower than in the Class 0 phase. Due to the lower extinction, the SED now consists of two components; blackbody emission from the protostar and infrared excess from the surrounding disk.
Class II —is the phase where the envelope is almost completely dissipated into the protostellar disk (Mdisk>Menv). The lifetime of this phase is a few×106years and the black body radiation is
shifted to near-infrared wavelengths, while the disk emission is still seen in the mid-to far-infrared wavelengths. The sources which are observed in this phase are also calledClassical T Tauri stars
(CTTSs), with possibleplanetformation.
Class III —is the phase where the accretion stops and the jets and outflows are entirely gone (Walter 1987). The sources are calledWeak-line T-Tauri stars(WTTS) with a debris disk or plane-tary system that may have formed.
Toward the end of the Class III stage, the turning point of becoming astaris reached by burning hydrogen in its core through fusion reactions, which then leads to thehydrostatic equilibriumof stars. The new-born star appears in the Hertzsprung-Russell Diagram in its so-calledzero-age main-sequence (ZAMS) period (Hayashi et al. 1962). After this period, the star joins the main sequence stellar evolution phase, which is very stable due to constant processing of Hydrogen into other elements.
Star-formationis a complex process with the components in each of those stages interacting. A good understanding of them is needed both individually and globally. In this thesis, I focus on the early Class 0 and Class I phases by using observations from ground- and space-based submil-limeter telescopes, especially the newHerschelSpace Observatory. Understanding the structure of molecular outflows, which are an integral part of these phases, has made significant progress over the last few decades since the first discovery in a low-mass protostar “L1551-IRS5” by Snell et al. (1980). Although the formation of jets, winds and outflows is not fully understood, it is thought that they result from the interaction of the magnetic field of the central object with the surrounding circumstellar disk. The amount of gas in the outflows in different temperatures can be traced using CO rotational transition observations (see Sect. 1.2). In this thesis, we quantify the cold (T<100 K) and warm (T>100 K) gas via rotational transitions of CO. The accretion also leads to heating of the surrounding envelope with increasing luminosity, leading to evaporation of the molecules that were frozen out during the earliest cold phases (e.g., van Dishoeck & Blake 1998, Ceccarelli et al. 2007, Caselli & Ceccarelli 2012). These detailed studies of the physical and chemical structure of low–mass protostars are important for a complete understanding of the evolution of young stellar objects (YSOs).
1.2 Molecules
T
he interstellar medium (ISM) consists of∼99% of gas and 1% dust by mass. Approximately 90% of this gas is in the form of H or H2, 8% in He and∼1-2% is heavier elements byChapter 1 –
Introduction
circumstellar media from nearby objects to distant galaxies. About 50 of those molecules contain 6 or more atoms and are called complex molecules (Herbst & van Dishoeck 2009). Deep inside molecular clouds, most of the carbon is in the form of CO and the hydrogen is in the form of H2.
The other main constituent of molecular clouds is dust grains, and they typically make up 1% of the cloud by mass. Dust grains are key players when it comes to the chemistry in the sense that their surfaces can act as “catalysts” of chemical reactions (Herbst & van Dishoeck 2009). However, in order for the surfaces to aid chemical complexity, molecules need to meet and attach themselves to the surface of a grain, a process which is known asfreeze out.
In dense clouds, the probability of a molecule to meet a grain surface and stick to it is so high that essentially all molecules except H2are frozen out. Typically this requires densities greater than
∼105cm−3; if the density is lower, the time it takes for a molecule to randomly meet a dust grain is
longer than the lifetime of molecular clouds and so no or little freeze out takes place (Jørgensen et al. 2005c). When the molecules are stuck to the surface, they can meet and react with other molecules. In particular, this is how water is expected to form, from successive reactions of O, O2, O3with H
and H2(Tielens & Hagen 1982, Ioppolo et al. 2008, Cuppen et al. 2010).
When dust grains heat up, molecules eventually evaporate depending on the binding energy of the molecule to the surface. H2 has a very low binding energy and evaporates already at∼4 K,
CO and O2are slightly more tightly bound and laboratory experiments show that they evaporate at
∼20 K (Acharyya et al. 2007). H2O and CH3OH have higher binding energies and only thermally
evaporate once the grains reach temperaures of 100 K or more. These values are all based on high-quality laboratory experiments carried out under controlled conditions.
The density and temperature constraints imply that the abundances of different molecules vary through the envelopes surrounding the forming protostars (Jørgensen et al. 2002). In this thesis, Chapters 2, 3, 4, and 6 discuss the variation of CO abundances in the protostellar envelopes and demonstrate the necessity of a freeze-out zone below the evaporation temperature of CO.
1.2.1 Molecular transitions
By observing molecules, we obtain information on the physical and chemical conditions of their past, today, and future. These molecules are observed through their discrete energy levels, where the transition between two levels emit or absorb radiation which corresponds to a frequency/wavelength that telescopes can detect. This radiation is like a specific blueprint of each species.
Three types of transitions can be observed:Electronic Transitionsare the transitions among the electronic quantum states in the atoms or molecules, leading to emission of radiation in the visible and UV part of the spectrum.Vibrational Transitionsare due to the vibrational states within every electronic state and occur due to the oscillatory motion of the nuclei. Regions with temperatures around∼1000 K emit at infrared wavelengths.Rotational Transitionsare due to the end-over-end tumbling of the molecule and the torque exerted on the molecular dipole. Regions with temperatures <300 K emit mostly at millimeter and submillimeter wavelengths.
In this thesis, rotational transitions of the CO and O2 molecules are used to characterize the
physics and chemistry of the protostellar environments. Rotational transitions are possible when the atoms in a molecule have different electronegativity, so that it has a permanent dipole moment. CO is an asymmetric molecule with a small permanent dipole moment (0.112 Debye), which ra-diates in rotational transitions effectively. Homonuclear symmetric molecules, such as H2, do not
have a permanent electric dipole moment and only forbidden quadrupole transitions are possible. The pure rotational and rovibrational transitions of H2can be observed in regions with high kinetic
temperatures of a few hundred to a few thousand Kelvins, e.g., shocked gas. O2is also a
1.2 Molecules
0 2 4 6 8 10
Ju 0 50 100 150 200 250 300 En er gy [K ] 1-0 2-1 3-2 4-3 5-4 6-5 7-6 8-7 9-8 10-9 1152.0 1036.9 921.8 806.7 691.5 576.3 461.0 345.8 230.5 115.3 1.0e-04 7.3e-05 5.1e-05 3.4e-05 2.1e-05 1.2e-05 6.1e-06 2.5e-06 6.9e-07 7.2e-08 Freq (GHz)
Aul(s−1)
12
CO
0 2 4 6 8 10
Ju 1-0 2-1 3-2 4-3 5-4 6-5 7-6 8-7 9-8 10-9 1101.3 991.3 881.3 771.2 661.1 550.9 440.8 330.6 220.4 110.2 8.8e-05 6.4e-05 4.5e-05 3e-05 1.9e-05 1.1e-05 5.4e-06 2.2e-06 6e-07 6.3e-08 13
CO
0 2 4 6 8 10
Ju 1-0 2-1 3-2 4-3 5-4 6-5 7-6 8-7 9-8 10-9 1097.2 987.6 877.9 768.3 658.6 548.8 439.1 329.3 219.6 109.8 8.8e-05 6.4e-05 4.5e-05 3e-05 1.9e-05 1.1e-05 5.3e-06 2.2e-06 6e-07 6.3e-08
C
18O
Figure 1.4–Right:12CO (left, black),13CO (middle, blue) and C18O (right, red) energy diagrams. Dashed transitions are targeted withHerschel-HIFI. The frequencies (in GHz) and EinsteinAcoefficients (in s−1) are also given next to the transitions. Dashed transitions refer to those observed withHerschel-HIFI. In this thesis, we use the term “low-J” lines to beJup≤3 and “high-J” lines withJup≥6.
Figure 1.5–Sketch showing the importance of high angular and spectral resolution to quantify the location and origin of warm and cold gas traced by CO. Background image is adapted from a NASA/JPL-Caltech image.
clear molecule like H2, but it possesses a magnetic dipole moment, which allows it to radiate weakly
Chapter 1 –
Introduction
1.2.2 Carbon monoxide - CO
Spectral lines in the millimeter and submillimeter range are tracers of the dense molecular gas, which reveal the kinematic characteristics of collapse in the envelope and the high velocity gas in protostellar outflows. The CO molecule is the second most abundant molecule under most condi-tions in the interstellar medium after H2, with a very simple level structure and the different
iso-topologues (13CO, C18O, C17O) are detectable at sub-/mm wavelengths. Because of its small dipole
moment, CO has the characteristics of being rotationally excited very easily at low densities, and therefore the excitation measurements provide an excellent estimate of the gas kinetic temperature and, by assuming a CO/H2abundance, of the molecular gas mass as well. In Fig. 1.4, the energy
level diagrams for12CO,13CO, and C18O are shown. The rotational levels are more closely spaced
than for H2because the moment of inertia is greater.
Since its discovery in the Orion molecular cloud (Wilson et al. 1970), CO has served as the pri-mary tracer of molecular gas, both in our own and in external galaxies (e.g., Maloney & Black 1988, Lada 1987, Neininger et al. 1998, Kennicutt & Evans 2012). The most abundant isotope,12C16O, is
naturally the easiest to detect, but13CO, C18O, and occasionally C17O and13C18O, have also proved
useful in tracing different environments. Important usage of CO is to characterize the swept-up gas in protostellar outflows where the temperature is relatively low (a few hundred Kelvins). Therefore CO maps have been widely used to identify the physical properties of these outflows. C18O lines
are mainly used to probe the quiescent envelope gas, whereas13CO is found to be good tracer for
UV heated gas (Fig. 1.5; Spaans et al. 1995, van Kempen et al. 2009a, Yıldız et al. 2012). In this thesis, Chapters 2–5 discuss the analysis of CO and isotopologue lines observed toward low-mass protostars.
1.2.3 Molecular oxygen - O
2Oxygen is the third most abundant element in the Universe after hydrogen and helium, but it is still unclear what the main gas-phase reservoir is in dense molecular clouds. It is important to search for O2 in order to understand the origin of this and other vital molecules for life that are
chemically related, such as H2O. The O2 in our atmosphere causes strong absorption, therefore
interstellar O2needs to be observed by space instruments (Goldsmith et al. 2011). In Fig. 1.6, the
rotational energy level diagram of O2with the corresponding frequencies and EinsteinAcoefficients
to each level are presented (adopted from Goldsmith et al. 2011). Until recently, efforts to detect interstellar molecular oxygen had failed due to its very low abundance. Two earlier space missions (SWASandOdin) had dedicated instruments to detect O2, but provided mostly upper limits.SWAS
did not obtain a definitive detection of O2at 487 GHz toward nearby clouds (Goldsmith et al. 2000),
whereasOdinobservations of O2at 119 GHz gave upper limits of≤10−7(Pagani et al. 2003), except
for a tentative detection toward theρOphiuchi A cloud (X(O2)∼5×10⁻⁸; Larsson et al. 2007).
In theHerschelOxygen Project (HOP) key program, among the seven transitions shown in the Fig. 1.6, three relatively strong transitions at 487, 774, and 1121 GHz were targeted withHerschel -HIFI on various star-forming regions and dark clouds, and detected conclusively toward the Orion molecular cloud (Goldsmith et al. 2011) andρOphiuchi A (Liseau et al. 2012). In this thesis, a deep O2observation at 487 GHz toward the deeply embedded protostar NGC 1333 IRAS 4A, also
1.3 Observations
Figure 1.6–Lower rotational energy level diagram of the O2molecule with the corresponding frequencies and EinsteinAcoefficients to each level (Goldsmith et al. 2011). The 487 GHz transition observed withHerschel
HIFI toward IRAS 4A is shown with dashed blue line. The 774 GHz and 1121 GHz transitions are observed and detected in Orion.
1.3 Observations
I
n this thesis, observations from different ground- and space-based telescopes were used to obtain the relevant data to study the protostellar environment. The space-based observations are cen-tered on the theHerschelSpace Observatory, whereas for the ground-based observations, Atacama Pathfinder EXperiment (APEX), James Clerk Maxwell Telescope (JCMT), IRAM 30m telescope, and Onsala 20m Radiotelescope are used. Information about the sample and the observing program (WISH) is given in Sect. 1.4.1.3.1
Herschel
Space Observatory
TheHerschelSpace Observatory1 is a cornerstone mission of European Space Agency (ESA) that
aims to study the Universe at far-infrared and submillimeter wavelengths (Pilbratt et al. 2010). Its main objectives are: to study the formation of galaxies in the early universe and their subsequent evolution; study the formation of stars and their interaction with the interstellar medium; observe the chemical composition of the atmospheres and surfaces of comets, planets and satellites; and investigate the molecular chemistry of the universe. The telescope has a Cassegrain design 3.5 meter diameter primary mirror, which is the largest single mirror ever built and launched into space for astronomy to date. The mirror is made of silicon carbide (SiC), which is a ceramic material with a good level of thermal conductivity and a small thermal expansion coefficient (Lemke 2008).
Chapter 1 –
Introduction
Herschelwas launched together with thePlanckObservatory from French Guyana by an Ariane– 5 rocket on May 14, 2009. Both are currently located in Lissajous orbits about the second Lagrange point of the Sun-Earth system (L2), which is around 1.5 million kilometers away from the Earth. The L2 point is one of the ideal locations, where the observatory uses the Earth’s gravity to put the telescope in a stable orbit, and the Earth and the Moon are distant enough to add negligible heating. Having these sources in approximately the same direction as the Sun allows enhanced observation efficiency and flexibility. Its large single-sided radiation shield blocks the thermal radiation from the Sun and the Earth, and by using the fact that space is intrinsically cold allows passive cooling of the telescope mirror to approximately 80 K. The instruments operate at much lower temperatures, which is achieved by cooling via Helium-3 (3He) to reduce the temperature to close to absolute zero
temperatures, e.g., 300 mK to use for the PACS and SPIRE bolometers. The HIFI mixers on the other hand operate between 2–4 K.
The liquid helium tank holds 2400 litres, which weighs 335 kg and the whole probe weighs 3.3 tons. The vaporisation rate is 2 mg/sec, meaning that it is aimed to supply a four-year mission with about 7000 hours of science time per year (see review from Lemke 2008). Three science instruments are located in the cryo-vacuum of the helium container, which have different wavelength coverages (Fig. 1.7):
• HIFI (Heterodyne Instrument for the Far Infrared) is a very high resolution heterodyne spec-trometer sensitive to 480–1250 and 1410–1910 GHz (157–625 microns) built by a con-sortium of institutes under leadership of SRON Netherlands Institute for Space Research (Groningen, The Netherlands; de Graauw et al. 2010). The details of this instrument follow in Section 1.3.2.
• PACS (Photodetector Array Camera and Spectrometer) is an imaging photometer and medium resolution grating spectrometer sensitive to the wavelength range from 60 to 210µm, built under leadership of the Max Planck Institute for Extraterrestrial Physics (Garching, Ger-many; Poglitsch et al. 2010). PACS consists of 5×5 spatial-pixels (spaxels) with a field-of-view covering 47++at the resolution of 9.4++.
• SPIRE (Spectral and Photometric Imaging Receiver) is an imaging photometer and an imag-ing Fourier transform spectrometer sensitive to the wavelength range from 200–670µm built under leadership of the University of Wales (Cardiff, UK; Griffin et al. 2010).
These instruments complement each other in terms of their capabilities. In this thesis, primarily HIFI observations are used, therefore the following section continues with detailed information on the HIFI instrument and its data reduction.
1.3.2 Heterodyne Instrument for the Far-Infrared (HIFI)
The Heterodyne Instrument for the Far-Infrared (HIFI2) is an ultra high spectral resolution
het-erodyne spectrometer with frequency ranges covering from 480–1250 GHz and 1400–1900 GHz (Fig. 1.8). Due to the high water content of the Earth’s atmosphere, these wavelengths mostly can-not be observed with ground-based telescopes. HIFI’s core scientific goals are to study the ISM in the Milky Way and other galaxies; stellar evolution, especially the formation and the late stages; and Solar System. Some of the key molecules that are targeted are H2O, O2, CO, OH, and HDO. 2Technical information about HIFI can be found in the “HIFI Observers Manual” and “HIFI Users Manual”
from the ESA website.
1.3 Observations
Figure 1.7–(Left:) HerschelSpace Observatory and(right:)its three on-board instruments, HIFI, PACS, and SPIRE (Image Credits: ESA).
Figure 1.8–Focal plane unit of the Heterodyne Instrument for the Far-Infrared (HIFI) instrument. Image Credit: ESA
HIFI has seven mixer bands (Bands 1–7) with horizontal (H) and vertical (V) polarizations. Bands 1 to 5 are using heterodyne SIS (Superconductor-Insulator-Superconductor) mixers to op-erate at 480–1250 GHz. Bands 6 and 7 use HEB (Hot Electron Bolometer) mixers for covering 1400–1900 GHz, which is better suited to detect radiation above 1000 GHz. In Table 1.1, the fre-quency ranges of the HIFI bands, the type of the mixers used, and the observed transitions that were used in this thesis are tabulated.
Chapter 1 –
Introduction
Table 1.1– Overview of the HIFI bands
HIFI Band Frequency Frequency Mixer Observed Moleculesa HPBW
(Min)[GHz] (Max) [GHz] (Min)[”]
Band 1a 487.6 553.4 SIS O2, C18O 5–4 44
Band 1b 562.6 628.4 SIS . . . 38
Band 2a 634.1 717.9 SIS . . . 34
Band 2b 722.1 793.9 SIS . . . 30
Band 3a 807.1 851.9 SIS, Diplexer . . . 27
Band 3b 866.1 952.9 SIS, Diplexer 13CO 8–7 25
Band 4a 957.2 1052.8 SIS, Diplexer C18O 9–8 22
Band 4b 1054.7 1113.8 SIS, Diplexer 13CO, C18O 10–9 20
Band 5a 1116.2 1235.8 SIS 12CO 10–9 19
Band 5b 1235.2 1271.8 SIS . . . 17
Band 6a 1430.2 1557.8 HEB, Diplexer . . . 15
Band 6b 1578.2 1697.8 HEB, Diplexer . . . 13
Band 7a 1701.2 1793.8 HEB, Diplexer . . . 13
Band 7b 1793.2 1901.8 HEB, Diplexer . . . 12
Notes:aThe molecules that are observed and analysed in this thesis.
two Wide-Band Acousto-Optical Spectrometers (WBS) and two High Resolution Autocorrelation Spectrometers (HRS) each with H- and V polarizations. The observations are conducted for each of the spectrometers simultaneously. The WBS covers the full intermediate frequency bandwidth of 2.4 GHz in the highest frequency bands (Bands 6 and 7) and 4 GHz in all other bands at a single resolution (1.1 MHz∼0.2–0.7 km s−1). The HRS have variable resolution from 0.125 to 1.00 MHz
with subbands sampling up to half the 4 GHz intermediate frequency range. Subbands have the flexibility of being placed anywhere within the 4 GHz range. The HRS can be split up to allow the sampling of more than one part of the available range (for detailed information, see “HIFI Users Manual3” and “HIFI Observers Manual4”). The beam size (HPBW) of HIFI ranges from 42++ at
480 GHz to 12++at 1900 GHz (Table 1.1). The in-flight performance and the calibration of HIFI are
described in Roelfsema et al. (2012).
Heterodyne principle
Submillimeter wavelengths lie in between IR and radio wavelengths. The optical technology is very good in the near-IR side of the spectrum and on the other hand, electronics are quite advanced on the radio side of the spectrum. However, there is no direct method to amplify weak signals at submillimeter wavelengths. The solution to this problem is accomplished with theheterodyne tech-nique, by bringing the signal down in frequency to radio wavelengths without losing its information from the original sky signal.
HIFI uses heterodyne technology in order to observe at far-infrared and submillimeter wave-lengths at very high spectral resolution (resolving power ofλ/∆λ∼106). In Fig. 1.9, a basic
dia-gram of a submillimeter telescope is shown. In principle, the signal from an astronomical source at a frequencyνsky(e.g., 812 GHz) is caught by the highly accurate mirror (dish), and it is mixed with 3http://www.sron.rug.nl/hifi_icc/hifi-um/hifi-um.html
4http://herschel.esac.esa.int/Docs/HIFI/html/hifi_om.html
1.3 Observations
Figure 1.9–Representative basic diagram of a submillimeter telescope.
a constant signal that is artificially generated by the local oscillator (LO)νLO(e.g., 807 GHz). The
mixing is done in the heterodyne receiver via high technology mixers at superconducting tempera-tures. The output electrical signals contain the sum and the difference frequencies atνLO+νskyand
νLO-νsky. Although the sum frequency component is filtered away, however, the difference frequency
component produces the intermediate frequencyνIF(e.g., 5 GHz), which is then sent to HIFI’s WBS
and HRS spectrometers for the spectral analysis (de Graauw et al. 2010, Roelfsema et al. 2012).
Observing modes
In HIFI, threeAstronomical Observing Templates (AOTs) are available in order to perform observations: Single Pointing: (AOT I) for observing astronomical sources at one position on the sky; Mapping: (AOT II) for observing extended regions; andSpectral Scanning: (AOT III) for surveying a single position on the sky over a continuous range of frequencies selected within the same LO band. Each of these AOT’s can be used in a variety of different observing modes to provide the best quality data. The HIFI observing modes are:
Dual Beam Switch (DBS):Internal chopper mirror within HIFI is used to move the beam to a reference position up to 3 arcmin away from the target position. It is best used for non-crowded regions.
Position Switch (PSw):The HIFI beam is pointed to clean reference position, which is selected in a nearby region to the target.
Frequency Switch (FSw):The LO frequency is shifted by a small amount (a few tens of MHz), and the lines of interest still remain observable at two LO frequencies.
Load Chop:An internal cold source is used as a reference and the chopping mirror alternately looks at the target on the sky and an internal source of radiation.
In this thesis, we only used data of single pointing observations conducted primarily with “Dual Beam Switch (DBS)” or “Position Switch” observing modes.
HIFI noise characteristics
Chapter 1 –
Introduction
1.5 2.0 2.5 3.0 3.5 4.0 4.5 log(Int.Time) [sec]
−3.0
−2.5
−2.0
−1.5
−1.0
−0.5
lo
g(
rm
s)
[K]
1342192365−Band 1b 1342201585−Band 4b 1342235779−Band 5a
Figure 1.10–Slopes show the decreasingrmswith increasing integration time. The green lines behind the observed points show the expected rmsevolution fol-lowing√1/tto indicate the expected behavior.
which then process all individual on-target data into Level 2 spectra with proper frequency scale and calibration. Since all individual on-target spectra are consecutive in time, the applied method is as follows: the first observed spectrum is taken and thermsis calculated, then the next spectrum is averaged with the first two (1st+2nd) and thermsis calculated again. Then the third spectrum
is averaged with the previously averaged spectra (1st+2nd) and thermsis calculated, and so on.
This process is continued by adding the next spectrum to the previously averaged spectra until the final spectrum. Figure 1.10 shows examples ofrmsversus integration time on three observations; e.g, obsid-1342192365 is a Band 1b observation, obsid-1342201585 is a Band 4b observation, and obsid-1342235779 is a Band 5a observation. All these observations are conducted in DBS FastChop mode. The green line shows the expectedrmsevolution following√1/tfor easy comparison. The slopes clearly show that the noise goes down with the increasing integration time, even long inte-grations of several hours. This is important to reach many of the HIFI science goals, including the search for O2.
1.3.3 Ground-based telescopes
Atacama Pathfinder EXperiment
The Atacama Pathfinder EXperiment (APEX5) is a 12-meter submillimeter telescope at an
al-titude of 5100 meters at Llano de Chajnantor in Chile (Fig 1.11left). It has various instruments operating from∼200 GHz up to THz frequencies. In this thesis, we primarily used the CHAMP+ instrument (Kasemann et al. 2006, Güsten et al. 2008) in order to observe high-JCO lines (Jup=6
up to 8). It is a PI instrument built by Max Planck Institute for Radioastronomy, Germany (PI: R. Güsten) with contribution from SRON-Groningen, the Netherlands. The instrument consists of two heterodyne receiver arrays, each with seven pixel detector elements for simultaneous operations in the 620–720 GHz and 780–950 GHz frequency ranges. The APEX beam sizes correspond to 8++at
809 GHz and 9++at 691 GHz. Its state-of-the-art technology combined with excellent atmospheric
conditions at the site makes the instrument ideal to observe high-frequency molecular transitions.
5This thesis is based on data acquired with the Atacama Pathfinder Experiment (APEX). APEX is a collab-oration between the Max-Planck-Institut für Radioastronomie, the European Southern Observatory, and the Onsala Space Observatory.
1.4 WISH
Figure 1.11–Left:12-m APEX telescope located at the Cerro Chajnantor plateu at 5100-m altitude.Right:
15-m JCMT located at Mauna Kea, Hawaii. Photo Credits: Umut Yıldız.
A detailed description of the instrument and observations of several sources in the current sam-ple have been presented in van Kempen et al. (2009a,b,c), Yıldız et al. (2012, in prep (Chapter 4)). Maps of the12CO 6–5, 7–6 and13CO 6–5 lines over a few arcmin region were observed for all Herschelsources visible from Chajnantor, whereas13CO 8–7 and C18O 6–5 lines were obtained for
selected objects in staring mode. In addition, lower-Jtransitions were observed for southern sources using various receivers at APEX (van Kempen et al. 2006, 2009a,b,c). These new high-JCO ob-servations along with molecular line surveys probe the velocity structure, physical conditions, and molecular abundances of dense gas around the protostars.
James Clerk Maxwell Telescope
The James Clerk Maxwell Telescope (JCMT6) is a 15-meter submillimeter telescope at an
al-titude of 4092 meters on Mauna Kea, Hawaii (Fig 1.11right). Two instruments, HARP-B and RxA, are primarily used in order to observe low-JCO lines (e.g., 3–2 and 2–1) in this thesis. The HARP-B instrument (Dent et al. 2000, Smith et al. 2008, Buckle et al. 2009) is used to observe the 3–2 lines, which allows heterodyne spectroscopy with instantaneous mapping capability. The in-strument consists of 16 SIS detectors with 4×4 pixel elements of 15++each at 30++separation. The
tuning range is 325–375 GHz and it covers an area of 2+×2+region in the sky. The beam size of each
receptor is approximately 14++. RxA is a single-pixel double side band (DSB) receiver, operating
between 211 and 276 GHz range. Our CO 2–1 lines were observed with RxA receiver with a beam size of∼23++. A fraction of the observations were obtained from the JCMT public archive7whereas
the rest were obtained in dedicated campaigns.
1.4 WISH
6The JCMT is operated by The Joint Astronomy Centre on behalf of the Science and Technology Facilities Council of the United Kingdom, the Netherlands Organisation for Scientific Research, and the National Re-search Council of Canada.
Chapter 1 –
Introduction
T
he “Water In Star-forming regions withHerschel(WISH8)” is a 425 hours guaranteed timekey-program onHerschel Space Observatory in order to study the physical and chemical structure of star-forming regions by focussing on H2O and other related species (van Dishoeck et al.
2011). The project involves more than 80 international scientists in 35 institutes from 10 countries. The program covers∼80 sources in seven sub-programs with different luminosities ranging from low- (0.8 L$) to high-mass protostars (105L
$); and in different evolutionary stages from pre-stellar
cores to protoplanetary disks. In the WISH project, high spectral and spatial resolution spectroscopy is obtained by using both HIFI and PACS instruments.
Wateris the primary target in the project, because it is one of the most abundant key molecules in star-forming regions so its formation in different environments needs to be understood. It is a cornerstone in the oxygen chemistry network, which is the basis for many other chemical reac-tions. Conversely, water is an excellent tracer for probing different physical conditions since its abundance variations are very large: in cold regions the water abundance is very low, only 10−9–
10−8with respect to H
2, whereas in hot regions, most of the gas-phase oxygen is locked in water
with an abundance of∼10−4. Water is also found to be an excellent tracer of the dynamical
pro-cesses in outflows, which contain large amounts of water (Kristensen et al. 2011, Vasta et al. 2012, Santangelo et al. 2012). More information about the project can be found in the review articles of van Dishoeck et al. (2011) and Kristensen & van Dishoeck (2011), and the results of the individual subprograms can be found in the dedicated website8.
When quoting envelope or outflow abundances, it is of course important to compare this abun-dance with respect to something. At outflow positions far from the central source,SpitzerSpace Telescope data provide direct constraints on the H2column density from observations of low-J
ro-tational lines in the mid-infrared. Towards the central source position, H2 is not detected because
the extinction is too high even at MIR wavelengths (Maret et al. 2009). CO is a chemically stable molecule with many transitions at sub-mm and mm wavelengths. Therefore, observations of CO in many rotational transitions can provide the reference frame for the column densities of cold, warm, and hot gas, and thereby a reference frame against which to measure the H2O abundance as well as
that of other species, e.g., O2.
This thesis is based on the data observed with HIFI in the low-mass subprogram. In total, the sample contains 29 low-mass Class 0 and Class I sources. The sample selection criteria with the co-ordinates and other basic information of the source list are presented in van Dishoeck et al. (2011) with updates in Kristensen et al. (2012). The low-mass sources are located in various nearby molec-ular clouds, e.g., the Perseus, Ophiuchus, Taurus, and Serpens molecmolec-ular clouds. Fortunately, as it turns out, several CO and isotopolog transitions fall close to H2O transitions making it possible to
observe them in one setting and thereby maximizing telescope efficiency. These include:13CO 10–9
with H2O 111–000 (40 min); C18O 5–4 with H182O 110–101 (60 min); C18O 9–8 with H2O 202–111
(20 min); and C18O 10–9 with H
2O 312–303(30 min or 5 hours). An example setup is shown in
Fig. 1.12, C18O 9–8 (987.56 GHz) with H
2O 202–111(987.92 GHz). Two CO surveys are presented
in this thesis (Chapters 3 and 5)
1.5 WISH live data show
W
ISH HIFI data consist of either “Single Pointing” (DBS, PSw, FSw, LoadChop) or “Map-ping” (OTF PSw, FSw) observations. The WISH observations were conducted between February 3, 2010 until February 25, 2012 by executing 821 AORs (Astronomical ObservingRe-8http://www.strw.leidenuniv.nl/WISH/
1.5 WISH live data show
Figure 1.12–WISH observations aim to cover as many lines as possible in one observing setup. The above example shows the setup for C18O 9–8 (987.56 GHz) with H2O 202–111(987.92 GHz).
Figure 1.13–A glimpse of “WISH Live Data Show” database that is available to the WISH team members.
quest). All the WISH proprietary data are collected in one computer at the Leiden Observatory. In order to provide easy and constant access to all WISH data by the team worldwide, a MySQL and Python powered database and HIFI data reduction pipeline has been constructed. This password protected database is called the “WISH Live Data Show (LDS)” (Fig. 1.13). Although the WISH project also contains PACS observations, PACS data are reduced by other team members and only collected in the LDS. The LDS data reduction pipeline primarily works for HIFI data, which in-teracts with theHerschelScience Archive (HSA),HerschelInteractive Processing Environment (HIPE), and GILDAS-CLASS softwares.
The database syncs with HSA for new observations every day. Then the pipeline downloads and reduces new HIFI data using the latest officially released HIFI pipeline, which therefore provides almost publication quality data 24 hours after theHerschelobservations. The data are available in different formats, e.g., HIPE imported, CLASS, fits, and also quick image previews in png and eps format. We regularly check if HSA provides the data by using new pipelines, in that case all the observations are re-downloaded and re-reduced. In order to compare with old data reductions, nothing is deleted from the database, even data reduced with HIPE v.1.0 up to the latest version HIPE v.10.0 are available. Re-pipelining was done for all observations with the new calibration before publishing the HIFI first results papers in 2010 (HIPE v.1.x, v.2.x to HIPE v.3.0.1).
The steps in the pipeline are fully automatic, these include:
• Connecting to HSAObservation Logat 00:00 hrs
• Checking the new observations, if so, adding them to pipeline queue
• Connecting to HSA and importing data to HIPE
• Saving imported observation to disk
Chapter 1 –
Introduction
• Stitching the subbands
• Saving the stitched spectra as png and eps files
• Creating fits files for stitched and non-stitched spectra
• Converting fits files to GILDAS-CLASS format
• Creating webpages to display the output
• Updating the database if the pipeline is successful
• Saving all the output by adding the current date to filename in the “Log” folder
If re-pipelining, removing standing waves, or any other additional data manipulation is nec-essary, these steps are included after importing the data to HIPE. Re-pipelining starts from Level 0.5 data, which is mostly raw data but the data are processed such that backend (spectrometer) ef-fects are removed and frequency calibrated. This database will become public after the WISH key program is finalized and it will be transferred to our legacy databaseLOMASS9 (Leiden Observa-tory Single-dish Submm Spectral Database of Low-mass YSOs), which will archive thousands of spectra observed with many telescopes for many low-mass protostars.
1.6 This thesis
T
he primary focus of this thesis is theformation of low-mass protostars, specifically the earliest deeply embedded phase, when material from the collapsing envelope is still accreted onto the growing young star. A variety of state-of-the-art sub-/mm instruments are used for the observations in order to understand the physical and chemical nature of this phase, centered around theHerschelSpace Observatory. Rotational transitions of molecules, specifically, low- and high-lying lines of CO and its isotopologs have been used to characterize the YSO structure and kinematics. The high frequency observations withHerschelallow much warmer gas to be probed than was possible previously. The following questions are addressed:
• How is CO excited in the different parts of the YSOs, and what are the locations and relative importance of shocks and UV heating? Can we quantify this ‘feedback’ on the surroundings? How does this relate to what is seen in H2O?
• Does the CO excitation and do the line characteristics change with evolution from the deeply embedded Class 0 YSOs to less deeply embedded Class I YSOs?
• What is the CO abundance structure throughout the envelope: where is CO frozen out and where does it evaporate? Is it processed to other molecules on the grains?
• What is the abundance of O2 in protostellar environments? Why is it so anomalously low
compared with CO?
These questions are addressed in the following chapters.
Chapter 2 —Herschel-HIFI observations of high-Jlines (up toJu=10) of12CO,13CO, and
C18O are presented toward three deeply embedded low-mass protostars in the NGC 1333
star-forming region. The observations show several energetic components including shocked and qui-escent gas. The results are: (i)12CO line widths increase from lower-Jtoward higher-Jtransitions.
(ii) CO and its isotopologues trace different material. The12CO 10–9 lines are dominated by broad
(FWHM25–30 km s−1) emission indicating a large-scale shock process (>1000 AU). Several CO
and13CO line profiles reveal a medium-broad component (5–10 km s−1), seen prominently in H
2O
lines, indicative of small-scale shocks (<1000 AU). Narrow C18O lines (2–3 km s−1) trace the
qui-escent envelope material. (iii) Higher-Jisotopologue lines (e.g., C18O 9–8 and 10–9;E
up=237 and 9http://lomass.strw.leidenuniv.nl
1.6 This thesis
289 K) probe high temperatures. However, analysis shows that for a power-law envelope at least 50% of the observed emission still comes from the colder<40 K parts of the envelope. Three dif-ferent models using theRATRANradiative transfer code are applied to the optically thin C18O lines
to quantify the CO abundance. For the “constant” profile, the observed line intensities cannot all be reproduced simultaneously. For the “anti-jump” model, the outer abundance,X0, was kept high for
densities lower than the desorption density,nde. It fits well the lower-Jlines, but the higher-Jlines
are underproduced. In the “drop” model, the inner abundance,Xin, increases aboveTev. This model
fits well all lines, howeverXinis a factor of∼3-5 belowX0for the best fit to the IRAS 2A data. This
suggests that a significant fraction of the CO ice is transformed to other species on the grains.
Chapter 3 —This chapter builds on the results of Chapter 2 by presentingHerschel-HIFI ob-servations of the same CO lines for a much larger sample of 26 deeply embedded low-mass Class 0 and Class I young stellar objects. This is the first large-scale spectrally resolved high-JCO survey ever conducted for these types of sources. Complementary lower-JCO maps were also observed using ground-based JCMT and APEX telescopes and convolved to matching beam sizes. The12CO
10–9 line is detected for all objects and can generally be decomposed into a narrow and broad component due to the quiescent envelope and entrained outflow material, respectively. The me-dian excitation temperatures for12CO,13CO, and C18O derived from single-temperature fits to the Jup=2–10 integrated intensities are∼70 K, 48 K and 37 K, respectively, with no significant diff
er-ence between Class 0 and Class I sources and no trend withMenvorLbol. Thus, in contrast with the
continuum SEDs, the spectral line energy distributions (SLEDs) do not show an evolution during the embedded stage. In contrast, the integrated line intensities of all CO isotopologs show a clear decrease with evolutionary stage as the envelope is dispersed.
Chapter 4 —Two well-known Class 0 low-mass protostars NGC 1333 IRAS 4A and IRAS 4B are mapped in the12CO 6–5 transition in order to characterize the warmer parts of the protostellar
envelope using the new generation APEX-CHAMP+array receiver. This study allowed us to quan-tify the feedback of the protostars on their surroundings in terms of shocks, ultraviolet (UV) heating, photodissociation, and outflow dispersal. The map shows that the broad CO emission-line profiles trace entrained shocked gas along the outflow walls, which have an average temperature of∼100 K. At other positions surrounding the outflow and the protostar, the 6–5 line profiles are narrow indi-cating UV heating. The narrow13CO 6–5 data directly reveal this UV heated gas distribution for
the first time. The amount of UV-photon-heated gas and outflowing gas are quantified from the combined12CO and13CO 6–5 maps and found to be comparable within a 20++radius around IRAS
4A, which implies that UV photons can affect the gas as much as the outflows. Weak [Ci] emission
throughout the region indicates that there is a lack of CO dissociating photons. As for IRAS2A studied in Chapter 2, modeling of the C18O lines demonstrates the necessity of a “drop” abundance
profile throughout the envelopes where the CO freezes out and is reloaded back into the gas phase through grain heating, thus providing quantitative evidence of the CO ice evaporation zone around the protostars. The inner abundances are less than the canonical value of CO/H2=2.7×10−4,
how-ever, strengthening the conclusion that there is some processing of CO into other species on the grains.
Chapter 5 —Large-scale CO maps of 26 low-mass young stellar objects are obtained using APEX-CHAMP+(12CO and13CO 6–5), together with JCMT-HARP-B (12CO and13CO 3–2). The
maps are high spatial and spectral resolution, particularly CO 6–5 maps have 9++ pixels thus
Chapter 1 –
Introduction
methods to determine the outflow parameters and the results are compared with higher-JCO lines obtained withHerschel. All sources in our sample show outflow activity via CO line wings. One of the key parameters, the outflow force,FCO, is measured and correlations with other physical
pa-rameters are sought.FCOversusLbolplots show that Class 0 sources have more powerful outflows
than the Class I sources, even if their luminosities are comparable. Overall, the various outflow pa-rameters indicate reduced outflow activity with evolutionary stage, consistent with previous studies.
FCOis directly proportional withMenvandMCO, indicating that higher outflow forces require higher
envelope masses and involve higher outflow masses. Comparison with high-JCO lines probed by PACS, which trace currently shocked gas, shows that although the 6–5 and PACS transitions do not probe the same gas component, the two components are still linked. However, the link does not extend down to CO 3–2. The conclusion is that CO 6–5 depends on the shock characteristics (pre-shock density and velocity), whereas CO 3–2 is more sensitive to conditions in the surrounding environment (density).
Chapter 6 —Herschel-HIFI observations of molecular oxygen, O2, at 487 GHz toward the
deeply embedded low-mass Class 0 protostar, NGC 1333-IRAS 4A, are presented. The deep HIFI spectrum fails to detect O2at the velocity of the dense protostellar envelope, implying one of the
deepest upper limits of O2/H2 at≤6×10⁻⁹ (3σ). However, a tentative (4.5σ) detection of O2 is
seen at the velocity of the surrounding NGC 1333 molecular cloud, shifted by 1 km s−1 relative
to the protostar. Pure gas-phase models and gas-grain chemical models overproduce O2 in the
dense envelope, unless a long pre-collapse stage (∼106years) is included, during which atomic and
molecular oxygen are frozen-out onto the dust grains and fully converted into H2O. These results
imply that the gas and ice that enter protoplanetary disks are poor in O2.
1.7 Future outlook
F
urther advances in our understanding of star formation will come from new technologies forhigh-frequency or highly efficient observations. Single dish millimeter telescopes will include instruments with many pixel detectors (e.g., 64-pixel heterodyne SuperCam at 345 GHz on the Sub-Millimeter Telescope). These array receivers will make it possible to produce large scale velocity maps of star-forming clouds that complement the bigHerschelcontinuum surveys. This will aid in deciphering how dense cores form out of the larger filamentary structures seen in the Herschel images and how they eventually lead to the formation of individual stars or groups of stars.On the other hand, the newly inaugurated Atacama Large Millimeter/submillimeter Array (ALMA), the revolutionary interferometric observatory at an altitute of 5100 meters, opens up an entirely new era in the study of protostars, from low to high mass. Its 66 antennas with baselines ranging up to 16 km provide unprecedented sensitivity and angular resolution, down to 1 AU in the nearest star-forming regions. When working at full capacity, it will be well suited to unravel the physical mechanisms behind the formation of protostellar jets and outflows. Also, knowledge of binary star formation in the earliest deeply embedded phase is still lacking and the interactions of the outflows of binaries can only be disantangled with these high precision instruments. Thus, star formation research poses many interesting questions that can be answered in the coming years, highlighting its bright and exciting future.
Acknowledgements
I would like to thank to Carolyn McCoey, Ian (Max) Avruch, Per Bjerkeli and Robin Lombaert for their help on the HIFI noise report, and Erik Deul for setting up the MySQL system for our WISH database.
2
Herschel-HIFI observations of
high-
J
CO lines in the NGC 1333
low-mass star-forming region
U.A. Yıldız, E.F. van Dishoeck, L.E. Kristensen, R. Visser, J.K. Jørgensen, G.J. Herczeg, T.A. van Kempen, M.R. Hogerheijde, S.D. Doty, A.O. Benz, S. Bruderer, S.F. Wampfler, E. Deul, R. Bachiller, A. Baudry, M. Benedettini, E. Bergin, P. Bjerkeli, G.A. Blake, S. Bontemps, J. Braine, P. Caselli, J. Cernicharo, C. Codella, F. Daniel, A.M. di Giorgio, C. Dominik, P. Encrenaz, M. Fich, A. Fuente, T. Giannini, J.R. Goicoechea, Th. de Graauw, F. Helmich, F. Herpin, T. Jacq, D. Johnstone, B. Larsson, D. Lis, R. Liseau, F.-C. Liu, M. Marseille, C. McCoey, G. Melnick, D. Neufeld, B. Nisini, M. Olberg, B. Parise, J.C. Pearson, R. Plume, C. Risacher, J. Santiago-García, P. Saraceno, R. Shipman, M. Tafalla, A. G. G. M. Tielens, F. van der Tak, F. Wyrowski, P. Dieleman, W. Jellema, V. Ossenkopf, R. Schieder, J. Stutzki
Chapter 2 –
H
erschel-HIFI observations of high-JCO lines in NGC 1333Abstract
In this chapter, we study theHerschel-HIFI observations of high-Jlines (up toJu=10) of12CO, 13CO and C18O are presented toward three deeply embedded low-mass protostars, NGC 1333
IRAS 2A, IRAS 4A, and IRAS 4B, obtained as part of theWater In Star-forming regions with Herschel(WISH) key program. The spectrally-resolved HIFI data are complemented by ground-based observations of lower-JCO and isotopologue lines. The12CO 10–9 profiles are dominated
by broad (FWHM 25–30 km s−1) emission. Radiative transfer models are used to constrain the
temperature of this shocked gas to 100–200 K. Several CO and13CO line profiles also reveal a
medium-broad component (FWHM 5–10 km s−1), seen prominently in H
2O lines. Column
densi-ties for both components are presented, providing a reference for determining abundances of other molecules in the same gas. The narrow C18O 9–8 lines probe the warmer part of the quiescent
en-velope. Their intensities require a jump in the CO abundance at an evaporation temperature around 25 K, thus providing new direct evidence for a CO ice evaporation zone around low-mass protostars.
2.1 Introduction
2.1 Introduction
T
he earliest protostellar phase just after cloud collapse – the so-called Class 0 phase – is best studied at mid-infrared and longer wavelengths (André et al. 2000). To understand the physical and chemical evolution of low-mass protostars, in particular the relative importance of radiative heating and shocks in their energy budget, observations are required that can separate these components. The advent of the Heterodyne Instru-ment for the Far-Infrared (HIFI) onHerschelopens up the possibility to obtain spectrally resolved data from higher-frequency lines that are sensitive to gas temperatures up to several hundred Kelvin.Because of its high abundance and strong lines, CO is the primary molecule to probe the various components of protostellar systems (envelope, outflow, disk). The main advantage of CO compared with other molecules (including water) is that its chemistry is simple, with most carbon locked up in CO in dense clouds. Also, its evaporation temperature is low, around 20 K for pure CO ice (Collings et al. 2003, Öberg et al. 2005), so that its freeze-out zone is much smaller than that of water. Most ground-based observations of CO and its isotopologues have been limited to the lowest rotational lines originating from levels up to 35 K. ISO has detected strong far-infrared CO lines up toJu=29 from
Class 0 sources (Giannini et al. 2001) but the emission is spatially unresolved in the large 80” beam. ISO also lacked the spectral resolution needed to separate the shocked and quiescent gas or to detect intrinsically-weaker13CO and C18O lines on top of the strong
continuum.
The NGC 1333 region in Perseus (d =235 pc; Hirota et al. 2008) contains several deeply embedded Class 0 sources within a∼1 pc region driving powerful outflows (e.g., Liseau et al. 1988, Hatchell & Fuller 2008). The protostars IRAS 4A and 4B, separated by ∼31”, and IRAS 2A are prominent submillimeter continuum sources (luminosities of 5.8, 3.8 and 20L$) with envelope masses of 4.5, 2.9 and 1.0 M$, respectively (Sandell et al.
1991, Jørgensen et al. 2009). All three are among the brightest and best studied low-mass sources in terms of molecular lines, with several complex molecules detected (e.g., Blake et al. 1995, Bottinelli et al. 2007). Here HIFI data of CO and its isotopologues are presented for these three sources and used to quantify the different physical components. In an accompanying letter, Kristensen et al. (2010) present complementary HIFI observa-tions of H2O and analyze CO/H2O abundance ratios.
2.2 Observations and results
T
he NGC 1333 data were obtained with HIFI (de Graauw et al. 2010) onboard theHerschelSpace Observatory (Pilbratt et al. 2010), in the context of the WISH key