Colour variations in the GRB 120327A afterglow
A. Melandri
1, S. Covino
1, E. Zaninoni
2, S. Campana
1, J. Bolmer
3, B. E. Cobb
4, J. Gorosabel
5,∗, J.-W. Kim
6,27, P.
Kuin
7, D. Kuroda
8, D. Malesani
9, C. G. Mundell
10,11, F. Nappo
1, B. Sbarufatti
12, R. J. Smith
10, I. A. Steele
10, M.
Topinka
13, A. S. Trotter
14,15, F. J. Virgili
10, M. G. Bernardini
16,1, P. D’Avanzo
1, V. D’Elia
17,18, D. Fugazza
1, G.
Ghirlanda
1, A. Gomboc
19, J. Greiner
3, C. Guidorzi
20, J. B. Haislip
14, H. Hanayama
21, L. Hanlon
22, M. Im
6, K. M.
Ivarsen
14, J. Japelj
23, M. Jelínek
24, N. Kawai
8, S. Kobayashi
10, D. Kopac
23, A. P. LaCluyzé
14, A. Martin-Carrillo
22, D.
Murphy
22, D. E. Reichart
14, R. Salvaterra
25, O. S. Salafia
1, G. Tagliaferri
1, S. D. Vergani
261 INAF/Osservatorio Astronomico di Brera, via E. Bianchi 36, I-23807 Merate (LC), Italy
2 ICRANet-Rio, Centro Brasileiro de Pesquisas Físicas, Rua Dr. Xavier Sigaud 150, Rio de Janeiro, RJ, 22290-180, Brazil 3 Max-Planck-Institut für extraterrestrische Physik, Giessenbachstrasse 1, D-85748 Garching, Germany
4 Department of Physics, The George Washington University, Washington, D.C. 20052, USA
5 Instituto de Astrofísica de Andalucía (IAA-CSIC), Glorieta de la Astronomía s/n,18008, Granada, Spain 6 CEOU/Astronomy Program, Dept. of Physics & Astronomy, Seoul National University, Seoul, South Korea 7 Mullard Space Science Laboratory, University College London, Holmbury St Mary, Dorking, Surrey RH5 6NT, UK 8 Okayama Astrophysical Observatory, National Astronomical Observatory of Japan, Asakuchi, Okayama 719-0232, Japan 9 Dark Cosmology Centre, Niels Bohr Institute, University of Copenhagen, Juliane Maries Vej 30, 2100 Copenhagen, Denmark 10 Astrophysics Research Institute, Liverpool JMU, IC2, Liverpool Science Park, 146 Brownlow Hill, Liverpool L3 5RF, UK 11 Department of Physics, University of Bath, Claverton Down, Bath, BA2 7AY, UK
12 Department of Astronomy and Astrophysics, Pennsylvania State University, University Park, PA 16802, USA 13 Dublin Institute for Advanced Studies, 31 Fitzwilliam Place, Dublin 2, Ireland
14 Skynet Robotic Telescope Network, Dep. of Physics and Astronomy, Univ. of North Carolina, Chapel Hill, NC 27599-3255, USA 15 Department of Physics, North Carolina A&T State University, Greensboro, NC 27411, USA
16 Laboratoire Univers et Particules de Montpellier, Université Montpellier, Place Eugéne Bataillon, F-34095, Montpellier, France 17 INAF/Osservatorio Astronomico di Roma, via Frascati 33, I-00078 Monteporzio Catone (Roma), Italy
18 ASI Science Data Centre, Via del Politecnico snc, I-00133 Roma, Italy
19 Centre for Astrophysics and Cosmology, University of Nova Gorica, Vipavska 11c, 5270 Ajdovšˇcina, Slovenia 20 Dipartimento di Fisica, Universitá di Ferrara, via Saragat 1, I-44100 Ferrara, Italy
21 Ishigakijima Astronomical Observatory, NAO of Japan, 1024-1, Arakawa, Ishigaki, Okinawa 907-0024, Japan 22 University College Dublin, School of Physics UCD, Belfield, Dublin 4, Ireland
23 Faculty of Mathematics and Physics, University of Ljubljana, Jadranska 19, 1000 Ljubljana, Slovenia 24 Astronomical Institute, Czech Academy of Sciences, (ASU CAS), Ondˇrejov, Czech Republic 25 INAF/IASF Milano, via E. Bassini 15, I-20133 Milano, Italy
26 GEPI, Observatoire de Paris, CNRS, Univ. Paris Diderot, 5 place Jules Janssen, F-92190 Meudon, France 27 Korea Astronomy and Space Science Institute, Daejeon 34055, Korea
Received ; accepted
ABSTRACT
Aims.We present a comprehensive temporal and spectral analysis of the longSwiftGRB 120327A afterglow data to investigate the possible causes of the observed early time colour variations.
Methods.We collected data from various instruments/telescopes in different bands (X-rays, ultra-violet, optical and near-infrared) and determined the shapes of the afterglow early-time light curves. We studied the overall temporal behaviour and the spectral energy distributions from early to late times.
Results.The ultra-violet, optical, and near-infrared light curves can be modelled with a single power-law component between 200 and 2×10⁴s after the burst event. The X-ray light curve shows a canonical steep-shallow-steep behaviour, typical of long gamma-ray bursts. At early times a colour variation is observed in the ultra-violet/optical bands, while at very late times a hint of a re-brightening is visible. The observed early time colour change can be explained as a variation in the intrinsic optical spectral index, rather than an evolution of the optical extinction.
Key words. Gamma-ray burst: individual: GRB 120327A; ISM: dust, extinction
1. Introduction
The early afterglow is one of most interesting emission stages of Gamma-Ray Bursts (GRBs). In a few tens of seconds the
after-Send offprint requests to: [email protected] ∗
Deceased
glow emission (X-ray, ultra-violet, optical, infrared and radio) begins to dominate over the fading prompt (gamma-ray) emis-sion, and the time-scale and intensity of the phenomenon offer powerful diagnostics about the physical processes within the out-flow and about the environment of the progenitor (e.g. Vestrand
et al. 2006; Molinari et al. 2007; Melandri et al. 2008; Liang et al. 2013; Zaninoni et al. 2013).
Of particular interest are those few cases where a colour vari-ation during the early optical afterglow has been singled out (Ny-sewander et al. 2006; Morgan et al. 2014). GRB 120327A is one of such a few events. In general, early time colour variation can be the signature of rather different phenomena, e.g. the passage of a break frequency of the optical spectrum through the optical bands (e.g. Filgas et al. 2011), variation of the optical extinc-tion due to either dust photo-destrucextinc-tion (Morgan et al. 2014) or the outflow progression through a wind-shaped environment (Rykoffet al. 2004), and also the superposition of different emis-sion stages, such as forward and reverse shock (Kobayashi & Zhang 2003) in the context of the “fireball" model (Piran 2004). In this paper we report and discuss the observations of the long GRB 120327A, concentrating on the early time colour evo-lution of the optical light curve. Data are reported in Sect. 2. The results are presented in Sect. 3. The possible interpretative scenarios are discussed in Sect. 4 and conclusions are drawn in Sect. 5. The respective temporal and spectral decay indicesαand βare defined by fν(t)∝t−αν−β, and unless stated otherwise, all errors are reported at 1σ.
2. Observations
GRB 120327A was discovered by theSwiftsatellite (Gehrels et al. 2004) on March 27, 2012, at 02:55:16 UT (Sbarufatti et al. 2012). The bright X-ray and optical counterparts of this long gamma-ray burst (T90∼63 s; Krimm et al. 2012) were observed by the X-ray Telescope (XRT) and the Ultraviolet and Optical Telescope (UVOT). In the UV it was atU ∼18 a few minutes after the prompt event (Kuin et al. 2012). A redshift was quickly measured by Perley & Tanvir (2012) and Krühler et al. (2012) by absorption lines at z = 2.813. Several ground-based facili-ties observed the field and detected the counterpart in the optical and near-infrared wavelengths. The afterglow was also detected at 34 GHz with a flux density of about 0.7 mJy (Hancock et al. 2012).
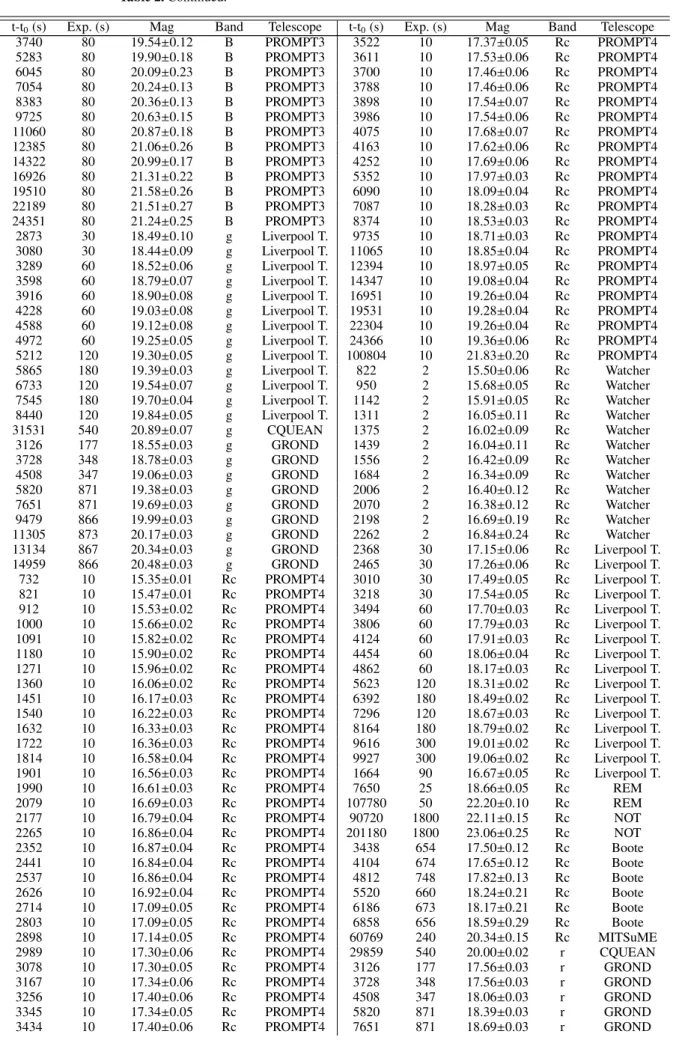
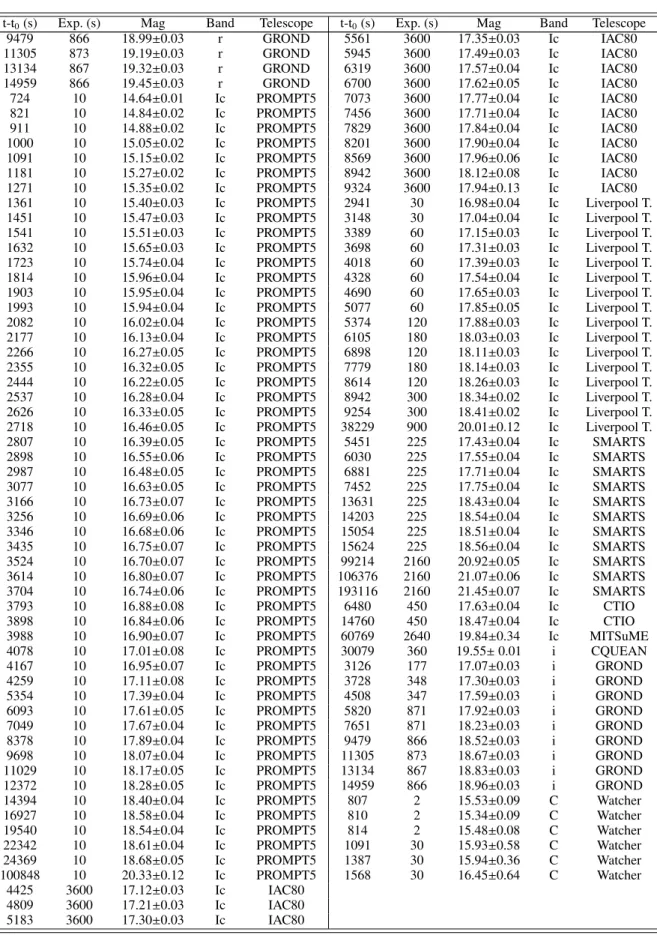
In this paper we retrieved and analysed XRT and UVOT data, together with REM telescope (Zerbi et al. 2001; Covino et al. 2004) near-infrared (NIR) data, IAC80, CTIO, BOOTES, PROMPT, Watcher, CQUEAN/2.1m Otto-Struve telescope (Park et al. 2012), GROND (Greiner et al. 2008), SMARTS, MITSuME, NOT, and Liverpool Telescope (LT; Steele et al. 2004) optical data. For the analysis we included also photo-metric data from LT-RINGO2 imaging polarimeter (Steele et al. 2017). Data are reduced and analysed following standard pro-cedures. Calibration was obtained by means of secondary stan-dard stars in the field provided by the APASS1 and 2MASS2 catalogues in the optical and NIR bands, respectively. Rcand Ic magnitudes have been obtained from APASSr andi mag-nitudes by means of suitable transformation equations. Optical SMARTS data are calibrated by means of a Landolt standard star field. ZY 2.1m Otto-Struve telescope magnitudes are cali-brated following Hodgkin et al. (2009). Optical and NIR mag-nitudes, not corrected for the Galactic reddening EB−V = 0.29 (Schlafly & Finkbeiner 2011), are reported in Table 2 (Online Material). These data supersede those published in Kuin et al. (2012), Covino et al. (2012), Gorosabel et al. (2012), LaClyuze et al. (2012), Meehan et al. (2012), Im et al. (2012), Cobb (2012),
1http://www.aavso.org/apass 2http://www.ipac.caltech.edu/2mass/
Kuroda et al. (2012a,b) and Smith & Virgili (2012). We also used in our analysis data from Sudilovsky et al. (2012).
3. Results
3.1. Light curves
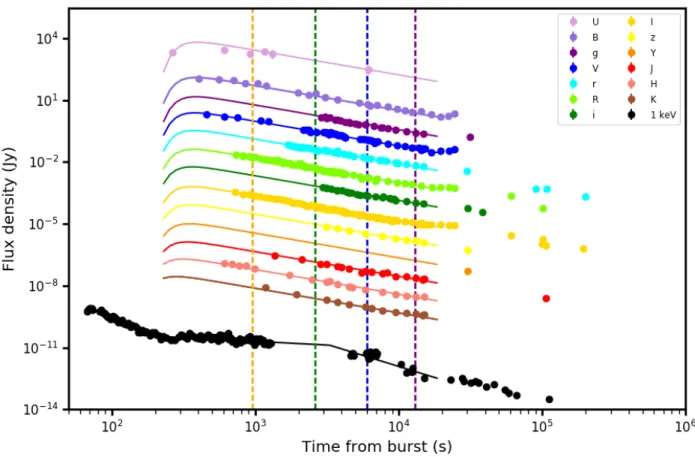
In Fig. 1 the available optical/NIR data are plotted together with the X-ray light curve at 1 keV. The X-ray afterglow shows a canonical steep-flat-steep evolution with a considerable variabil-ity superposed on the general trend. The initial X-ray decay (αX,1 ∼ 3) is consistent with the tail of the prompt BAT emis-sion. Between 3×10² and 3×10³ s the light curve flattens to αX,2∼0.4 and then it becomes steeper toαX,3∼2 up to the limit of detection.
The optical data start during the X-ray flat phase and show a colour evolution in the optical/NIR afterglow getting redder with time. The evolution is stronger in the bluer bands and more rapid at early-time. We performed a multi-band fit of the UV/optical/NIR data in the time interval [200, 2×10⁴] seconds (Fig. 1). Between 103−104s the more densely sampled optical bands follow a decayαopt ∼1.2. To visually emphasise the ob-served colour variation, in Fig. 2 we normalised all the early time data to the better sampledR-band, shifting all theU BV magni-tudes in order to have good accordance at the timet∼103s (as shown in Fig. 1 the afterglow temporal behaviour after that time is clearly achromatic in the UV/optical/NIR bands). As can be seen the more we move to bluer filters the larger is the deviation at early times from the estimated afterglow decay index. At late time the optical light curve shows the hint of a re-brightening that evolves from the red to the blue. However, the investigation of this late feature is beyond the purpose of this work.
3.2. Spectral energy distributions
For the spectral energy distribution (SED) fit we consider the absorption in the optical and X-ray ranges both locally (i.e., in the GRB host galaxy) and arising from the Milky Way (MW). For the optical band we used the extinction laws given by Pei (1992) (Eq. 20 and Table 4 therein) for the MW, the Large Mag-ellanic Cloud (LMC) and Small MagMag-ellanic Cloud (SMC). For the X-ray data, we considered the model for the photoelectric cross section per HI-atom units for a given metallicity presented by Morrison & McCammon (1983), assuming solar metallicity (e.g. Covino et al. 2013; Zaninoni et al. 2013).
In addition, D’Elia et al. (2014) showed that the SED of GRB 120327A is characterised by a powerful Lymanαemission with logNH∼22. This implies that the obtained photometry in the bands including hydrogen lines has to be corrected for the line emission. Moreover, some of our data are obtained with fil-ters that cover spectral ranges bluer than the Lymanα, i.e. about 460 nm in the observer frame. Together with the host galaxy extinction we therefore need to consider the absorption due to intergalactic-medium that can only be computed in statistical sense. We followed the recipe proposed by Japelj et al. (2012).
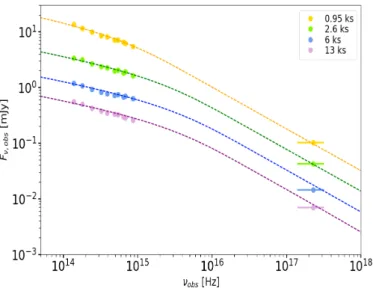
In Fig. 3 and Fig. 4 we show the results of the SEDs per-formed at four different time intervals between 700 and 18000 s after the burst event. The X-ray-to-optical spectral energy distri-butions are best fitted using a broken power-law3.
We fit the data considering two possible models (Fig. 4):
3A valid solution can still be obtained assuming a single power-law withβOX∼0.85. However, since the temporal decays in the X-ray and
Fig. 1.Optical (UBgVRrIiz), NIR (YJHK) and X-ray (1 KeV) light curve of GRB 120327A afterglow. Bands are artificially shifted for clarity (see Table 2 for calibrated magnitudes). Solid lines represent the best fit for the optical/NIR bands, assuming a variable optical spectral indexβand fixed optical extinction. Vertical dashed lines show the Tmidof the four SEDs described in the main text.
– Variable optical extinction as AV=AV0+k×t0.5, with AV0= 0.04±0.02,k=6.02±0.25 andtthe time in seconds from the burst onset4; the optical spectral index is constantβ = 0.55+0.05
−0.04(orange area).
– Variable optical spectral index asβ = β0+ktα, withβ0 = 0.76±0.05,k = −5.2e5,α =−2.34+0.23
−0.26, andtthe time in seconds from the burst onset; the optical extinction is con-stant AV=0.05±0.02 (green area).
The data obtained performing the four SEDs (Fig. 3) are in accordance with the second (empirical) model, that is a variable optical spectral index and a constant optical extinction (χ2
red = 1.18 for 333 d.o.f.). As said before, the X-ray light curve shows the plateau phase between 200 and∼3000 s. In this epoch the photon indexΓXrises from∼1.2 at∼300 s up to∼2.0 at∼700 s and then seems to decrease until it sets at the value of∼1.6±
0.1 (Fig. 4. bottom panel). This is similar to the variation of the optical spectral index, as reported in Table 1 and fitted in Fig. 4 (mid panel), strengthening the validity of our fit with a broken power-law function.
4This function is an upgrade of the optical flux attenuation function described by Rykoffet al. (2004), assuming the bulk Lorentz factorΓof the emitting shell free to vary.
Table 1.Fit parameters of the optical spectral energy distribution at
different epochs.(a)Without U filter.
Tmin(s) Tmax(s) Tmid(s) AV β
700(a) 1200 950 0.06+0.03
−0.03 0.73+
0.11
−0.10 1200 4000 2600 0.05±0.03 0.72+−00..1109
4000 8000 6000 ≤0.05 0.81+0.08
−0.02
8000 18000 13000 0.06+0.04
−0.03 0.73+
0.11
−0.10
4. Discussion
4.1. Early time colour variation
In the context of the standard fireball model (Sari et al. 1998; Chevalier & Li 2000) the GRB afterglow is related to the syn-chrotron emission from a decelerating relativistic shell that slows into an external medium. The observed colour variation in the optical light curve at early time (Fig. 1 and Fig. 2) could arise from different scenarios:
Fig. 2. Early timeU BV magnitudes normalised to the R-band light curve att ∼103 s (shaded region). The dashed line is the power-law decay index of the late time optical afterglow.
Fig. 3. The four spectral energy distributions estimated at Tmid.
De-reddened optical data and un-absorbed X-ray flux are shown. Dashed lines represent our fitting model.
simultaneously with the decay index change∆α = 1/4 in the light curve (Sari et al. 1998). However, the observed change in the spectral index is smaller ∆β ∼ 0.2 (i.e. the
difference inβbetween the 1st epoch and the later epochs), and no temporal breaks seem to be associated with this spectral change. Moreover, our spectral energy distributions analysis seems to indicate thatνopt < νc < νXat the time of each SED (Fig. 3). Therefore the passage of a break frequency can not explain the observations well, and the scenario can be discarded;
(b) the colour change could be simply caused by a variation of the spectral index β. Following Morgan et al. (2014), we fit the SEDs letting β free to vary and fixing the dust parameters to the values obtained at late times. Therefore, the colour change can be modelled like a variation in the
Fig. 4.Evolution with time of the spectral parameters. Variation of the
optical extinction AV(top) and of the optical spectral indexβ(center).
Blue starsrepresent the values obtained by four SEDs as reported in Ta-ble 1.Green arearefers to the model with AVfixed, whileorange area
to the model withβfixed.Red squares(bottom) represent the variation of the X-ray photon indexΓ, that at late times it settles around the value
∼1.6±0.1 (gray area).
intrinsic spectral indexβ, asFν2 =Fν1(ν2/ν1)
∆β12 (Perley et al. 2010). Indeed, as can be seen in Fig. 4 (middle panel), this possibility could explain the observed data. From our fit, the largest variation of the spectral index is expected at the very early times (green area), where it goes from β∼ −1.4 at the time of our first UV detection (∼3×10²s) up to β ∼ −0.7 at t∼ 103 s (when in fact the observed temporal behaviour becomes achromatic);
(c) another possible source of the colour variation could be a change of the optical extinction because of the dust destruc-tionby the jet within 10 - 30 pc (Draine & Salpeter 1979; Waxman & Draine 2000; Fruchter et al. 2001; Perna & Laz-zati 2002; Draine & Hao 2002). This is supported by the fact that long GRBs have massive star progenitors and explode in dusty environments (Morgan et al. 2014). In this case, both the extinction AV and the reddening RV are expected
to change (e.g. Perna et al. 2003). Therefore, we fitted the optical/X-ray SEDs lettingAV andβfree to change, since
5. Summary and conclusions
We analysed the temporal and spectral properties of GRB 120327A. The multi-band fit has highlighted the presence of a colour variation from early to late time that cannot be easily explained with the passage of a break frequency through the op-tical/NIR bands, either with the assumption of an homogenous or wind-like surrounding medium. However, in the fast-cooling case with a wind-like medium, small changes of the spectral index could be the result of the theoretical curvature of the spectrum (Granot & Sari 2006).
No evidence for a change in the absorptionAV (we find an
averageAV =0.05±0.02 for the dust content of the host galaxy),
that could explain the observed colour variation, is clearly seen in our data. Although we cannot exclude completely the dust photo-destruction scenario, the variation of the spectral indexβ seems to be the favoured explanation, reproducing the observed data quite well. Such a variation could be the result of small changes of the microphysical parameters (p,e, and B) from early to late times. In particular, a small variation of electron spectral index (of the order of∼ 0.4 dex) would reproduce the
observed∆β.
Acknowledgements. AM, SCo, SCa, BS, PDA, and GT acknowledge support from the ASI grant I/004/11/3. EZ acknowledges the support by the Interna-tional Cooperation Program CAPES-ICRANet financed by CAPES - Brazil-ian Federal Agency for Support and Evaluation of Graduate Education within the Ministry of Education of Brazil. DM acknowledges support from the In-strument center for Danish Astrophysics (IDA). CGM acknowledges support from the Royal Society, the Wolfson Foundation and the Science and Technol-ogy Facilities Council. LH acknowledges support from SFI (07-RFP-PHYF295, 11/RFP.1/AST/3188) & the EU-FP7/GLORIA (grant no. 283783). MI and JWK acknowledge the support from the National Research Foundation of Korea grant no. 2017R1A3A3001362 and no. 2016R1D1A1B03934815. This work has been supported by ASI grant I/004/11/0 and by PRIN-MIUR 2009 grants. This re-search was made possible through the use of the AAVSO Photometric All-Sky Survey (APASS), funded by the Robert Martin Ayers Sciences Fund. Partly based on observations made with the Nordic Optical Telescope (program 46-003, PI Jakobsson), operated by the Nordic Optical Telescope Scientific Associ-ation at the Observatorio del Roque de los Muchachos, La Palma, Spain, of the Instituto de Astrofísica de Canarias.
References
Chevalier R. A. & Li, Z.-Y., 1999, ApJ, 520, L29-L32 Chevalier R. A. & Li, Z.-Y., 2000, ApJ, 536, 195-212 Cobb, B. E., 2012, GCN 13188, 1
Covino, S., et al., 2004, SPIE, 5492, 1613
Covino, S., Melandri, A., Salvaterra, R., et al., 2013, MNRAS, 432, 1231 Covino, S., et al., 2012, GCN 13128, 1
D’Elia, V., Fynbo, J. P. U., Goldoni, P., et al., 2014, A&A, 564, 38 Draine, B. T. & Hao, L., 2002, ApJ, 569, 780
Draine, B. T., & Salpeter, E. E., 1979, ApJ, 231, 438 Filgas, R., et al., 2011, A&A, 535, 57
Fruchter, A., Krolik, J. H. & Rhoads, J. E., 2001, ApJ, 563, 597 Gehrels, N., Chincarini, G., Giommi, P., et al., 2004, ApJ, 611 1005 Gorosabel, J., Castro-Tirado, A. J., Walker, C., et al., 2012, GCN 13130, 1 Granot, J. & Sari, R., 2002, ApJ, 568, 820
Greiner, J.; Bornemann, W.; Clemens, C., et al., 2008, PASP, 120, 405 Hancock, P., Murphy, T., Gaensler, B., Bell, M., Burlon, D. & de Ugarte Postigo,
A., 2012, GCN 13180, 1
Hodgkin, S. T., Irwin, M. J., Hewett, P. C. & Warren, S. J., 2009, MNRAS, 394, 675
Im, M., Kim, J.-W. & Kim, D., 2012, GCN 13140, 1
Japelj, J., Gomboc, A. & Kopac, D., 2012, proc. of Gamma-Ray Bursts 2012 Conference, PoS 078
Kobayashi, S. & Zhang, B., 2003, ApJ, 597, 455 Krimm, H. A., et al., 2012, GCN 13137, 1 Krühler, T., et al., 2012, GCN 13134, 1 Kuin, P., et al., 2012, GCN 13138
Kuroda, D., Hanayama, H., Miyaji, T., et al., 2012b, GCN 13169, 1
Kuroda, D., Hanayama, H., Miyaji, T., et al., 2012a, GCN 13156, 1 LaCluyze, A., et al., 2012, GCN 13127, 1
Liang, E.-W., Li, L., Gao, H., et al., 2013, ApJ, 774, 13
Meehan, S., Hanlon, L., Topinka, M. & Kubanek, P., 2012, GCN 13144, 1 Melandri, A., et al., 2008, ApJ, 686, 1209
Molinari, E., et al., 2007, A&A, 469, 13 Morgan, A. N., et al., 2014, MNRAS, 440, 1810 Morrison, R. & McCammon, D., 1983, ApJ, 270, 119 Nysewander, M. C., et al., 2006, ApJ, 651, 994 Park, W.-K., Pak, S., Im, M., et al., 2012, PASP, 124, 839 Perley, D. A. & Tanvir, N. R., 2012, GCN 13133, 1
Perley, D. A., Bloom, J. S., Klein, C. R., et al., 2010, MNRAS, 406, 2473 Perna, R., Lazzati, D. & Fiore, F., 2003, ApJ, 585, 775
Perna, R., & Lazzati, D., 2002, ApJ, 580, 261 Rykoff, E. S., et al., 2004, ApJ, 601, 1013 Pei, Y. C., 1992, ApJ, 395, 130
Piran, T., 2004, RvMP, 76, 1143
Sari, R., Piran, T. & Narayan, R., 1998, ApJ, 497, L17 Sbarufatti, B., et al., 2012, GCN 13123, 1
Schlafly, E. F. & Finkbeiner, D. P., 2011, ApJ, 737, 103 Smith, R. J. & Virgili, F., 2012, GCN 13125, 1
Steele, I. A., Smith, R. J., Rees, P. C., et al., 2004, SPIE, 5489, 679 Steele, I. A., Kopaˇc, D., Arnold, D. M., et al., 2017, ApJ, 843, 143 Sudilovsky, V., et al., 2012, GCN 13129, 1
Vestrand, W. T., et al., 2006, Nature, 442, 172 Waxman, E. & Draine, B. T., 2000, ApJ, 537, 796
Willingale, R., Starling, R. L. C., Beardmore, A. P., Tanvir, N. R. & O’Brien, P. T., 2013, MNRAS, 431, 394
Zaninoni, E., Bernardini, M. G., Margutti, R., Oates, S. & Chincarini, G., 2013, A&A, 557, A12
Table 2.Photometric data used in this paper. Magnitudes are in the Vega system unless forgrizfilters that are in the AB system, and they are all not corrected for Galactic absorption. Errors are at 1σlevel.
t-t0(s) Exp. (s) Mag Band Telescope t-t0(s) Exp. (s) Mag Band Telescope
30224 360 19.10±0.02 z CQUEAN 266 125 17.91±0.09 u UVOT
3126 177 16.76±0.03 z GROND 606 39 17.59±0.20 u UVOT
3728 348 16.98±0.03 z GROND 921 102 18.06±0.18 u UVOT
4508 347 17.27±0.03 z GROND 1162 10 17.78±0.33 u UVOT
5811 871 17.61±0.03 z GROND 1308 9 18.08±0.46 u UVOT
7651 871 17.92±0.03 z GROND 6166 48 20.01±0.44 u UVOT
9479 866 18.20±0.03 z GROND 406 10 16.99±0.11 b UVOT
11305 873 18.35±0.03 z GROND 557 10 17.05±0.12 b UVOT
13134 867 18.49±0.03 z GROND 706 10 17.14±0.13 b UVOT
14959 866 18.61±0.03 z GROND 855 10 17.54±0.18 b UVOT
30376 360 18.95±0.05 Y CQUEAN 1038 10 17.55±0.19 b UVOT
1366 20 14.34±0.04 J REM 1186 10 17.85±0.32 b UVOT
2112 246 14.83±0.06 J REM 6268 48 20.26±0.39 b UVOT
2859 150 15.41±0.09 J REM 458 10 15.65±0.08 v UVOT
3982 300 15.77±0.09 J REM 608 10 15.91±0.12 v UVOT
5470 300 16.39±0.15 J REM 756 10 16.00±0.13 v UVOT
8341 300 16.43±0.13 J REM 1088 10 16.38±0.16 v UVOT
6452 720 16.31±0.07 J SMARTS 1236 10 16.46±0.19 v UVOT
14628 720 17.27±0.08 J SMARTS 6762 48 19.10±0.40 v UVOT
106377 1800 19.56±0.14 J SMARTS 2177 10 17.53±0.08 V PROMPT1
3149 200 16.26±0.05 J GROND 2263 10 17.56±0.09 V PROMPT1
3756 376 16.57±0.05 J GROND 2349 10 17.55±0.08 V PROMPT1
4535 374 16.82±0.05 J GROND 2435 10 17.81±0.11 V PROMPT1
5844 895 17.14±0.05 J GROND 2659 10 17.76±0.08 V PROMPT1
7674 895 17.42±0.05 J GROND 3003 10 17.85±0.08 V PROMPT1
9503 890 17.75±0.05 J GROND 3090 10 17.84±0.07 V PROMPT1
11329 896 17.83±0.05 J GROND 3158 10 17.85±0.12 V PROMPT1
13158 891 17.95±0.05 J GROND 3256 10 18.05±0.08 V PROMPT1
14982 890 18.11±0.05 J GROND 3344 10 17.80±0.07 V PROMPT1
6480 360 16.31±0.07 J CTIO 3432 10 17.93±0.08 V PROMPT1
14760 360 17.27±0.08 J CTIO 3519 10 18.01±0.08 V PROMPT1
608 50 12.32±0.04 H REM 3607 10 18.00±0.08 V PROMPT1
693 50 12.38±0.04 H REM 3694 10 18.12±0.08 V PROMPT1
775 50 12.59±0.05 H REM 3782 10 18.15±0.09 V PROMPT1
859 50 12.59±0.05 H REM 3898 10 18.22±0.09 V PROMPT1
992 150 12.93±0.06 H REM 3989 10 18.20±0.09 V PROMPT1
1739 150 13.68±0.06 H REM 4076 10 18.31±0.10 V PROMPT1
2485 150 14.33±0.09 H REM 4164 10 18.35±0.10 V PROMPT1
3309 300 14.52±0.09 H REM 4251 10 18.45±0.12 V PROMPT1
4755 300 15.22±0.15 H REM 5348 10 18.65±0.04 V PROMPT1
3149 200 15.91±0.05 H GROND 6086 10 18.73±0.06 V PROMPT1
3756 376 16.24±0.05 H GROND 7078 10 18.94±0.04 V PROMPT1
4535 374 16.52±0.05 H GROND 8413 10 19.21±0.05 V PROMPT1
5844 895 16.87±0.05 H GROND 9727 10 19.42±0.05 V PROMPT1
7674 895 17.17±0.05 H GROND 11056 10 19.47±0.06 V PROMPT1
9503 890 17.46±0.05 H GROND 12387 10 19.66±0.07 V PROMPT1
11329 896 17.63±0.05 H GROND 14326 10 19.94±0.07 V PROMPT1
13158 891 17.74±0.05 H GROND 16927 10 20.24±0.10 V PROMPT1
14982 890 17.77±0.05 H GROND 19515 10 20.02±0.08 V PROMPT1
1179 150 12.30±0.06 K REM 22302 10 20.02±0.07 V PROMPT1
1925 150 13.12±0.10 K REM 24398 10 19.86±0.06 V PROMPT1
6452 720 14.78±0.09 K SMARTS 6480 450 18.82±0.03 V CTIO
14627 720 15.68±0.09 K SMARTS 14760 450 19.87±0.03 V CTIO
3149 200 15.61±0.06 K GROND 5676 225 18.66±0.04 V SMARTS
3756 376 15.87±0.06 K GROND 6255 225 18.78±0.04 V SMARTS
4535 374 16.18±0.06 K GROND 6540 225 18.86±0.04 V SMARTS
5843 895 16.48±0.06 K GROND 7110 225 18.94±0.04 V SMARTS
7674 895 16.92±0.06 K GROND 13854 225 19.73±0.04 V SMARTS
9503 890 17.12±0.06 K GROND 14427 225 19.84±0.04 V SMARTS
11329 896 17.21±0.06 K GROND 14712 225 19.79±0.04 V SMARTS
13158 891 17.35±0.06 K GROND 15282 225 19.75±0.04 V SMARTS
14982 890 17.41±0.07 K GROND 1993 80 18.72±0.16 B PROMPT3
6480 360 14.78±0.09 K CTIO 2351 80 18.98±0.16 B PROMPT3
14760 360 15.68±0.09 K CTIO 2625 80 18.80±0.12 B PROMPT3
Table 2.Continued.
t-t0(s) Exp. (s) Mag Band Telescope t-t0(s) Exp. (s) Mag Band Telescope
3740 80 19.54±0.12 B PROMPT3 3522 10 17.37±0.05 Rc PROMPT4
5283 80 19.90±0.18 B PROMPT3 3611 10 17.53±0.06 Rc PROMPT4
6045 80 20.09±0.23 B PROMPT3 3700 10 17.46±0.06 Rc PROMPT4
7054 80 20.24±0.13 B PROMPT3 3788 10 17.46±0.06 Rc PROMPT4
8383 80 20.36±0.13 B PROMPT3 3898 10 17.54±0.07 Rc PROMPT4
9725 80 20.63±0.15 B PROMPT3 3986 10 17.54±0.06 Rc PROMPT4
11060 80 20.87±0.18 B PROMPT3 4075 10 17.68±0.07 Rc PROMPT4
12385 80 21.06±0.26 B PROMPT3 4163 10 17.62±0.06 Rc PROMPT4
14322 80 20.99±0.17 B PROMPT3 4252 10 17.69±0.06 Rc PROMPT4
16926 80 21.31±0.22 B PROMPT3 5352 10 17.97±0.03 Rc PROMPT4
19510 80 21.58±0.26 B PROMPT3 6090 10 18.09±0.04 Rc PROMPT4
22189 80 21.51±0.27 B PROMPT3 7087 10 18.28±0.03 Rc PROMPT4
24351 80 21.24±0.25 B PROMPT3 8374 10 18.53±0.03 Rc PROMPT4
2873 30 18.49±0.10 g Liverpool T. 9735 10 18.71±0.03 Rc PROMPT4
3080 30 18.44±0.09 g Liverpool T. 11065 10 18.85±0.04 Rc PROMPT4 3289 60 18.52±0.06 g Liverpool T. 12394 10 18.97±0.05 Rc PROMPT4 3598 60 18.79±0.07 g Liverpool T. 14347 10 19.08±0.04 Rc PROMPT4 3916 60 18.90±0.08 g Liverpool T. 16951 10 19.26±0.04 Rc PROMPT4 4228 60 19.03±0.08 g Liverpool T. 19531 10 19.28±0.04 Rc PROMPT4 4588 60 19.12±0.08 g Liverpool T. 22304 10 19.26±0.04 Rc PROMPT4 4972 60 19.25±0.05 g Liverpool T. 24366 10 19.36±0.06 Rc PROMPT4 5212 120 19.30±0.05 g Liverpool T. 100804 10 21.83±0.20 Rc PROMPT4
5865 180 19.39±0.03 g Liverpool T. 822 2 15.50±0.06 Rc Watcher
6733 120 19.54±0.07 g Liverpool T. 950 2 15.68±0.05 Rc Watcher
7545 180 19.70±0.04 g Liverpool T. 1142 2 15.91±0.05 Rc Watcher 8440 120 19.84±0.05 g Liverpool T. 1311 2 16.05±0.11 Rc Watcher
31531 540 20.89±0.07 g CQUEAN 1375 2 16.02±0.09 Rc Watcher
3126 177 18.55±0.03 g GROND 1439 2 16.04±0.11 Rc Watcher
3728 348 18.78±0.03 g GROND 1556 2 16.42±0.09 Rc Watcher
4508 347 19.06±0.03 g GROND 1684 2 16.34±0.09 Rc Watcher
5820 871 19.38±0.03 g GROND 2006 2 16.40±0.12 Rc Watcher
7651 871 19.69±0.03 g GROND 2070 2 16.38±0.12 Rc Watcher
9479 866 19.99±0.03 g GROND 2198 2 16.69±0.19 Rc Watcher
11305 873 20.17±0.03 g GROND 2262 2 16.84±0.24 Rc Watcher
13134 867 20.34±0.03 g GROND 2368 30 17.15±0.06 Rc Liverpool T.
14959 866 20.48±0.03 g GROND 2465 30 17.26±0.06 Rc Liverpool T.
732 10 15.35±0.01 Rc PROMPT4 3010 30 17.49±0.05 Rc Liverpool T.
821 10 15.47±0.01 Rc PROMPT4 3218 30 17.54±0.05 Rc Liverpool T.
912 10 15.53±0.02 Rc PROMPT4 3494 60 17.70±0.03 Rc Liverpool T.
1000 10 15.66±0.02 Rc PROMPT4 3806 60 17.79±0.03 Rc Liverpool T.
1091 10 15.82±0.02 Rc PROMPT4 4124 60 17.91±0.03 Rc Liverpool T.
1180 10 15.90±0.02 Rc PROMPT4 4454 60 18.06±0.04 Rc Liverpool T.
1271 10 15.96±0.02 Rc PROMPT4 4862 60 18.17±0.03 Rc Liverpool T.
1360 10 16.06±0.02 Rc PROMPT4 5623 120 18.31±0.02 Rc Liverpool T. 1451 10 16.17±0.03 Rc PROMPT4 6392 180 18.49±0.02 Rc Liverpool T. 1540 10 16.22±0.03 Rc PROMPT4 7296 120 18.67±0.03 Rc Liverpool T. 1632 10 16.33±0.03 Rc PROMPT4 8164 180 18.79±0.02 Rc Liverpool T. 1722 10 16.36±0.03 Rc PROMPT4 9616 300 19.01±0.02 Rc Liverpool T. 1814 10 16.58±0.04 Rc PROMPT4 9927 300 19.06±0.02 Rc Liverpool T.
1901 10 16.56±0.03 Rc PROMPT4 1664 90 16.67±0.05 Rc Liverpool T.
1990 10 16.61±0.03 Rc PROMPT4 7650 25 18.66±0.05 Rc REM
2079 10 16.69±0.03 Rc PROMPT4 107780 50 22.20±0.10 Rc REM
2177 10 16.79±0.04 Rc PROMPT4 90720 1800 22.11±0.15 Rc NOT
2265 10 16.86±0.04 Rc PROMPT4 201180 1800 23.06±0.25 Rc NOT
2352 10 16.87±0.04 Rc PROMPT4 3438 654 17.50±0.12 Rc Boote
2441 10 16.84±0.04 Rc PROMPT4 4104 674 17.65±0.12 Rc Boote
2537 10 16.86±0.04 Rc PROMPT4 4812 748 17.82±0.13 Rc Boote
2626 10 16.92±0.04 Rc PROMPT4 5520 660 18.24±0.21 Rc Boote
2714 10 17.09±0.05 Rc PROMPT4 6186 673 18.17±0.21 Rc Boote
2803 10 17.09±0.05 Rc PROMPT4 6858 656 18.59±0.29 Rc Boote
2898 10 17.14±0.05 Rc PROMPT4 60769 240 20.34±0.15 Rc MITSuME
2989 10 17.30±0.06 Rc PROMPT4 29859 540 20.00±0.02 r CQUEAN
3078 10 17.30±0.05 Rc PROMPT4 3126 177 17.56±0.03 r GROND
3167 10 17.34±0.06 Rc PROMPT4 3728 348 17.56±0.03 r GROND
3256 10 17.40±0.06 Rc PROMPT4 4508 347 18.06±0.03 r GROND
3345 10 17.34±0.05 Rc PROMPT4 5820 871 18.39±0.03 r GROND
Table 2.Continued.
t-t0(s) Exp. (s) Mag Band Telescope t-t0(s) Exp. (s) Mag Band Telescope
9479 866 18.99±0.03 r GROND 5561 3600 17.35±0.03 Ic IAC80
11305 873 19.19±0.03 r GROND 5945 3600 17.49±0.03 Ic IAC80
13134 867 19.32±0.03 r GROND 6319 3600 17.57±0.04 Ic IAC80
14959 866 19.45±0.03 r GROND 6700 3600 17.62±0.05 Ic IAC80
724 10 14.64±0.01 Ic PROMPT5 7073 3600 17.77±0.04 Ic IAC80
821 10 14.84±0.02 Ic PROMPT5 7456 3600 17.71±0.04 Ic IAC80
911 10 14.88±0.02 Ic PROMPT5 7829 3600 17.84±0.04 Ic IAC80
1000 10 15.05±0.02 Ic PROMPT5 8201 3600 17.90±0.04 Ic IAC80
1091 10 15.15±0.02 Ic PROMPT5 8569 3600 17.96±0.06 Ic IAC80
1181 10 15.27±0.02 Ic PROMPT5 8942 3600 18.12±0.08 Ic IAC80
1271 10 15.35±0.02 Ic PROMPT5 9324 3600 17.94±0.13 Ic IAC80
1361 10 15.40±0.03 Ic PROMPT5 2941 30 16.98±0.04 Ic Liverpool T.
1451 10 15.47±0.03 Ic PROMPT5 3148 30 17.04±0.04 Ic Liverpool T.
1541 10 15.51±0.03 Ic PROMPT5 3389 60 17.15±0.03 Ic Liverpool T.
1632 10 15.65±0.03 Ic PROMPT5 3698 60 17.31±0.03 Ic Liverpool T.
1723 10 15.74±0.04 Ic PROMPT5 4018 60 17.39±0.03 Ic Liverpool T.
1814 10 15.96±0.04 Ic PROMPT5 4328 60 17.54±0.04 Ic Liverpool T.
1903 10 15.95±0.04 Ic PROMPT5 4690 60 17.65±0.03 Ic Liverpool T.
1993 10 15.94±0.04 Ic PROMPT5 5077 60 17.85±0.05 Ic Liverpool T.
2082 10 16.02±0.04 Ic PROMPT5 5374 120 17.88±0.03 Ic Liverpool T. 2177 10 16.13±0.04 Ic PROMPT5 6105 180 18.03±0.03 Ic Liverpool T. 2266 10 16.27±0.05 Ic PROMPT5 6898 120 18.11±0.03 Ic Liverpool T. 2355 10 16.32±0.05 Ic PROMPT5 7779 180 18.14±0.03 Ic Liverpool T. 2444 10 16.22±0.05 Ic PROMPT5 8614 120 18.26±0.03 Ic Liverpool T. 2537 10 16.28±0.04 Ic PROMPT5 8942 300 18.34±0.02 Ic Liverpool T. 2626 10 16.33±0.05 Ic PROMPT5 9254 300 18.41±0.02 Ic Liverpool T. 2718 10 16.46±0.05 Ic PROMPT5 38229 900 20.01±0.12 Ic Liverpool T.
2807 10 16.39±0.05 Ic PROMPT5 5451 225 17.43±0.04 Ic SMARTS
2898 10 16.55±0.06 Ic PROMPT5 6030 225 17.55±0.04 Ic SMARTS
2987 10 16.48±0.05 Ic PROMPT5 6881 225 17.71±0.04 Ic SMARTS
3077 10 16.63±0.05 Ic PROMPT5 7452 225 17.75±0.04 Ic SMARTS
3166 10 16.73±0.07 Ic PROMPT5 13631 225 18.43±0.04 Ic SMARTS
3256 10 16.69±0.06 Ic PROMPT5 14203 225 18.54±0.04 Ic SMARTS
3346 10 16.68±0.06 Ic PROMPT5 15054 225 18.51±0.04 Ic SMARTS
3435 10 16.75±0.07 Ic PROMPT5 15624 225 18.56±0.04 Ic SMARTS
3524 10 16.70±0.07 Ic PROMPT5 99214 2160 20.92±0.05 Ic SMARTS
3614 10 16.80±0.07 Ic PROMPT5 106376 2160 21.07±0.06 Ic SMARTS
3704 10 16.74±0.06 Ic PROMPT5 193116 2160 21.45±0.07 Ic SMARTS
3793 10 16.88±0.08 Ic PROMPT5 6480 450 17.63±0.04 Ic CTIO
3898 10 16.84±0.06 Ic PROMPT5 14760 450 18.47±0.04 Ic CTIO
3988 10 16.90±0.07 Ic PROMPT5 60769 2640 19.84±0.34 Ic MITSuME
4078 10 17.01±0.08 Ic PROMPT5 30079 360 19.55±0.01 i CQUEAN
4167 10 16.95±0.07 Ic PROMPT5 3126 177 17.07±0.03 i GROND
4259 10 17.11±0.08 Ic PROMPT5 3728 348 17.30±0.03 i GROND
5354 10 17.39±0.04 Ic PROMPT5 4508 347 17.59±0.03 i GROND
6093 10 17.61±0.05 Ic PROMPT5 5820 871 17.92±0.03 i GROND
7049 10 17.67±0.04 Ic PROMPT5 7651 871 18.23±0.03 i GROND
8378 10 17.89±0.04 Ic PROMPT5 9479 866 18.52±0.03 i GROND
9698 10 18.07±0.04 Ic PROMPT5 11305 873 18.67±0.03 i GROND
11029 10 18.17±0.05 Ic PROMPT5 13134 867 18.83±0.03 i GROND
12372 10 18.28±0.05 Ic PROMPT5 14959 866 18.96±0.03 i GROND
14394 10 18.40±0.04 Ic PROMPT5 807 2 15.53±0.09 C Watcher
16927 10 18.58±0.04 Ic PROMPT5 810 2 15.34±0.09 C Watcher
19540 10 18.54±0.04 Ic PROMPT5 814 2 15.48±0.08 C Watcher
22342 10 18.61±0.04 Ic PROMPT5 1091 30 15.93±0.58 C Watcher
24369 10 18.68±0.05 Ic PROMPT5 1387 30 15.94±0.36 C Watcher
100848 10 20.33±0.12 Ic PROMPT5 1568 30 16.45±0.64 C Watcher
4425 3600 17.12±0.03 Ic IAC80
4809 3600 17.21±0.03 Ic IAC80