POLARIZATION AND PARTISAN BIAS
Serge Severenchuk
A dissertation submitted to the faculty of the University of North Carolina at Chapel Hill in partial fulfillment of the requirements for the degree of Doctor of Philosophy in
the Department of Political Science in the College of Arts and Sciences.
Chapel Hill 2019
ABSTRACT
Serge Severenchuk: Polarization and Partisan Bias (Under the direction of Timothy J. Ryan)
Polarization, which has been growing over the last few decades, refers to the divergence between Democrats and Republicans. Polarization has been found to have a number of negative consequences: it contributes to legislative gridlock, decreases trust in government and institutions, and increases income inequality. Polarized partisan politics also contribute to election of ideologically extreme candidates to office, which gives rise to a concern that these candidates will not adequately represent a large segment of the population. Examination of polarization is worthwhile because it may prove useful in mitigating these negative effects. This dissertation primarily deals with psychological bases of polarization and partisan bias. First, I examine whether people with certain psychological traits approach partisanship in a more emotional, biased manner. Second, I examine whether the effects of partisanship vary by the context (namely political vs. nonpolitical). Finally, I have a
methodological study on conjoint experimental design in political science. It examines how different types of conjoint design affect subjects’ preferences.
score high on the NFA scale. Moreover, there is no evidence that those who score high on the NFA scale exhibit in-group partisan bias. This finding is particularly significant for it shows that contrary to social identity theory, in-group bias is not an automatic consequence of identification with a group.
In the second chapter I examine whether the influence of partisan bias on people’s evaluations varies by setting. Partisanship has long been known to be an influential force in shaping people’s evaluations of political actors. More recent research has demonstrated that the influence of partisanship extends to people’s decisions and evaluations in non-political settings. However, it remains unknown how the influence of partisanship on people’s behavioral judgments compares between the political and non-political settings. In this chapter I experimentally manipulate the setting in which respondents evaluate candidates for jobs, scholarships, internships and awards. I find that respondents’ tendency to exhibit partisan bias (both in-group and out-group) is the same in both settings. I interpret these findings through the lens of conflict extension theory. Namely, conflict between Democrats and Republicans has spread from few policy issues to many, and eventually into non-political settings. As this conflict spread, it did not abate in intensity. The current partisan polarization among rank-and-file members is similar in intensity in the political and non-political setting.
ACKNOWLEDGMENTS
Most things in life require some teamwork. Completing a Ph.D. degree and writing a dissertation is no different. I owe a great deal of gratitude to those who have supported me throughout this long journey, as well as those who have helped me to prepare for it.
First and foremost, I want to thank my Lord and Savior Jesus Christ. He has given me health, and blessed me with great family, friends, and mentors. Without Him none of this would be possible. He is the ultimate source of all good things. My well-grounded faith played an instrumental part in helping me to persevere through this long journey of completing a Ph.D. degree.
Next, I want to thank my family, and my parents in particular. They have made a lot of sacrifices for me to be where I am at. They were also very supportive and understanding of the time commitment and focus that my studies required. My dad, Sergey, is a well of
wisdom. He is my original intellectual inspiration. Throughout my intellectual development he would always encourage me and at the same time show me that there was more room for growth. My mom, Olga, is the best embodiment of unconditional love I have ever seen. Her love and support have proved to be invaluable during my graduate studies. Words can not describe how much I have learned (and continue to learn) from both of my parents. At the writing of these acknowledgments I am the third out of six of their children to attain a doctoral level degree (my other three siblings are also successful in what they do). I believe this serves as a testament to what good quality parenting can do.
To the rest of my immediate family: Mariya, Vlad, Olga, Alex, Irina, John, Daniil, and Lilli, thank you for putting up with me, and cheering me on throughout this whole time.
Next, I would like to thank my advisors at UNC: Thomas M. Carsey and Timothy J. Ryan. These two individuals have had a disproportionate amount of influence on my
inspired me, encouraged me, and offered much needed criticism.
Tom was a great mentor to many. He was tremendously generous with his time. He held weekly meetings with me where we either talked about the work I accomplished in the last week, or about research he was working on at the time. I learned a lot from those
meetings, and when I think back to my time in the program, these meetings were some of my favorite. After my second year in the program Tom was diagnosed with ALS. Despite his terminal diagnosis and deteriorating health, he was very involved until he passed away on February 21, 2018. Later by chatting with his wife Dawn, I found out that even on the day when he passed away, Tom was putting together a list of things that needed to be done for his students. If this does not serve as a testament to how much Tom invested in his students, I do not know what does. These days, I keep hearing from others how Tom rubbed off on me in terms of my thinking and writing style.
My other advisor, Tim, was very encouraging from the time I took his first class at UNC. Form the start he believed in my potential, pushed me to do my best work, encouraged me to make constant progress, and cheered me on. From my early days at UNC until the completion of this dissertation Tim has had a tremendous influence on all my work. Once Tom’s health began to seriously deteriorate, Tim would read drafts, offer advice, and do what needed to be done to make sure that I kept making timely progress in the program. After Tom’s passing, Tim took over as the main advisor and helped me through the transition. There is no way I would be where I am at without these two mentors. I could not ask for better advisors!
I also would like to thank the rest of my dissertation committee: Frank R.
Baumgartner, Kevin K. Banda, Cristopher J. Clark, and Marc J. Hetherington. I have learned valuable lessons that improved my skills as a scholar from each of them. They read countless drafts, offered invaluable advice, encouraged me when I was on the job market, and were always willing to help.
part of this group, these individuals have read countless drafts of my work and offered useful feedback. I am also thankful to graduate students who are part of Timothy Ryan’s Lab: Amanda Aziz, Andrew Tyner, J Ehlinger, Leah Christiani, Maura McDonald, and Tyler Steelman. This is a younger group at UNC, but over the last year its members have read a number of my drafts, and offered criticism that contributed to significant improvements in my work. Leah and Tyler were in both groups. Thank you both for reading twice as many of my drafts.
I would like to thank my friends who have helped, supported me, and encouraged me this whole time. I could not thank everyone by name (and for that I am sorry), but I would like to especially recognize Garrett Jacobs, Serge Korepin, Sidita Kushi, and Ray Wang for their contributions to the development of my work. Garrett and Serge would patiently listen to my long rants about whatever project I was working on, and then push me to synthesize my ideas in short and concise manner. This has proved invaluable in developing my ideas. Serge and Sidita were also always willing to read drafts when I needed them to. I took a ton of classes with Serge at UNC, and a lot of classes with Sidita at Northeastern (during our master’s studies). No matter what deadlines we had to meet or what exams we were studying for, both of them always managed to make graduate school more enjoyable. Although Ray and I are in different departments at UNC (he is in economics), we went through this whole PhD journey together. He was always willing to listen, help, and offer great advice. Thank you all for being great friends.
I would also like to thank everyone at Chapel Hill Gracie Jiu Jitsu academy. Brazilian Jiu Jitsu is one of my greatest passions in life. I have studied this martial art for about 13 years and it has added great value to my life. It has helped me to grow as a person, and develop skills that I get to use in other aspects of my life. For instance, staying calm under pressure, persevering through difficulties, and staying focused on the problem at hand. Members of Chapel Hill Jiu Jitsu have put up with a very busy and often stressed-out grad student for the past five years. I really enjoyed being part of this community.
TABLE OF CONTENTS
LIST OF TABLES . . . xii
LIST OF FIGURES . . . xiii
CHAPTER 1: WHO IS DRIVING POLARIZATION? . . . 1
Introduction . . . 1
Polarization . . . 3
Technological Changes and Prevalence of Emotional Appeals . . . 4
Social identity, Partisanship, and Partisan Bias . . . 4
NFA and Partisan Bias . . . 5
Study Design and Data . . . 7
Results . . . 9
Discussion and Conclusion . . . 15
CHAPTER 2: PARTISAN BIAS IN POLITICAL AND NON-POLITICAL SETTING 17 Introduction . . . 17
Partisanship and Bias . . . 19
Social Identity and Bias . . . 20
Hypotheses . . . 21
Study Design . . . 23
Results . . . 27
Discussion and Conclusion . . . 32
CHAPTER 3: CONJOINT EXPERIMENTAL DESIGN IN POLITICAL SCIENCE . 34 Introduction . . . 34
Study Design and Data . . . 40
Results . . . 43
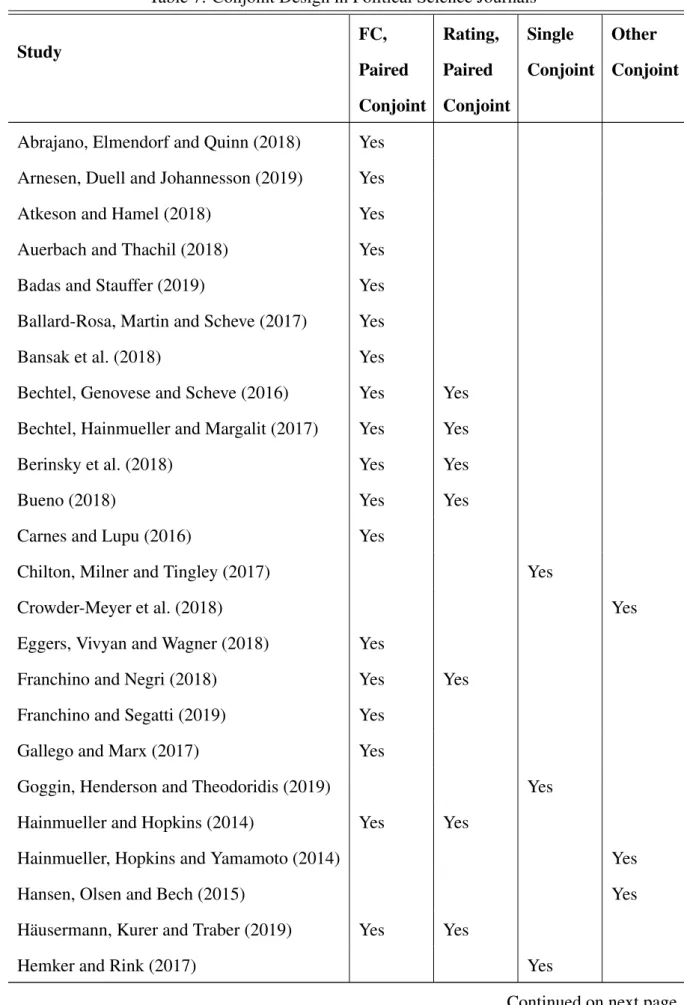
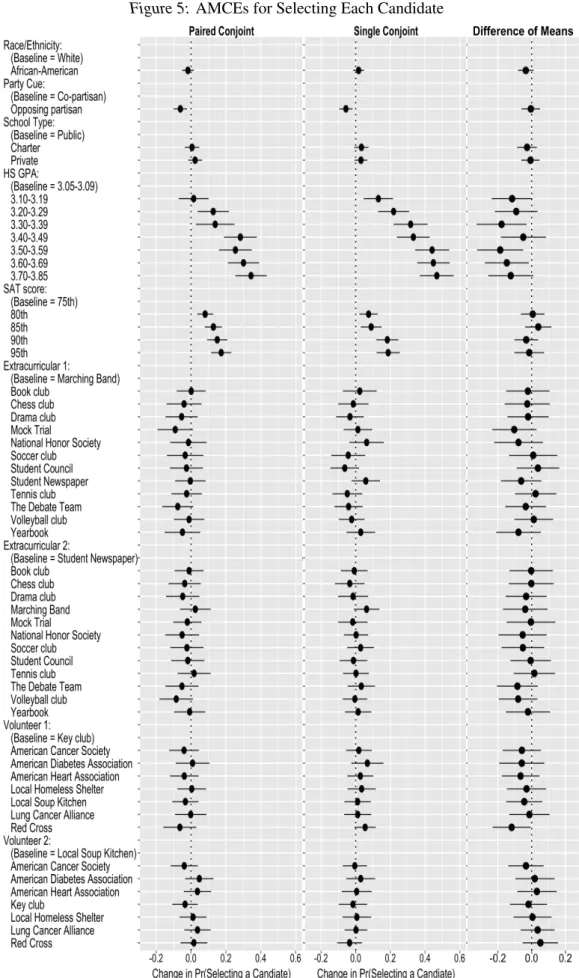
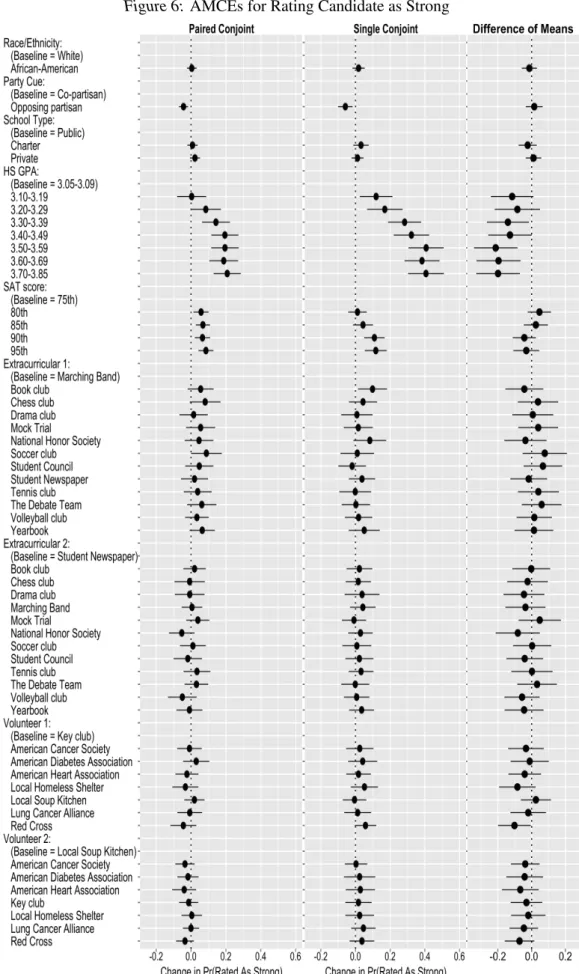
Paired Conjoint v. Single Conjoint . . . 43
Forced-choice v. Selection Question for Each Candidate . . . 48
Discussion and Conclusion . . . 51
APPENDIX A: SUPPORTING INFORMATION FOR CHAPTER 1 . . . 55
Additional Analyses . . . 55
NFA Instrument . . . 62
Candidate Prompts . . . 63
APPENDIX B: SUPPORTING INFORMATION FOR CHAPTER 2 . . . 68
Results for partisans only (independent leaners dropped) . . . 68
Candidate Prompts . . . 69
APPENDIX C: SUPPORTING INFORMATION FOR CHAPTER 3 . . . 76
Additional Analyses . . . 76
Socio-Demographic Characteristics of the Respondents . . . 80
LIST OF TABLES
Table
1 Randomly Selected Attributes in Candidate Profiles . . . 9
2 Socio-Demographic Characteristics of the Respondents . . . 10
3 Summary of Political and Non-political Cues in Candidate Profiles . . . 24
4 Demographic Characteristics of the Respondents . . . 28
5 Candidate Evaluations in Non-political and Political Setting . . . 29
6 Candidate Evaluations in Non-political and Political Setting . . . 30
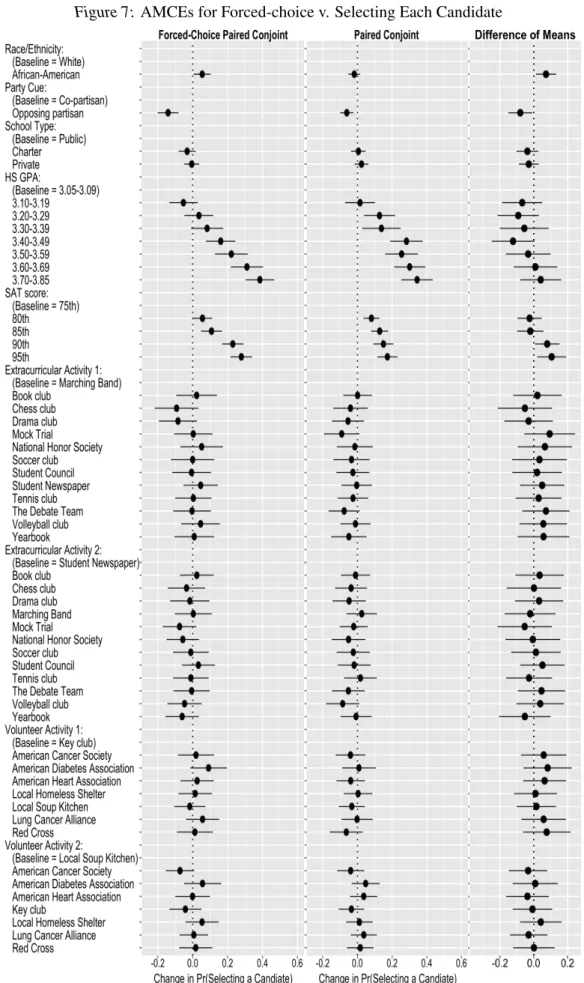
7 Conjoint Design in Political Science Journals . . . 37
8 Sample Candidate Profiles in Paired Conjoint Condition . . . 41
9 Attributes for Candidate Profiles . . . 42
10 Average Treatment Effects (ATEs) in Evaluative Questions Part 1 . . . 57
11 Average Treatment Effects (ATEs) in Evaluative Questions Part 2 . . . 57
12 In-group and Out-group Partisan Bias for Respondents Low on NFA Part 1 . . 58
13 In-group and Out-group Partisan Bias for Respondents Low on NFA Part 2 . . 58
14 In-group and Out-group Partisan Bias for Respondents Medium on NFA Part 1 59 15 In-group and Out-group Partisan Bias for Respondents Medium on NFA Part 2 59 16 In-group and Out-group Partisan Bias for Respondents High on NFA Part 1 . . 60
17 In-group and Out-group Partisan Bias for Respondents High on NFA Part 2 . . 60
18 Do Respondents in Low, Medium, and High NFA Group Show Statistically Significantly Different Magnitude of Bias from Each-other Part 1 . . . 61
19 Do Respondents in Low, Medium, and High NFA Group Show Statistically Significantly Different Magnitude of Bias from Each-other Part 2 . . . 62
LIST OF FIGURES
Figure
1 Sample Profile for a CFO Candidate . . . 8
2 Average Treatment Effects (ATEs) . . . 12
3 Conditional Average Treatment Effects (CATEs) . . . 13
4 Sample Profile for the Internship Candidate . . . 25
5 AMCEs for Selecting Each Candidate . . . 45
6 AMCEs for Rating Candidate as Strong . . . 46
7 AMCEs for Forced-choice v. Selecting Each Candidate . . . 49
8 Average Treatment Effects (ATEs) . . . 55
9 Conditional Average Treatment Effects (CATEs) . . . 56
10 AMCEs for Selecting Each Candidate . . . 77
11 AMCEs for Rating Candidate as Strong . . . 78
12 AMCEs for Forced-choice v. Selecting Each Candidate . . . 79
CHAPTER 1: WHO IS DRIVING POLARIZATION? NEED FOR AFFECT (NFA) AND HETEROGENEITY OF PARTISAN BIAS AMONG THE MASSES
Introduction
In their seminal work on voting behavior Campbell et al. (1960) discussed at length how partisanship can be a source of bias by raising a perceptual screen over citizens’ minds. However, the political landscape today (and our society at large) looks very different than it did when these authors theorized about the nature of partisan bias. Mainly, polarization has increased dramatically (Hetherington and Rudolph, 2015; Mason, 2018). Also, the
information revolution has brought about an era in which people’s attention is a commodity (Davenport and Beck, 2001; Wu, 2017). Since attention is often effectively captured by emotional appeals (Phelps, Ling and Carrasco, 2006; Yiend, 2010), emotional appeals are ubiquitous in the current era.
As emotions came to occupy a more prominent place in our society, it is plausible that individual-level factors that drive citizens’ behavioral judgments in this landscape (as opposed to the old landscape) have changed as well. More specifically, people’s judgments and
behaviors might be shaped by their tendency to understand and process emotions–the Need for Affect (NFA)–to a greater degree in the current environment. Consequently, in this research I examine whether people’s NFA trait explains their tendency to show partisan bias.
Polarization comes with a number of negative consequences. For instance, it contributes to legislative gridlock (Binder, 1999; Jones, 2001), leads to decreased trust in government and institutions (Hetherington and Rudolph, 2015; Banda and Kirkland, 2018), and it leads to increased income inequality (McCarty, Poole and Rosenthal, 2016). More polarized populace is also likely to elect ideologically extreme candidates to office, which gives rise to a concern that these candidates will not adequately represent a large segment of the population. Examination of whether for some people partisanship tends to bias their behavioral judgments more than for others, might prove useful in mitigating the negative consequences of polarization.
To examine whether people’s NFA trait is predictive of the size of partisan bias in their behavioral judgments, I conduct a series of survey experiments. In these experiments I asked respondents to evaluate candidates for jobs, a scholarship, an internship, and an award in non-political setting. Respondents evaluated seven candidate profiles in total. For each
candidate profile respondents were assigned to evaluate a Democratic candidate, a Republican candidate, or a candidate whose partisanship was not signaled. Since respondents answered the same evaluative questions after each candidate profile, I use within-subjects analysis and test how partisan bias functions across all seven experiments.
In line with previous literature I find that on average people tend to exhibit out-group partisan bias. While there is less evidence for in-group partisan bias in previous literature, I also find consistent evidence for in-group partisan bias. In regards to the main tests in this study, I find little evidence that those who are low or in the middle of the NFA scale exhibit out-group partisan bias. On the other hand, I find consistent evidence that those who score high on the NFA scale bias evaluations of their opposing partisans in the negative direction. This suggests that out-group partisan bias is mostly driven by people high on the NFA scale. When it comes to in-group partisan bias, there is no evidence that those who score high on NFA, but there is some evidence that those who score low or medium on the NFA scale exhibit this form of bias.
This study makes a contribution to mass affective polarization literature by
exhibit both, in-group and out-group partisan bias. I also contribute to social identity theory by demonstrating that in-group bias is not an automatic consequence of group identification. While on average identifying with a group results in in-group bias, when individual level variation in in-group bias is explored, it is evident that not everyone who identifies with a group exhibits this form of bias. Those who score high on the NFA scale do not show in-group partisan bias in their evaluations.
Polarization
Scholarship on polarization offers considerable and consistent evidence that political elites are currently polarized (Fleisher and Bond, 2001; Hetherington, 2001; McCarty, 2001; Theriault, 2008; Theriault and Rohde, 2011; Shor and McCarty, 2011; McCarty, Poole and Rosenthal, 2016). When it comes to the masses the picture is a bit more mixed. While some argue that the masses are polarized (Levine, Carmines and Huckfeldt, N.d.; Jacobson, 2000; Stonecash, Brewer and Mariani, 2003; Brewer, 2005; Levendusky, N.d.; Abramowitz and Saunders, 2008; Abramowitz, 2010), others argue that there is little evidence of mass polarization (Fiorina, Abrams and Pope, 2005; DiMaggio, Evans and Bryson, 1996; Evans, 2003).
In part the disagreement is over semantics, and in part over what evidence should be indicative of mass polarization (Hetherington, 2009). Ideological distance between an average Democrat and an average Republican has grown (Abramowitz and Jacobson, 2006;
Abramowitz and Saunders, 2008). While some scholars view this as evidence for mass
polarization, Fiorina asserts that this is better characterized as ‘party sorting’ (Fiorina, Abrams and Pope, 2008). However, if one looks at policy preferences of most Americans, they are largely moderate, which would suggest that the masses are not polarized (Fiorina, Abrams and Pope, 2005; Evans, 2003). In addition to ideological distance and policy preferences, some scholars have looked at the partisans’ growing tendency to harbor negative feelings towards and view partisan opponents in a negative light (this is often referred to as affective
and Westwood, 2015; Haidt and Hetherington, 2012).
Technological Changes and Prevalence of Emotional Appeals
The information revolution has brought about an era in which people’s attention is treated as a commodity (Davenport and Beck, 2001; Wu, 2017). For instance, advertisements and products are designed to capture people’s attention (Pieters and Wedel, 2004). Social network and technology platforms like Facebook and Netflix are also in the business of capturing users’ attention (Wu, 2017; Vance, 2011). Attention, in turn, is often successfully captured by emotional appeals (Phelps, Ling and Carrasco, 2006; Yiend, 2010). This explains ubiquitousness of emotional appeals in the current era. It is of note that effectiveness of emotional appeals is not limited to capturing attention. Emotional appeals have been shown to increase user engagement on social network platforms (Lee, Hosanagar and Nair, 2018), increase favorable attitudes towards a brand and brand consideration in advertising studies (Mattila, 1999; Moore and Hutchinson, 1983), and increase political participation (Weber, 2013).
Moreover, consider emotional appeals in the current political media environment. As of 2013, 47 million of Americans consumed the ‘outrage genre’ of news on the daily basis. This style of reporting is characterized by catering to a niche partisan audience. These programs are often led by a charismatic host who always seems to be in an outrage at the opposing partisans regardless of the news being covered. They misrepresent events, mock and vilify opponents, and even use insulting language (Berry and Sobieraj, 2013). In sum,
technological changes and trends in mass media underscore that emotional appeals are often used as a tool, and consequently are prevalent in the current environment.
Social identity, Partisanship, and Partisan Bias
of identification with a group (Tajfel, 1970; Billig and Tajfel, 1973; Tajfel, 1974; Tajfel and Turner, 1979, 1986). Out-group bias, on the other hand is not always present (Struch and Schwartz, 1989; Brewer, 1999). However, conditions like group competition and negative feelings towards the out-group are associated with the presence of out-group bias (Doosje et al., 1998; Mackie and Smith, 1998; Brewer, 2001; Mummendey and Otten, 2001).
Partisanship as a social identity literature views partisanship as a type social identity (Green, Palmquist and Schickler, 2002). Hence, social identity theory informs expectations for partisan bias. In particular, partisans should show in-group bias towards co-partisans, and out-group bias towards opposing partisans. However, while social identity theory argues that in-group (but not out-group) bias is an automatic consequence of identifying with a group, in political science there is more evidence for out-group than in-group partisan bias (Iyengar and Westwood, 2015; Gift and Gift, 2015; Banda, Carsey and Severenchuk, forthcoming). For instance, Gift and Gift (2015) finds evidence that partisans discriminate against their partisan opponents, but finds no evidence that they favor co-partisans in hiring practices. Similarly, Banda, Carsey and Severenchuk (forthcoming) find consistent evidence that respondents lower evaluations of people, places, and even inanimate objects when they are associated with opposing partisans, but the authors find no evidence that respondents raise their evaluations when objects are associated with co-partisans. While (Iyengar and Westwood, 2015) did find evidence for in-group bias in one of the two strategic games respondents participated in, they find consistent evidence for out-group bias in both games.
NFA and Partisan Bias
Psychologists have long recognized that people have stable personality traits that moderate how they interact with the world around them (for review see Mondak, 2010). Political scientists are starting to take heed of this (Mondak and Halperin, 2008; Mondak, 2010; Mondak et al., 2010; Gerber et al., 2013, 2011, 2012).
affect (Maio and Esses, 2001), and exhibit an especially strong emotional responses to disturbing political information (Ryan, Wells and Acree, 2016).
Moreover, NFA has been shown to affect information processing in learning.
Arceneaux and Vander Wielen (2013) conducted a study in which they exposed partisans to consistently negative information about either Democrats or Republicans and examined how people’s evaluations of the two parties changed. The authors found that individuals who score high on NFA tend to process information more consistently with social psychological school of partisanship (as opposed to the running tally model). In particular negative information about the opposing party caused respondents to lower evaluations of the opposing party, however, negative information about respondents own party, did not change their evaluations (Arceneaux and Vander Wielen, 2013). It is of note that Arceneaux and Vander Wielen (2013) also examined how people’s need to engage in effortful thinking–Need for Cognition
(NFC)–affects information learning. Though results were not as consistent as for NFA, overall it seems that individuals high on NFC updated their evaluations more rationally in comparison to people high on NFA (Arceneaux and Vander Wielen, 2013). The authors’ study examined how NFA and NFC are related to changes in evaluations of the two parties as a consequence of information learning. My study, in contrast, examines the extent to which NFA moderates expressions of bias in initial evaluations. Also in contrast to the work of Arceneaux and Vander Wielen (2013), this study includes a control group, which allows me examine the relationship between NFA and in-group and out-group bias separately.
Bias in intergroup evaluations and behavior has been found to be strongly related to emotions (Cottrell and Neuberg, 2005; Mackie, Devos and Smith, 2000). Similarly, Lodge and Taber (2013) also argue that individuals engage in motivated reasoning because of
affective reaction to political stimuli. Maio and Esses (2001) argue that individuals who score high on NFA might develop particularly strong attitudes towards social groups because experiencing strong emotions towards these groups might be satisfying to these individuals. Together, these findings suggests that NFA might moderate expressions of partisan bias. More specifically, I expect:
H2: NFA is positively related with a tendency to exhibit out-group partisan bias.
Study Design and Data
To test my hypotheses I asked respondents to evaluate the profiles of several hypothetical candidates for various jobs, an internship, a scholarship, and an award. Each candidate was randomly assigned to be a Democrat, a Republican, or not to have their
partisanship reported. Respondents were asked the same eight evaluative questions after each profile, which allows me to employ within-subject analysis. This within-subject design has two major advantages. First it allows me to estimate partisan biases across a range of settings. Second, having seven trials per research participant drastically improves statistical power.
At the beginning of the survey respondents answered a number of questions including seven items that were used to construct the NFA battery. These items, which can be viewed in the Appendix A, were the ones that loaded high on factor analysis in the original NFA battery developed by Maio and Esses (2001). These items were combined (by taking their average) into a reliable index (α = .77). Respondents then were asked to evaluate candidates for a chief financial officer, an activist, a secretary, a research assistant, a scholarship recipient, an internship candidate, and a campus award candidate. These prompts were presented to respondents in a random order. Figure 1 presents a sample profile for the CFO candidate.1 The rest of the profiles, which were designed in an analogous way, can be viewed by
interested readers in the Appendix A. These candidate profiles were deliberately minimalist in their design. In this I follow Iyengar and Westwood (2015). Given the number of profiles that respondents had to evaluate, this approach has the virtue of lowering cognitive burden on the respondents.
As Figure 1 shows, in addition to partisanship, candidate profiles contained a number of other attributes. The full list of these attributes along with the values they could take on is presented in Table 1. The values for these attributes were randomly assigned. Because the random assignment was independent of the partisanship random assignment, it is
1This profile was for Democratic candidates. For Republican candidates, “County Democratic
Figure 1:Sample Profile for a CFO Candidate
Below is a profile of a candidate for a chief financial officer (CFO) position at a local business.
Candidate Profile
Name:James Miller
Education:
Bachelor of Arts in Economics (GPA 3.42) MBA (GPA: 3.72)
Relevant Work Experience:
Corporate accountant at Wells Fargo (5 years) General manager at Best buy (3 years)
Volunteer Activities:
American Diabetes Association County Democratic Headquarters
straightforward to estimate the effect of partisanship cues on evaluations. This property of the design means that partisanship effects are best understood as an average across a wide range of candidate background, rather than effects that might be specific to one particular
background.2
After each profile respondents were asked eight questions. Because I wanted to gauge how partisan bias functions in a range of evaluations, I asked respondents to provide both objective and subjective judgments. For instance respondents were asked to how
“Trustworthy,” “Ethical,” and “Open-minded” each candidate was. These are subjective because information in the profiles does not inform logical inferences about these traits. All other questions were more objective. All questions had five response options. Respondents were asked “In general, how qualified do you think [candidate first name] is?” with response options that ranged from “very qualified” to “‘very unqualified.” Respondents were also asked “How likely are you to select [candidate first name] for this position?” with response options that ranged from “very likely” to “very unlikely.” Finally, respondents were asked to rate candidate on the following traits: “Competent,” Hard-working,” “Trustworthy,” “Ethical,” “Intelligent,” “Open-minded.” Answer choices to these ratings ranged from “Extremely well”
2It is of note that varying attributes in these experiments is different in intent and function than varying
to “Not well at all.”
Table 1: Randomly Selected Attributes in Candidate Profiles
Attributesand Their Values
First Names:
Michael, Steve, Mark, James, Brian, David, George, Daniel, Kevin, Casey
Last Names:
Norton, Johnson, Harris, Miller, Davis, Anderson, Taylor, Thompson, Allen, Smith
Volunteer activities:
American Heart Association, American Cancer Society, American Diabetes Association, Lung Cancer Alliance, Red Cross, Local Food Bank, Local Soup Kitchen
College/high school extracurricular activities:
Soccer club, Tennis club, Volleyball club, Cycling club, Ultimate Frisbee club, Kickball club, Baseball club, Flag football club
Undergraduate GPAs:
from 3.12 to 3.17 by .01
High School and Graduate GPAs:
from 3.42 to 3.47 by .01
Results
Table 2: Socio-Demographic Characteristics of the Respondents
Number Percent
Race
White 512 74.10
African American 84 12.16
Hispanic 47 6.80
Asian 32 4.63
Native American 3 0.43
Other 13 1.88
Gender
Male 293 42.40
Female 392 56.73
Other 6 0.87
Age
18–24 90 13.02
25–34 137 19.83
35–44 114 16.50
45–54 112 16.21
55–64 136 19.68
≥65 102 14.76
Education
<High School 27 3.91
High School/GED 181 26.19
Some college 167 24.17
2 year degree 58 8.39
4 year degree 170 24.60
Masters 61 8.83
Doctorate 12 1.74
Professional (JD/MD) 15 2.17
Party ID
Strong Democrat 117 25.62
Weak Democrat 102 14.76
Lean Democratic 52 7.53
Pure Independent 80 11.58
Lean Republican 45 6.51
Weak Republican 93 13.46
Strong Republican 142 20.55
I first present Average Treatment Effects (ATEs) for co-partisan and opposing partisan treatment.3 The former represents the difference in respondents evaluations of a co-partisan and a control group candidate. The latter represents the difference in respondents evaluations of opposing partisan and control group candidate. Within-subjects analysis allows me to examine my hypotheses across all seven candidate experiments at the same time by treating responses to a particular evaluative question as the unit of analysis. More specifically, to examine ATEs for the evaluative questions, I utilize a linear mixed effects model4where I include fixed effects for the candidate profile that respondents evaluated and random effects for each respondent. The fixed effects for type of candidate profile accounts for different baseline levels that candidates are evaluated at. This is necessary because candidate profiles for different positions/awards can be perceived to have different level of a certain trait. For instance, candidates being evaluated for a CFO position might all be perceived to be more hardworking than candidates for a secretary position. The random effects for different
respondents has the effect of accounting for evaluation tendencies among respondents. This is necessary because some respondents have the tendency to evaluate everyone more positively, while others more negatively. Random effects also models clustering of evaluations by respondent. Other than fixed and random effects this model includes a dummy variable for co-partisan and opposing partisan treatment. The coefficients for these variables represent ATEs. I present results of ATEs for different questions in Figure 2 below.5
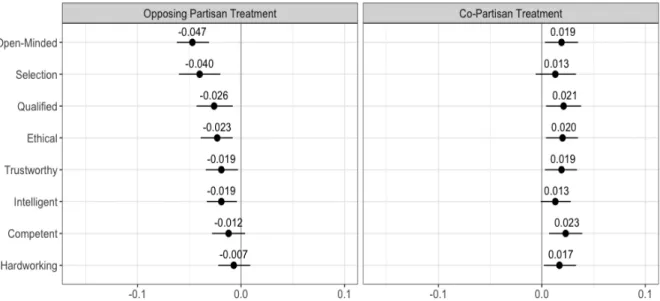
As can be seen in figure 2 in six out of eight tests there is statistically significant evidence that respondents evaluate their opposing partisans less favorably than equivalent control group candidates. More specifically, respondents thought that candidates were 4.4% less open-minded and were 3.8% less likely to select them for the relevant position or award when the candidates were their opposing partisans. Respondents also thought that opposing
3Results in the body of the article include independent leaners in the partisan categories. I repeat these
analyses with leaners excluded from the partisan categories. The results do not substantively differ from those presented here. They can be viewed by interested readers in the Appendix A in Figure 8 and 9.
4Mixed effects models are also often referred to as hierarchical models or multilevel models.
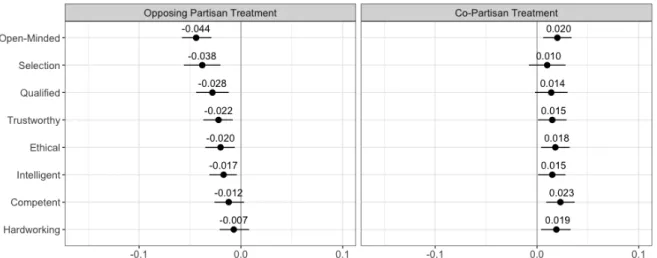
Figure 2:Average Treatment Effects (ATEs)
Average Treatment Effects (ATEs) for “opposing partisan” treatment for eight evaluative questions is presented in the left column. Similarly, ATEs for “co-partisan” treatment for the same questions is presented in the right column. Points represent ATE estimates (calculated as the difference between average evaluation in the control and treatment group), and horizontal bars are 95% confidence intervals.
partisans were 2.8% less qualified, 2.2% less trustworthy, 2.0% less ethical, and 1.7% less intelligent than otherwise identical control group respondents (all significant at p<.05 level). On the other hand, there was no statistically significant evidence that respondents thought that their opposing partisans were less competent or hardworking than similar control group candidates. When it comes to ATEs in the co-partisan treatment in six out of eight tests respondents evaluated co-partisan candidates more favorably than similar control group candidates. For instance, respondents thought that their co-partisans were 2% more
open-minded, 1.5% more trustworthy, and 1.8% more ethical than similar candidates in the control group. Similarly respondents thought that their co-partisans were 1.5% more intelligent, 2.3% more competent, and 1.9% more hardworking than similar control group candidates (all significant at p< .05level). However, there is no statistically significant evidence that respondents were more likely to select or thought that their co-partisans were more qualified than control group candidates.
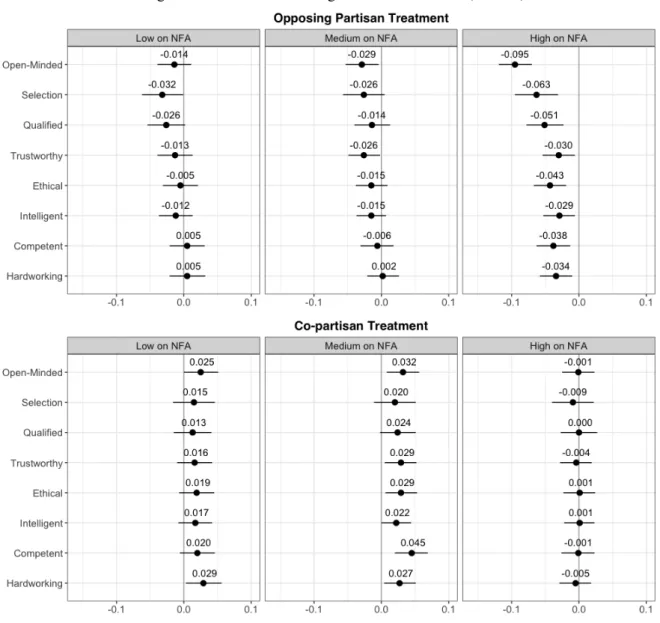
Figure 3:Conditional Average Treatment Effects (CATEs)
Conditional Average Treatment Effects (CATEs) by levels of NFA for “opposing partisan” treatment for eight evaluative questions is presented in the left column. Similarly, CATEs for “co-partisan” treatment for the same questions is presented in the right column. Points represent CATE estimates (calculated as the difference between average evaluation in the control and treatment group), and horizontal bars are 95% confidence intervals.
the NFA scale. Respondents who scored in the bottom 33.3 percentile were placed in the low category. Respondents between 33.3 and 66.6 percentile were placed in the middle category, and respondents scoring higher than 66.6 percentile were placed in the high category. Results for estimated treatment effects conditional on the level of NFA are presented in Figure 3.6
Turning first to evaluatingH2. Recall that when I looked at all respondents, in six out of eight tests there was statistically significant evidence of respondents biasing their
evaluations negatively for opposing partisans. For respondents who score low on NFA in
seven out of eight tests there is no evidence that they bias their evaluations negatively for opposing partisans. The one exception being, respondents were 3.2% percent less likely to select a co-partisan candidate than a similar control group candidate (significant at p<.05 level). For respondents in the middle of the NFA scale in six out of eight tests there is no statistically significant evidence that they bias their evaluations negatively in comparison to control group candidate. Respondents in the middle of the NFA scale did think that opposing partisans were 2.9% less open-minded, and 2.6% less trustworthy (significant at p<.05 level). Turning to respondents who score high on the NFA scale, in all eight tests there is statistically significant evidence that these respondents bias their evaluations in the negative directions for their partisan opponents. Specifically, these respondents thought that opposing partisans were 9.5% less open-minded, and they were 6.3% less likely to select them than similar control group candidates. These respondents also thought that opposing partisans were 5.1% less qualified, 3.9% less trustworthy, 4.3% less ethical, 2.9% less intelligent, 3.8% less competent, and 3.4% less hardworking than otherwise similar control group candidates (all significant at p<.05 level). Overall results in this figure present consistent evidence forH2. That is, NFA is positively related to the tendency to exhibit out-group partisan bias.7
Results for CATEs by NFA level for co-partisan treatment are presented in the bottom row of Figure 3. Recall thatH1stated that NFA will be positively related to a tendency to exhibit in-group partisan bias. For respondents low on NFA in six out of eight tests there is no evidence of biasing evaluations favorably for co-partisans. These respondents did think that co-partisans were 2.5% more open-minded, and 2.9% more hardworking (significant at p< .05 level). For respondents high on NFA in all eight tests there is no statistically significant evidence of biasing evaluations favorably for co-partisans. For respondents in the middle on the NFA scale in five out of eight tests there is evidence of biasing evaluations favorably for co-partisans. Specifically, respondents in the middle of NFA scale thought that co-partisans were 3.2% more open-minded, 2.9% more trustworthy, 2.9% more ethical, 2.2% more more
7For opposing partisan treatment, I also test whether estimates in the Medium NFA and High NFA
intelligent, 4.5.% more competent, and 2.7% more hardworking than otherwise similar control group candidates (significant at p<.05 level). Overall results for co-partisan treatment do not provide support forH1. However, they do uncover non-linear nature of the relationship between in-group favoritism bias and NFA. Namely, it is respondents in the middle of this scale who tend to bias their evaluations favorably for their co-partisans.8
Discussion and Conclusion
In this paper I examine whether some individuals tend to bias their evaluations to a greater extent than others. In line with previous literature I find consistent evidence that partisans bias evaluations of opposing partisans in a negative direction (Iyengar, Sood and Lelkes, 2012; Iyengar and Westwood, 2015; Gift and Gift, 2015; Banda, Carsey and
Severenchuk, forthcoming). I also find consistent evidence that partisans bias their evaluations in a favorably for their co-partisans in comparison to similar control group individuals. As aforementioned, previous literature offers less evidence that partisans show in-group partisan bias. One possible reason why I find consistent evidence of in-group partisan bias is the statistical leverage I get by applying within-subject analysis. For the analysis in Figure 2, my sample size is 4,227, which is considerably bigger than most other studies dealing with the subject.
I also examine heterogeneity of co-partisan and opposing partisan treatment by levels of NFA. I find consistent evidence forH2. Namely, NFA is positively related with the
tendency to exhibit out-group partisan bias. In regards to heterogeneity of treatment effects for co-partisan treatment, there is little evidence for those who score low on NFA and no evidence for those who score high on NFA exhibit in-group partisan bias. On the other hand there is some evidence for in-group partisan bias for those who score in the middle of the NFA scale. Previous literature has examined how NFA moderates changes in respondents
8For co-partisan treatment I also test whether estimates in the Low NFA and Medium NFA category are
evaluations of co-partisans and opposing partisans after they have been exposed to negative information about the relevant group (Arceneaux and Vander Wielen, 2013). In examining bias Arceneaux and Vander Wielen (2013) look at how these changes in evaluations (in response to negative information) for co-partisans are different from changes in evaluations for opposing partisans. While this shows overall bias, it leaves the question open of whether discrepancy between co-partisans and opposing partisans arose due to in-group or out-group partisan bias. The design of my study allowed me to examine how NFA moderates both forms of bias. Such examination has proved fruitful for I found that NFA is positively related to out-group partisan bias. However, NFA does not moderate in-group partisan bias in a linear manner.
This study also contributes to social identity theory, which argues that in-group bias is an automatic consequence of identification with a group (Tajfel, 1970; Billig and Tajfel, 1973; Tajfel, 1974; Tajfel and Turner, 1979, 1986). Contrary to this assertion, I find that in-group bias is not automatic. Though on average respondents exhibit in-group bias, when looking at respondents conditional by level of NFA, it is evident that not all of them exhibit in-group bias. Respondents who are high on NFA showed no evidence of in-group bias, and
CHAPTER 2: PARTISAN BIAS IN POLITICAL AND NON-POLITICAL SETTING
Introduction
The 2016 election brought partisan polarization to the forefront. After the election, a number of news articles reported stories of ordinary Americans having a difficult time navigating holidays with their families. Some have agreed to a ‘no politics rule’ during the holidays for the sake of preserving peace. Others decided that a more appropriate course of action was to confront or even antagonize family members with opposing political views. Others still have decided that a better option was to avoid spending holidays with their family all together (Tavernise and Seelye, 2016; Puglise, 2016; Scoby, 2018; Abber, 2016). It is hardly surprising that partisanship affects peoples interactions at campaign rallies and protests, but these stories illustrate that it can also affect people’s interactions outside of the political arena. But how common is it for people to allow partisanship to influence
interactions outside the political arena, and how severe are the biases?
Experimental research shows that it is common for people’s partisanship to affect their interactions with others in the non-political setting to some degree. For instance, partisanship has been shown to affect choice of dating partners, approval of cross partisan marriages, and perception of physical attractiveness (Phillips and Carsey, 2013; Huber and Malhotra, 2017; Iyengar, Sood and Lelkes, 2012; Nicholson et al., 2016). Partisanship has also been shown to affect economic interactions (McConnell et al., 2018), selection decisions for jobs and scholarships (Gift and Gift, 2015; Iyengar and Westwood, 2015; Banda, Carsey and
Severenchuk, forthcoming), and even evaluation of inanimate objects merely associated with one of two major parties (Banda, Carsey and Severenchuk, forthcoming). Together these studies show that partisanship affects a wide range of behavioral judgments in the non-political setting. This has often been interpreted as evidence of mass polarization (Iyengar, Sood and Lelkes, 2012; Iyengar and Westwood, 2015; Banda, Carsey and Severenchuk, forthcoming). Moreover, conflict extension theory argues that modern
policy issues to many (Layman and Carsey, 2002a,b; Layman et al., 2010), and eventually from policy arena to non-political settings (Banda, Carsey and Severenchuk, forthcoming).
While there is plenty of consistent experimental evidence for the presence of partisan conflict in the non-political setting, the question remains whether this conflict abated in strength as it expanded from political to non-political setting. The answer to this question will tell us whether partisans tend to compartmentalize their partisan identity to the political realm, or whether in the currently polarized partisan politics, they tend to carry over their partisan bias to non-political settings with the same intensity. The answer to this research question will also help link older work that examined the influence of partisanship and partisan bias on judgments in the political realm, with relatively newer work that examines the influence of partisanship and partisan bias on judgments in the non-political setting.
As I discuss below, there are reasons why people’s behavioral judgments might be affected by their partisanship to a greater degree in the political setting. Namely, political settings might raise saliency of people’s political identity. However, there are also reasons why in the current environment partisan biases might spill over from political to non-political setting without abating in strength. Polarizations might have made people’s political identity equally salient in the political and non-political sphere. The research herein develops
understanding of these possibilities.
To answer these research questions I conducted a series of survey experiments. In these experiments, I randomly assigned respondents to evaluate candidates for jobs, a scholarship, an internship, and an award in either political or non-political setting. I then examine the extent to which respondents’ evaluations were driven by partisan considerations.
depressive effect on people’s evaluations.
Partisanship and Bias
Group attachment partisanship literature argues that identification with and a
psychological attachment to a political party leads to partisan bias in information processing (Campbell et al., 1960; Green, Palmquist and Schickler, 2002). The social psychological partisanship perspective argues that partisanship serves as a perceptual screen through which individuals evaluate the political world. In particular, because of this perceptual screen individuals tend to see what is favorable to their party. The stronger the partisan attachment “the more exaggerated the process of selection and perceptual distortion will be” (Campbell et al., 1960, p. 133).
In their work on partisanship as a social identity, Green, Palmquist and Schickler (2002) updated the social psychological perspective by utilizing developments in social identity research (Tajfel, 1978; Tajfel and Turner, 1979). The authors depart from the social psychological perspective on the notion of perceptual screen; hence the answer to why partisanship causes biased information processing is slightly different. They argue that while partisans differ in the way they assess the same candidates and policies, when they are exposed to new political information, they update their evaluations in the same direction. For this reason, the authors reject the idea that partisanship is a perceptual screen that makes individuals select information favorable to their party, and ignore information unfavorable to their party (Green, Palmquist and Schickler, 2002). Instead, the authors assert that partisans tend to exaggerate positive qualities of in-groups and negative qualities of out-groups. While this might seem similar to Campbell and his colleagues’ (1960) notion of perceptual screen, the difference here is that in Green and his colleagues’ work partisan bias results from the tendency to exaggerate, as opposed to a tendency to select information that benefits one’s own party.
that it is inconclusive. On the other hand, Bartels (2002) looks at the changes in evaluations of Democrats and Republicans in response to new information and finds evidence for partisan bias. Also, partisans tend to perceive economic indicators like unemployment and inflation differently depending on which party is in power, which is also indicative of partisan bias (Bartels, 2002).
Social Identity and Bias
Green and his colleagues’ (2002) articulation of how group attachments bias evaluations is consistent with social identity literature. This body of work shows that mere identification with a group is enough to cause in-group favoritism, though not always
out-group bias (Tajfel, 1970, 1978; Tajfel and Turner, 1979; Brewer and Brown, 1998; Billig and Tajfel, 1973). However, group competition (condition present between the two parties) is often enough to cause out-group bias (Tajfel, 1970, 1978; Tajfel and Turner, 1979; Billig and Tajfel, 1973). These two forms of bias can take on different forms. For instance, individuals can exaggerate and enhance positive qualities (in-group favoritism) and exaggerate the negative qualities (out-group derogation) (Brewer and Brown, 1998). This is the type of bias that is emphasized by Green et al. (2002). In-group favoritism can also manifest itself in the form of preference for fellow group members (Billig and Tajfel, 1973). In short, social
identity theory asserts mere identification with in-group will result in bias (Tajfel, 1970, 1978; Tajfel and Turner, 1979). This bias is expected to be there regardless of context as long as individuals identify with a group and can categorize others as in-group or out-group members.
Experimental research in political science supports the notion that people’s decisions in the non-political setting are biased by partisanship (Banda, Carsey and Severenchuk, forthcoming; Iyengar, Sood and Lelkes, 2012; Iyengar and Westwood, 2015; Gift and Gift, 2015). Partisanship bias has been shown to affect hiring and scholarship selection decisions (Gift and Gift, 2015; Iyengar and Westwood, 2015; Banda, Carsey and Severenchuk, forthcoming), perceived attractiveness of and evaluation of potential dating partners (Huber and Malhotra, 2017; Nicholson et al., 2016), approval of marriage across partisan lines
objects merely associated with one of two major parties (Banda, Carsey and Severenchuk, forthcoming). Together this scholarship indicates that people’s evaluations are not merely objective assessments, but rather, in part, are biased by partisanship.
It is noteworthy that in political science there is more evidence for out-group than in-group partisan bias. For instance, Banda, Carsey and Severenchuk (forthcoming) find consistent evidence that partisans evaluate objects less favorably when they linked with opposing partisans, but no evidence that respondents bias evaluations favorably when they are associated with co-partisans. Iyengar and Westwood (2015) as part of a larger study,
examined how in-group and out-group bias affects players’ allocation decisions in strategic games. They found evidence for out-group bias for both games, but evidence for in-group favoritism in only one game. The authors concluded that discrimination against the out-group is based more on out-group animosity than in-group favoritism (Iyengar and Westwood, 2015).
Hypotheses
The are two distinct mechanisms which might cause partisans to evaluate others differently in the political and non-political setting. The first mechanism might increase the magnitude of partisan bias in the political setting by increasing the saliency of the political identity. Saliency of people’s identity has long been theorized by social identity scholars to be positively related with bias in judgments (Oakes, 1987; Gaertner et al., 1993; Haslam et al., 1999). Research shows that information environment can affect identity salience (Oakes, 1987; Gaertner et al., 1993; Haslam et al., 1999). It is very plausible that respondents are reminded of their political identity more frequently in the political setting (whether internally or externally) and as such their partisan identity is made more salient in the political setting.
It is important not conflate identity salience and identity importance. Perhaps because these concepts are often highly correlated, they are often conflated (and hence used
importance.While identity importance should not change across settings, it is plausible that identity salience can change from the non-political to the political setting.
Some previous scholarship differentiates between in-group and out-group bias. If the political setting does in fact raise saliency of people’s partisan identity, I expect that both forms of bias will increase in magnitude in the political setting. This can be expressed as the following two hypotheses.
H1: Respondents will give more favorable evaluations to co-partisans in the political setting in comparison to evaluations of co-partisans in the non-political setting.
H2: Respondents will give less favorable evaluations to opposing partisans in the political setting in comparison to evaluations of opposing partisans in the non-political setting.
Alternatively, it is also plausible that people will bias their evaluations of co-partisans and opposing partisans to the same extent in the political and non-political setting. Scholars generally agree that political elites are more polarized today than a few decades ago
non-political setting as they are in the political setting, partisans should bias their evaluations in both settings similarly.
There is another mechanism that might cause respondents to evaluate people
differently in the political and non-political settings. People might view the political setting more negatively, which should have a depressive effect on evaluations. There is some suggestive evidence that people view political settings more negatively than non-political settings. Specifically, Klar and Krupnikov (2016) find that people perceive neighborhoods with non-political lawn signs more attractive than neighborhoods with political signs. If this is the case, political setting might have a depressive impact on objects evaluated in it. It is noteworthy that while identity salience is hypothesized to affect the magnitude of partisan bias, the effect of political setting here is theorized to affect baseline evaluation level. If the political setting does depress baseline evaluation level, its influence should manifest itself in evaluations of co-partisans, opposing partisans, and individuals whose partisanship is not signaled. However, the clearest test for the presence of this influence on respondents’ judgments can be performed by comparing evaluations of individuals whose partisanship is not signaled in the political and non-political setting. This expectation can be expressed as the following hypothesis.
H3: Respondents will give less favorable evaluations to nonpartisan individuals in the political setting in comparison to evaluations of nonpartisan individuals in the non-political setting.
Study Design
After being presented with each candidate prompt, respondents answered eight evaluative questions. Respondents answered the same evaluative questions after each candidate profile, which allows me to use within-subjects analysis. There are two chief advantages to this design. It allows me to test my hypotheses across a range of settings, and seven trials per respondent considerably increases statistical leverage.
Table 3:Summary of Political and Non-political Cues in Candidate Profiles
Political Nonpolitical
Setting Setting
...Marketing and Communications Internship on Capitol Hill.
...Marketing and Communications Internship in Silicon Valley. ...secretary position at a State
Representative’s office.
...secretary position at a College Dean’s office.
...community activist position at a local political non-profit
organization.
...community activist position at a local non-profit organization.
...a research assistant position at a research organization focused on public policy.
...a research assistant position at a research organization focused on effective philanthropy.
...student award at a local state university...given to students who have successfully gotten peers involved in local elections.
...student award at a local state university...given to students who have successfully gotten peers involved in philanthropy. ...scholarship is awarded to students
who want to study political science, and go into career in politics after college...
...scholarship is awarded to students who want to study communication, and go into career in public relations after college...
...chief financial officer (CFO) position at a city government.
...chief financial officer (CFO) position at a local business.
Before being presented with the first candidate prompt, respondents were shown the following instructions.
for an individual being considered for a different position or award. The computer software will randomly select and present you with a candidate for each position or award.
After being presented with each candidate profile, you will be asked a series of questions in order to evaluate the candidate. Please examine each candidate profile carefully, and answer corresponding questions to the best of your ability.
Figure 4 shows a sample profile for the internship candidate that was shown to respondents in the non-political setting condition.9 Respondents assigned to the political setting received the same prompt except “in Silicon Valley” was replaced with “on Capitol Hill.” Summary of political and non-political cues for all seven candidate prompts can be seen in Table 3. Sample profiles for all seven experimental tasks can be viewed by interested readers in the Appendix B.
Figure 4:Sample Profile for the Internship Candidate
Below is a profile of a candidate for a Marketing and Communications Internship in Silicon Valley.
Candidate Profile
Name:David Anderson
Education:
Bachelor of Arts in Communications, May 2019 Minor in Journalism
GPA 3.42
Leadership Experience:
Vice President of Journalism Club (1 year)
College Activities:
Kickball club College Democrats
Volunteer Experience:
The Red Cross Local Soup Kitchen
In addition to partisanship, candidate profiles had a number of other attributes that were randomly assigned. This adds realism to the candidate profiles. Since the assignment of these attributes is random, their effect on the outcome variable, on average, is the same in both conditions (political and non-political setting). Candidates’ first names were selected from the following generic American male names: Michael, Steve, Mark, James, Brian, David, George,
9Figure 4 shows a sample profile for a Democratic candidate. For a Republican candidate, “College
Daniel, Kevin, and Casey. Last names were selected from the following common American last names: Norton, Johnson, Harris, Miller, Davis, Anderson, Taylor, Thompson, Allen, Smith. Once selected, first names and last names were combined to form a candidate’s full name. It is noteworthy that since this is initial examination of how partisanship bias functions in the political and non-political setting, I decided to restrict my exploration on race and gender variables. However, future research could examine how partisan bias in both settings interacts with gender and race.
Volunteer activities and college activities (where applicable) were randomly selected from a list of such activities. The only exception to this is when volunteer activity or college activity was used to signal partisanship of the candidate (non-partisan cue, Democratic cue, or Republican cue). Volunteer activities were randomly selected from the following: American Heart Association, American Cancer Society, American Diabetes Association, Lung Cancer Alliance, Red Cross, Local Soup Kitchen. College and high school extracurricular activities were randomly selected from the following: Soccer club, Tennis club, Volleyball club, Cycling club, Ultimate Frisbee club, Kickball club, Baseball club, Flag football club.
Moreover, undergraduate GPAs were randomly selected from a uniform distribution ranging from 3.12 to 3.17 (by .01). Where applicable high school and business school GPAs were randomly selected from a uniform distribution ranging from 3.42 to 3.47 (also by .01).
After being presented with a particular candidate prompt, respondents were asked the following questions. “In general, how qualified do you think [candidate first name] is?” Responses to this question ranged from “very qualified” to “very unqualified.” Respondents were also asked “How likely are you to select [candidate first name] for this position?” Answer choice for this question ranged from “very likely” to “very unlikely.” Respondents were also asked “When it comes to future performance in this position, how well do each of the following words or phrases describe [candidate first name]?” For this question respondents were asked to rate candidate on the following traits: “Competent,” Hard-working,”
Results
I collected the data for this study on a Survey Sampling International (SSI) sample of U.S. adults. This sample was balanced on age, gender, race/ethnicity, and region (West, Midwest, Northeast and South) to reflect demographics of the U.S. population. The data was collected in March of 2019 and contains 1,367 respondents. Of these 691 were assigned to the non-political condition and 676 were assigned to the political condition. Table 4 shows sample breakdown of respondents’ socio-demographic characteristics by setting.
Since respondents answered the same evaluative questions for each candidate profile I am able to utilize within-subject analysis. More specifically I utilize a linear mixed effects model10where I hold fixed effects for the seven candidate profiles and random effects for each respondent. The fixed effects for type of candidate profile accounts for different baseline levels at which different candidates are evaluated at. This is necessary because candidate profiles for different positions/awards can be perceived to have different levels of a certain trait. For instance, candidates being evaluated for a CFO position might be perceived to be more hardworking than candidates for a secretary position. The random effects for different respondents is necessary to account for different evaluation tendencies among respondents. That is, some respondents have the tendency to evaluate everyone more positively, while others more negatively. Random intercepts for respondents also models clustering of responses by respondent (there are multiple evaluations for each respondent). Finally,
within-subjects analysis allows me to treat response to each evaluative question (DV) as a unit of analysis as opposed to treating each subject as a unit of analysis.
Moreover, I model respondents’ evaluations as a function of whether they evaluated a candidate prompt of a co-partisan or partisan opponent. Both of these are dummy variables with control group candidate prompts being the baseline. I also include a dummy variable for whether respondents were assigned to the political setting condition, and an interaction between this variable and co-partisan and partisan opponent variables. While respondents’
Table 4: Demographic Characteristics of the Respondents
Setting
Non-political
Political
Number % Number %
Race
White 512 74.10 500 73.96
African American 84 12.16 82 12.13
Hispanic 47 6.80 45 6.66
Asian 32 4.63 45 5.18
Native American 3 0.43 5 0.74
Other 13 1.88 7 1.04
Gender
Male 293 42.40 308 45.56
Female 392 56.73 364 53.85
Other 6 0.87 4 0.59
Age
18–24 90 13.02 106 15.67
25–34 137 19.83 111 16.42
35–44 114 16.50 104 15.38
45–54 112 16.21 148 21.89
55–64 136 19.68 111 16.42
≥65 102 14.76 96 14.20
Education
<High School 27 3.91 17 2.51
High School/GED 181 26.19 174 25.74
Some college 167 24.17 179 26.48
2 year degree 58 8.39 58 8.58
4 year degree 170 24.60 158 23.37
Masters 61 8.83 56 8.28
Doctorate 12 1.74 10 1.48
Professional (JD/MD) 15 2.17 24 3.55
Party ID
Strong Democrat 117 25.62 163 24.11
Weak Democrat 102 14.76 84 12.43
Lean Democratic 52 7.53 56 8.28
Pure Independent 80 11.58 101 14.94
Lean Republican 45 6.51 57 8.43
Weak Republican 93 13.46 93 13.76
Strong Republican 142 20.55 122 18.05
answers to questions that are used as dependent variables (the likelihood of selection or evaluation of candidates on different traits) were recorded on a scale ranging from 1 to 5, I rescale these variables to range between 0 and 1. This allows for a more intuitive
interpretation of the impact of independent variables on dependent variables. It is also of note that the dependent variables were coded such that higher values indicate more favorable evaluation.
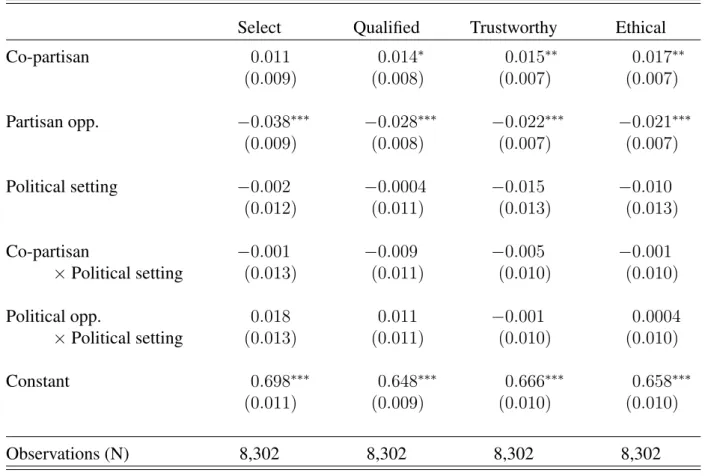
Table 5:Candidate Evaluations in Non-political and Political Setting
Select Qualified Trustworthy Ethical
Co-partisan 0.011 0.014∗ 0.015∗∗ 0.017∗∗
(0.009) (0.008) (0.007) (0.007)
Partisan opp. −0.038∗∗∗ −0.028∗∗∗ −0.022∗∗∗ −0.021∗∗∗
(0.009) (0.008) (0.007) (0.007)
Political setting −0.002 −0.0004 −0.015 −0.010
(0.012) (0.011) (0.013) (0.013)
Co-partisan −0.001 −0.009 −0.005 −0.001
×Political setting (0.013) (0.011) (0.010) (0.010)
Political opp. 0.018 0.011 −0.001 0.0004
×Political setting (0.013) (0.011) (0.010) (0.010)
Constant 0.698∗∗∗ 0.648∗∗∗ 0.666∗∗∗ 0.658∗∗∗
(0.011) (0.009) (0.010) (0.010)
Observations (N) 8,302 8,302 8,302 8,302
Note: ∗p<0.1;∗∗p<0.05;∗∗∗p<0.01
I present results for candidate evaluations in Tables 5 and 6.11 The constant term in the
11In this table I exclude pure independents from the analysis. This allows me to compare partisans’
tables represents an average evaluation (between 0 and 1) for candidates with no partisan cue. Six out of eight coefficients for the “Co-partisan” variable are positive and statistically
significant. This indicates that as a general rule, respondents give more favorable evaluations to co-partisans in comparison to the same individuals whose partisanship is not signaled. Across all respondents and evaluations of all candidate prompts, however, such partisan favoritism is substantively minor. For instance, respondents thought that their co-partisans were 1.5% more trustworthy, 1.7% more ethical, 1.5% more intelligent, 2.0% more open-minded, 2.3% more competent, and 1.9% more hardworking than the same control group candidates (all significant atp < .05level).
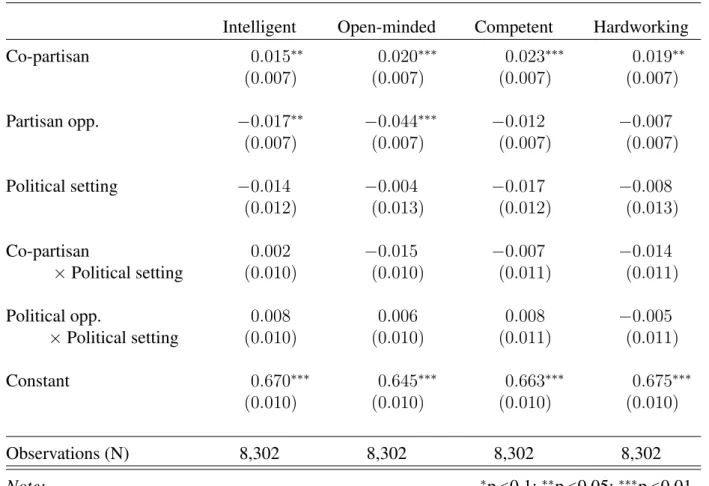
Table 6:Candidate Evaluations in Non-political and Political Setting
Intelligent Open-minded Competent Hardworking
Co-partisan 0.015∗∗ 0.020∗∗∗ 0.023∗∗∗ 0.019∗∗
(0.007) (0.007) (0.007) (0.007)
Partisan opp. −0.017∗∗ −0.044∗∗∗ −0.012 −0.007
(0.007) (0.007) (0.007) (0.007)
Political setting −0.014 −0.004 −0.017 −0.008
(0.012) (0.013) (0.012) (0.013)
Co-partisan 0.002 −0.015 −0.007 −0.014
×Political setting (0.010) (0.010) (0.011) (0.011)
Political opp. 0.008 0.006 0.008 −0.005
×Political setting (0.010) (0.010) (0.011) (0.011)
Constant 0.670∗∗∗ 0.645∗∗∗ 0.663∗∗∗ 0.675∗∗∗
(0.010) (0.010) (0.010) (0.010)
Observations (N) 8,302 8,302 8,302 8,302
Note: ∗p<0.1;∗∗p<0.05;∗∗∗p<0.01
I also find consistent evidence that respondents evaluate their partisan opponents more negatively than individuals whose partisanship they do not know. Coefficients for the
“Partisan Opponent” variable are negative and statistically significant in six out of eight cases. For instance, respondents were 3.5% less likely to select a partisan opponent, and thought that partisan opponents were 2.8% less qualified, 2.2% less trustworthy, 2.1% less ethical, 1.7% less intelligent, 4.4% less open-minded (all significant a p< .05level). A careful reader might notice that when both are significant, the magnitude of out-group partisan bias is bigger than in-group partisan bias. This is in line with the literature on negative partisanship that argues that partisans are more motivated by the dislike of partisan opponents than a like for
co-partisans (Iyengar and Westwood, 2015; Abramowitz and Webster, 2016, 2018). It’s also of note that coefficients in table 5 and 6 show how much more positive respondents evaluate co-partisans or how much more negatively they evaluate opposing partisans in comparison to candidates whose partisanship was not signaled. The discrepancy between how respondents evaluate co-partisans and partisan opponents is bigger in size as it is comprised of both in-group and out-group bias. Overall, in line with previous research I find consistent evidence of partisan bias (Iyengar, Sood and Lelkes, 2012; Iyengar and Westwood, 2015; Gift and Gift, 2015; Banda, Carsey and Severenchuk, forthcoming).
Moving on to testing hypotheses of this study. H1andH2expected that respondents’ partisan bias (towards co-partisans and partisan opponents) will be intensified in the political setting. Whether respondents evaluate co-partisans more favorably in the political setting, can be seen by the coefficients on the interaction term “Co-partisan×Political setting.” Similarly, whether respondents exhibited more bias towards partisan opponents in the political setting can be determined by looking at the coefficients on the interaction term “Partisan opp.×
Political setting.” Across all eight evaluative questions the coefficients on these interaction terms are never statistically significant. In other words, respondents do not evaluate their co-partisans more positively, or partisan opponents more negatively in the political setting than they do in the non-political setting. This suggests that people’s partisan identity is just as salient in the non-political setting as it is in the political setting. If partisan conflict is