ULTRASOUND MEDIATED NANOPARTICLE DRUG DELIVERY
Lee B. Mullin
A dissertation submitted to the faculty of the University of North Carolina at Chapel Hill in partial fulfillment of the requirements for the degree of Doctor of Philosophy in the Department of Biomedical Engineering.
Chapel Hill 2014
Approved by: Paul A. Dayton Caterina M. Gallippi Michael Jay
c 2014 Lee B. Mullin
ABSTRACT
Lee B. Mullin: Ultrasound Mediated Nanoparticle Drug Delivery. (Under the direction of Paul A. Dayton)
Ultrasound is not only a powerful diagnostic tool, but also a promising therapeutic technology that can be used to improve localized drug delivery. Microbubble contrast agents are micron sized encapsulated gas filled bubbles that are administered intra-venously. Originally developed to enhance ultrasound images, microbubbles are highly echogenic due to the gas core that provides a detectable impedance difference from the surrounding medium. The core also allows for controlled response of the microbubbles to ultrasound pulses. Microbubbles can be pushed using acoustic radiation force and ruptured using high pressures. Destruction of microbubbles can increase permeability at the cellular and vascular level, which can be advantageous for drug delivery.
Advances in drug delivery methods have been seen with the introduction of ticles, nanometer sized objects often carrying a drug payload. In chemotherapy, nanopar-ticles can deliver drugs to tumors while limiting systemic exposure due to abnormalities in tumor vasculature such large gaps between endothelial cells that allow nanoparticles to enter into the interstitial space; this is referred to as the enhanced permeability and retention (EPR) effect. However, this effect may be overestimated in many tumors. Additionally, only a small percentage of the injected dose accumulates in the tumor, which most the nanoparticles accumulating in the liver and spleen.
To my parents, for their endless support and encouragement, and to Jon Nunn, who has been an incredibly loving, supportive
ACKNOWLEDGMENTS
There are so many people who have contributed either directly, or indirectly, to the completion of this work, and without whom I would not have survived graduate school. I want to thank my advisor, Paul Dayton, for his guidance and support; my lab mates, especially Jason Streeter, Ryan Gessner, Paul Sheeran, Steve Feingold and Chris Arena, who helped me through the entire process, assisted with experiments, and allowed me to vent; Jim Tsuruta and Kennita Johnson, were invaluable resources who were was always willing to troubleshoot experiments with me and assisted in material preparation. This work involved collaborations with multiple groups and individuals, specifically the Jay Lab: Jun Han, Marina Grace Leed, Xiuling Lu and Jin-Ki Kim; the Mumper Lab: Lei Peng, Ping Ma, Saurabh Wadhwa and Russ Mumper, and the Zamboni Lab: Gina Song and Bill Zamboni. Finally, I want to thank the UNC animal core, specifically Charlene Ross, Karla Johnson, Silmara Camargo, Mark Ross and Alain Valdivia, who assisted with animal experiments and the BRIC staff who assisted with optical imaging, specifically Hong Yuan and Jonathan Frank.
TABLE OF CONTENTS
Table of Contents . . . vii
List of Figures . . . xii
List of Tables . . . xiv
List of Abbreviations . . . xv
1 Introduction . . . 1
1.1 Ultrasound and Microbubble Contrast Agents . . . 1
1.1.1 History of Contrast Agent Development . . . 2
1.1.2 Response of Microbubble Contrast Agents to Ultrasound . . 3
1.2 Cancer and Nanoparticles . . . 4
1.2.1 Chemotherapeutic Drugs . . . 4
1.2.2 Tumor Microenvironment . . . 5
1.2.3 Nanoparticles . . . 7
1.3 Scope . . . 10
2 US Drug Delivery . . . 12
2.1 Introduction . . . 12
2.2 Ultrasound and Nanoparticles . . . 12
2.2.2 Types of Administration . . . 15
2.3 Ultrasound Setups . . . 17
2.4 Review of Successful Nanoparticle Delivery Studies . . . 18
2.5 Summary . . . 21
3 US and MB Parameters for Sonoporation . . . 22
3.1 Introduction . . . 22
3.2 Materials and Methods . . . 24
3.2.1 Cell Culture . . . 24
3.2.2 Microbubble Preparation . . . 24
3.2.3 Sonoporation Setup . . . 25
3.2.4 Image Analysis . . . 27
3.2.5 Statistical Analysis . . . 27
3.3 Results and Discussion . . . 28
3.4 Conclusions . . . 36
4 Design of Acoustically Active NC Delivery Vehicles for US-Targeted Chemotherapy . . . 37
4.1 Introduction . . . 37
4.2 Materials and Methods . . . 38
4.2.1 Materials . . . 38
4.2.2 Biotinylated Microbubble Preparation . . . 38
4.2.3 BTM Nanocapsule Preparation . . . 38
4.2.4 AADV Preparation . . . 40
4.2.5 Cell Culture . . . 40
4.2.6 In Vitro Delivery . . . 40
4.2.7 Vehicle Drug Loading . . . 42
4.4 Conclusions . . . 44
5 4T1 Tumor Treatment with Paclitaxel NC and MB Enhanced US Delivery . . . 47
5.1 Introduction . . . 47
5.2 Materials and Methods . . . 48
5.2.1 Materials . . . 48
5.2.2 Microbubble Preparation . . . 48
5.2.3 Nanocapsule Preparation . . . 48
5.2.4 Animal Preparation . . . 49
5.2.5 Treatment . . . 50
5.2.6 Analysis . . . 51
5.3 Results and Discussion . . . 51
5.4 Conclusions . . . 54
6 In Vivo Targeted NP Delivery to Tumors with ARF . . . 55
6.1 Introduction . . . 55
6.2 Materials and Methods . . . 56
6.2.1 Materials . . . 56
6.2.2 Biotinylated Microbubble Preparation . . . 56
6.2.3 Targeted Nanoparticle and Microbubble Preparation . . . . 57
6.2.4 Targeted Fluorescent Microbubble Preparation . . . 57
6.2.5 Animal Preparation . . . 57
6.2.6 Ultrasound Procedure . . . 58
6.2.7 Optical Imaging . . . 60
6.3 Results and Discussion . . . 60
6.3.1 Nanoparticle Loaded Microbubbles . . . 60
6.4 Conclusions . . . 68
7 PK Analysis of US Mediated PEGylated Liposomal Doxorubicin Delivery to Tumors . . . 69
7.1 Introduction . . . 69
7.2 Materials and Methods . . . 70
7.2.1 Microbubble Preparation . . . 70
7.2.2 PLD Preparation . . . 71
7.2.3 Animal Preparation . . . 71
7.2.4 Pharmacokinetic Study Design . . . 73
7.2.5 Sample Processing and Analytical Methods . . . 73
7.2.6 Pharmacokinetic Analysis . . . 75
7.3 Results . . . 75
7.3.1 Study 1 . . . 75
7.3.2 Study 2 . . . 81
7.4 Discussion . . . 83
7.5 Conclusions . . . 87
8 Concluding Remarks . . . 88
8.1 Summary . . . 88
8.1.1 MB Formulations . . . 90
8.1.2 Ultrasound Sources . . . 90
8.2 Future Directions . . . 94
8.3 Clinical Translation . . . 96
8.4 Conclusions . . . 100
A Review of Nanoparticle Delivery Studies . . . 101
Times of Ultrasound MCAs in Rats . . . 103
B.1 Introduction . . . 103
B.2 Experimental . . . 105
B.2.1 Gas Diffusion Model . . . 105
B.2.2 Animal Preparation . . . 107
B.2.3 Contrast Agent Preparation and Administration . . . 107
B.2.4 Image Acquisition . . . 108
B.2.5 Monitoring Physiological Changes . . . 109
B.2.6 Measuring Microbubble Circulation Time . . . 109
B.3 Results . . . 110
B.3.1 Effects of Carrier Gas Composition on MCA Lifetime . . . . 110
B.3.2 Relationships Between Carrier Gas and Physiology . . . 111
B.3.3 Simulations of MCA Circulation Time . . . 112
B.4 Discussion and Conclusion . . . 114
B.5 Acknowledgements . . . 115
LIST OF FIGURES
1.1 Microbubble Schematic . . . 2
3.1 Microbubble Size Distributions . . . 25
3.2 Sonoporation Setup . . . 26
3.3 Acoustic Parameters . . . 29
3.4 Effects of Concentration . . . 32
3.5 Effects of Size . . . 35
4.1 BTM Nanocapsule Schematic . . . 39
4.2 Flow Phantom Set-up for Ultrasound Parameter Testing . . . 41
4.3 In vitro Nanoparticle Delivery . . . 41
4.4 Nanoparticle Loaded Microbubble . . . 43
4.5 In vitro Nanoparticle Delivery with Focused Ultrasound . . . 45
4.6 Microbubble Drug Loading Curve . . . 46
5.1 C22 Paclitaxel Nanocapsules . . . 49
5.2 In vivo Treatment Setup . . . 50
5.3 Average Tumor Volume . . . 52
5.4 Dose Comparison . . . 53
5.5 Tumor Histology . . . 54
6.1 Clinical Ultrasound System Used for Enhanced Delivery . . . 59
6.2 Confirmation of NP loading . . . 61
6.3 Ex vivo Optical Imaging of AADV and Tumor Tissue . . . 62
6.5 AADV Biodistribution Imaging . . . 64
6.6 DiR MB Delivery to Tumors . . . 65
6.7 Optical Imaging of Liver and Tumor Tissue . . . 66
7.1 Therapeutic Ultrasound Setup for PLD Delivery . . . 72
7.2 PK Plots After PLD Treatment in C3Tag GEMM . . . 78
7.3 Comparison of Delivery in Tumors With and Without US . . . 81
7.4 PK Plots After PLD Treatment in Implanted C3Tag Tumor Model 82 B.1 Intensity Curve Example . . . 111
B.2 Half Life Comparison . . . 116
B.3 Simulated PFB . . . 117
LIST OF TABLES
3.1 Ultrasound Parameters . . . 27
3.2 Microbubble Parameters . . . 27
4.1 BTM Properties . . . 42
7.1 PK Parameters C3Tag GEMM . . . 76
7.2 GEMM C3Tag AUC Values . . . 77
7.3 Concentration Ratios C3Tag GEMM . . . 80
7.4 Concentration Ratios in Implanted C3Tag . . . 80
7.5 PK Parameters Implanted C3Tag Mice . . . 83
7.6 Implanted C3Tag AUC Values . . . 84
8.1 Summary of Studies I . . . 93
8.2 Summary of Studies II . . . 94
A.1 Summary of In Vitro Studies . . . 101
A.2 Summary of In Vivo Studies . . . 102
LIST OF ABBREVIATIONS
2-D Two-Dimensional
3-D Three-Dimensional
AADV Acoustically Active Delivery Vehicle
ANG Angiopoitin
ARF Acoustic Radiation Force
AUC Area Under Curve
B-mode Brightness Mode
Brij 78 polyoxyl 20-stearyl ether
BTM Brij TPGS Miglyol
C Cycle
C22-PX 2’-benenoyl-paclitaxel conjugate
CL Clearance
Cmax Maximum Concentration
CPP Cycles Per Pulse
CPS Cadence Pulse Sequence
cRGD Cyclo-Arg-Ala-Gly-Asp-D-Tyr-Cys
DC Duty Cycle
DiR 1,1’-Dioctadecyl-3,3,3’,3’-Tetramethylindotricarbocyanine Iodide
DMEM Dulbecco’s Modified Eagle’s Medium
DNA Deoxyribonucleic Acid
DOX Doxorubicin
DPPC 1,2 Distearoyl-sn-Glycero-3-Phosphocholine
DSPC 1,2 Distearoyl-sn-glycero-3-phosphatidylcholine
DSPE P2K 1,2 Distearoyl-sn-Glycero-3-Phosphoethanolmine-N-Methoxy-Polyethylene Glycol-2000
Em Emission
EPR Enhanced Permeability and Retention
Ex Excitation
FDA Food and Drug Administration
FGF Fibroblast Growth Factor
FR Frame Rate
FSA Fibrosarcoma
GEMM Genetically Engineered Mouse Model GFP Green Fluorescent Protein
HIFU High Intensity Focused Ultrasound
HL Half Life
HPLC High Pressure Liquid Chromatography
HUVEC Human Umbilical Vein Endothelial Cell
IACUC Plasmid DNA
IHC Immunohistochemistry
JPEG Joint Photographic Experts Group
MB Microbubble
MCA Microbubble Contrast Agent
MHz Megahertz
MI Mechanical Index
MPa Megapascals
MPS Mononuclear Phagocyte System
mRNA Messenger RNA
NC Nanocapsule
NP Nanoparticle
PBS Phosphate Buffered Saline PDGF Platlet Derived Growth Factor
PEG Polyethylene Glycol
PK Pharmacokinetics
PLD PEGylated Liposomal Doxorubicin
PLGA poly(lactic-coglycolic acid)
PRF Pulse Repetition Frequency
PRP Pulse Repetition Period
PS Polystyrene
PW Pulsed Wave
QD Quantum Dots
R3230 Rodent Mammary Adenocarcinoma Cells
RES Reticulendothelial System
RNA Ribonucleic Acid ROI Region of Interest
siRNA Small Interfering RNA
Spi Sum of partial pressure
SPIO Superparamagetic Iron Oxide
SPS Solid Phase Separation TIFF Tagged Image File Format
Tmax Time of Maximum Concentration
TPGS D-α-tocopheryl polyethylene glycol 1000 succinate
US Ultrasound
UV Ultraviolet
Vd Volume Distribution
CHAPTER 1
Introduction
Ultrasound (US) imaging is one of the most widely used imaging modalities in the clinical setting. It is safe (does not use ionizing radiation), inexpensive, and portable. Ultrasound can be used as a primary diagnostic tool or in combinations with other modalities and procedures, such as with an ultrasound guided needle biopsy. While most individuals are familiar with the role of ultrasound in obstetrics and echocar-diography, the capabilities of ultrasound reach far beyond those fields. Interestingly, ultrasound can be used both for diagnostic imaging and for therapy. In recent decades, the field of therapeutic ultrasound has made great progress with developments in both preclinical and clinical settings aided by the use of microbubble contrast agents.
1.1 Ultrasound and Microbubble Contrast Agents
Approved for use in echocardiography, microbubble contrast agents (MCA) are en-capsulated gaseous microspheres that improve the quality of ultrasound images as a result of the difference in acoustic impedance between their gaseous core and the sur-rounding medium (blood) and because of their nonlinear oscillation in an acoustic field [1; 2; 3; 4; 5]. With diameters ranging from 1-10 microns, microbubbles are composed
c
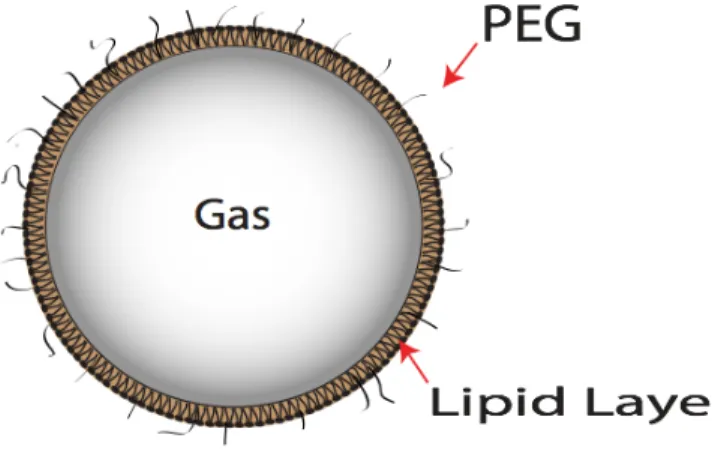
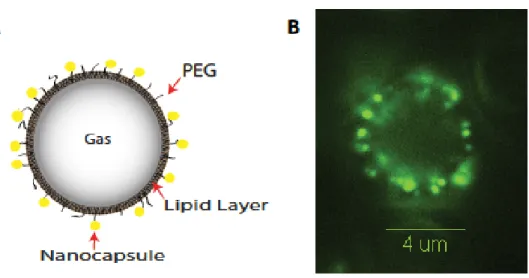
of a protein, polymer, or lipid shell layer, and a gas core filled with a high molecular weight gas such as a perfluorocarbon or sulfur hexafluoride (Figure 1.1) [6].
Figure 1.1: Microbubbles are composed of a gas core and stabilizing shell, such as a lipid layer. Polyethylene glycol (PEG) adds stability and reduces bubble aggregate formation.
Microbubbles have been utilized for imaging myocardial perfusion [7; 8]; left ven-tricular opacification [9; 10]; blood perfusion in tumors [11; 12], livers [13], and kidneys [14]; and for molecular targeting of angiogenesis [15; 16] or inflammation [17; 18; 19]. In recent years, the use of ultrasound microbubble contrast agents has expanded beyond their primary role in diagnostics and into the research fields of drug and gene therapy [1; 5; 2; 3].
1.1.1 History of Contrast Agent Development
developed to prolong circulation lifetime of the bubbles. First generation contrast agents, Albunex microbubbles, were composed of a serum albumin shell and air core. Optison was later developed with a perfluorocarbon gas core. The incorporation of a higher molecular weight gas prolonged circulation as the modified gas core diffuses slower through the shell compared to air. Another important feature of microbubbles is the incorporation of polyethylene glycol (PEG), which prevents bubble aggregation and helps to avoid being phagocytosed while circulating. Definity, which is the contrast agent currently approved by the Food and Drug Administration (FDA) consists of a lipid shell and perflurocarbon gas core. Other agents, such as SonoVue (Bracco) are in use throughout the world, but are not approved in the United States. Additionally, many research groups, including our own, manufacture their own contrast agents for research purposes.
1.1.2 Response of Microbubble Contrast Agents to Ultrasound
Image Quality Improvement
The gas core effectively reflects sound waves due to the differences in impedance (a property based on density and the speed of sound) between the gas core and surrounding tissue and blood. Additionally, the compressibility of the microbubble due to the shell creates a nonlinear response of the microbubble as it expands and contracts within the ultrasound field. This nonlinear response produces harmonic signals that can be detected by ultrasound systems allowing contrast imaging to be a powerful clinical tool.
Cavitation and Microbubble Destruction
microbubble. As a result, the microbubble may fragment and dissociate. Microbubble destruction can lead to changes in cellular and vascular permeability. The process of causing pore formation in cells is known as sonoporation, explored in Chapters 2 and 3.
Radiation Force
Acoustic radiation force, or the Bjerknes force, refers to the directional force ex-perienced by objects in an ultrasound field. Microbubbles can be translated in the direction of the acoustic wave propagation due to the transfer of momentum from the sound wave to the bubble [21; 22]. In order to achieve translation, radiation force pulse sequences require a high duty cycle which is low in amplitude so as to not rupture the microbubbles. Radiation force applied perpendicularly to vessel orientation can result in microbubbles being pushed to the vessel walls, where they can accumulate [23].
This use of radiation force can be applied to many areas of ultrasound including molecular imaging [24; 25], drug delivery [26], in addition to the field of elastography to determine properties of tissues [27]. When applied to microbubbles, acoustic radiation force has been shown to increase the number of microbubbles present at a target site by up to a 100 fold compared to without radiation forcein vitro [28], and up to 20 fold increasein vivo [29].
1.2 Cancer and Nanoparticles
1.2.1 Chemotherapeutic Drugs
used [31].
Traditional chemotherapy drugs attack rapidly dividing cells, meaning cancerous as well as normal cells can be affected [32]. Hair loss, gastrointestinal issues, and myelosuppression are common side effects seen with chemotherapy treatment; nausea and vomiting are often cited as top distressing symptoms. These adverse effects can lead to esophageal tears, fractures, malnutrition, acid-base and electrolyte changes and patients’ refusal to continue chemotherapeutic cycles, which decrease patient quality of life and compromises treatment efficacy [33].
There are many chemotherapeutics used in the clinic today, however, this research will focus on drug formulations involving doxorubicin and paclitaxel. Paclitaxel is most commonly used to treat lung, breast, ovarian cancer [34; 35]. One of the dose limiting side effects of this class of drug is peripheral nerve damage. Doxorubicin, an anthracycline, is an example of an anti-tumor antibiotic that interferes with enzymes associated with DNA replication. While this class of drug is used to treat many cancer types, cardiac damage is a concern for treatment [36]. Along with serious side effects from chemotherapeutics, limitations of traditional chemotherapy drug include limited solubility, lack of specificity and multidrug resistance [31; 37]. Ways to address these limitations are discussed later in this chapter and throughout this dissertation.
1.2.2 Tumor Microenvironment
mediating tumor angiogenesis by binding to vascular endothelial growth factor recep-tor 2 (VEGF-2), which is presented on endothelial cells. Binding to the receprecep-tor starts multiple signaling pathways leading to up-regulation of genes triggering proliferation and migration of endothelial cells [42]. Vasodilation occurs along with an increase in permeability of existing capillaries. This is followed by extravasation of plasma proteins which provide the matrix for migrating endothelial cells [43; 39]. The TIE-2 receptor, also expressed on the vascular endothelium is linked to the tyrosine kinase signaling pathway. Angiopoioetin-1 and angiopoietin-2 bind to the TIE-2 receptor, signaling loosening of the pericytes along the vessels [43]. When endothelial migration occurs, a tip cell is selected and the neighboring cells (stalk cells) divide.
immune cells [38]. The continued hypoxic state triggers VEGF and other factors from tumor cells and recruited host cells (such as inflammatory cells), further promoting the angiogenesis cycle [39].
Enhanced Permeability and Retention Effect
The abnormal characteristics of tumor angiogenesis contribute to what is known as the enhanced permeability and retention (EPR) effect, first described by Matsumura and Meada in 1986 [45]. Due to the leaky vessels and large fenestrations (from abnor-malities described above), tumor vasculature is more permeable than healthy vessels. The gaps or pores found in tumor vessels has been found to often range from 100 nm up to 2µm, depending on the tumor type and location [38]. Some reports have even cited endothelial openings as large as 4.7 µm [46]. The enhanced retention comes from the lack of lymphatic clearance in the tumor tissue. The lymphatic system within tumors is nonfunctional (does not transport fluid or macromolecules) due to compression of lymphatic vessels, which causes an increase in interstitial pressure. [38; 41].
1.2.3 Nanoparticles
targeting ligands and drug combinations [50].
Nanoparticles are often used as delivery vehicles by encapsulating a therapeutic com-pound that may otherwise cause systemic toxicity if delivered in free form. Nanoparticle delivery vehicles show promise for carrying high therapeutic payloads, controllable re-lease rates, and targeting abilities - both passive and active [48]. Passive targeting refers to the uptake of particles based solely on their size. Active targeting involves adding a component to the particle that will bind to a specific biological tag that is overexpressed in the tumor such as integrins, folic acid, or antigens.
In cancer therapy, the small size of nanoparticles is particularly advantageous within tumor vasculature. The EPR effect enables passive targeting of nanoparticle drugs to tumors. The particles cannot pass through normal vasculature with endothelial junc-tions of 5-10 nm, but accumulate within the tumor tissue through the leaky vasculature [47]. This is significant because harmful side effects seen in traditional chemotherapy can be greatly reduced. Nanoparticles ranging from 10-100 nm in size are ideal for delivery to tumors. Being larger than 10 nm evades renal clearance, and under 100 nm avoids hepatic clearance [47]. The long circulation time is an important property to allow the particle time to accumulate within the tumor. Polyethylene glycol (PEG) on the surface of the particle helps to avoid the mononuclear phagocyte system and thereby prolong circulation. Size is also a major determining property to not only ensure extravasation, but to increase penetration into the tumor tissue.
FDA [47]. Liposomes include Doxil, Myocet, DaunoXome, Onco-TCS, and Marquibo. Myocet and Doxil are both liposome formulations of doxorubicin, however Doxil is PEGylated. DaunoXome is PEGylated daunorubicin. Examples of other approved nanoparticles include Abraxane- an albumin bound paclitaxel nanoparticle, Transdrug-a doxorubicin nTransdrug-anopTransdrug-article, Transdrug-and NTransdrug-anoxel- Transdrug-a pTransdrug-aclitTransdrug-axel nTransdrug-anopTransdrug-article. Despite the success of these formulations, the translation of nanomedicine into the clinical setting has been unexpectedly slow [51].
There are numerous factors that contribute to the limited clinical success of nanopar-ticles for cancer therapy. Although nanoparnanopar-ticles may be able to exit through the leaky vasculature of the tumor, there are still other barriers to delivery. The tumor microen-vironment is composed of a matrix of collagen fibers, proteoglycans and glycosamino-glycans, which can hinder nanoparticles from reaching tumor cells [51]. Nanoparticles must travel through this matrix and enter into tumor cells must occur for chemother-apeutics to have their full therapeutic effect.
Scientists have also observed an overestimation of the EPR effect in murine models compared to human tumors. Rapidly growing tumors, such as subcutaneous tumor in mice, produce large quantities of VEGF and other mediators which enhance perme-ability effects [51; 52]. Heterogeneity within tumors and tumor types has also been observed. Tumor location and host environment can also impact permeability. For example, glioma tumors grown subcutaneously are more leaky than orthotopic tumors [38].
1.3 Scope
Combining ultrasound and microbubbles with nanoparticles has the potential to overcome the limitations of current therapy practice for cancer, as well as many other conditions. While the field of ultrasound mediated drug delivery has been expanding, there are still many unknowns, and much room for improvement. This research aims to optimize ultrasound and microbubble parameters to improve targeted nanoparticle drug delivery. We hypothesize that improved chemotherapeutic delivery, with reduced systemic toxicity, can be achieved by utilizing ultrasound to concentrate and disrupt microbubble contrast agents at a target site in the presence of a nanoparticle drug. This dissertation will present research on a variety of nanoparticle formulations, both novel and commercially available, combined with the use of microbubbles and a variety of ultrasound systems ranging from piston transducers to clinical scanners.
This chapter has introduced the importance of microbubble contrast agents and nanoparticles. In Chapter 2, progress in the field of ultrasound mediated nanoparticle drug delivery will be discussed further.
In Chapter 3, the ability of ultrasound to enhance local nanoparticle delivery in vitrois explored. Acoustic parameters are optimized to enhance cellular internalization of molecules through sonoporation. Microbubble parameters are also investigated to achieve optimal internalization.
Chapter 4 will illustrate the combined effects of acoustic radiation force and mi-crobubble destruction for targeted delivery in vitro. An acoustically active delivery vehicle is created that is comprised of a microbubble coated in nanoparticles.
Chapter 5 demonstrates the potential of ultrasound as a therapeutic tool in vivo
Chapter 6 describes preliminary studies conducted using nanoparticle-loaded mi-crobubbles combined with acoustic radiation force and microbubble destruction. These studies are carried out using a clinical ultrasound scanner to deliver nanoparticles within tumors in preclinical cancer models.
In Chapter 7, pharmacokinetic analysis of nanoparticle drug delivery combined with therapeutic ultrasound in a mouse breast cancer model is explored. Liposomal doxoru-bicin treatment is compared to a co-injection of microbubbles and liposomal doxorudoxoru-bicin combined with focused ultrasound treatment.
Chapter 8 will summarize the work presented in this dissertation and discuss the limitations and challenges of ultrasound mediated drug delivery and the path towards clinical translation.
CHAPTER 2
Ultrasound Drug Delivery
2.1 Introduction
Ultrasound is being explored as a platform for enhancing therapeutic delivery. Stud-ies investigating gene and drug delivery aided by ultrasound are rapidly gaining popu-larity. A subset of the drug delivery field focuses on nanoparticle delivery. This chapter provides a more in depth explanation of the role of ultrasound and provides a review of this body of literature.
2.2 Ultrasound and Nanoparticles
In the field of therapeutic ultrasound with microbubbles, the most commonly used types of nanoparticles are quantum dots [53], liposomes [54; 55; 56; 57], and poly(lactic-coglycolic acid) (PLGA) nanoparticles [58; 59]. Quantum dots are often used in studies in place of nanoparticle drugs to characterize delivery vehicles and evaluate successful delivery into targeted tissue. Doxorubicin-containing liposomes have been used exten-sively in ultrasound and microbubble delivery studies (see Appendix A). One reason for their popularity in research studies is that several forms, known as Doxil or Caelyx,
c
DaunoXome, and Myocet, are already FDA approved for clinical use. Doxorubicin is also inherently fluorescent, which makes optical tracking of delivery feasible. Another form of liposome used with microbubble ultrasound delivery is the lipoplex, which is a liposome containing genetic material such as plasmid DNA [60; 61; 62]. This method protects the DNA during in vivo circulation and allows a greater amount of genetic material to be delivered [60; 61].
2.2.1 Mechanisms of Delivery
Pore formation can be either transient (reversible) or permanent. Transient pore formation has been observedin vitro, wherein pores remained open for seconds to hours. In some instances, pore openings have been reported up to 24 h after ultrasound ex-posure [72]. Permanent pore formation is undesirable in most applications, because it leads to cell death. Consequently, care must be taken in selecting appropriate acoustic conditions because cell death can occur with sufficiently high or long ultrasound ex-posure [67; 68; 73]. For example, Deng et al. observed an increased transmembrane current in cells subjected to both ultrasound and the presence of microbubbles indicat-ing increased membrane porosity [74]. Cells recovered to restindicat-ing levels in about 4 to 10 s following insonation for approximately 1 s at 1 MHz and 1 MPa pressure, but higher ultrasound intensities (>1 MPa) for durations longer than 0.5 s resulted in irreversible cell damage and cell death. In general, reagent delivery increases with increasing acous-tic pressure, but so too does the likelihood of cell apoptosis [73; 74; 75; 76; 77].
play a role in cell permeability [79]. With respect to vessel permeability, effects can range from mild reversible permeability enhancement to gross vessel rupture, depend-ing on the microbubble and acoustic parameters [81; 82; 83; 84; 85]. Results from many groups have suggested that large molecules (such as dextrans), as well as nanoparticles, enter into the interstitial space after sonication with microbubbles [86; 87; 88; 89]. This vascular permeability is expected to be a result of the interaction between microbubbles and vessel walls. Caskeyet al. studied the effects of insonated microbubbles withinex vivo vessels and observed both asymmetric collapse and jet formation near the vessel wall [90]. Chen et al. also studied microbubbles within ex vivo vessels and observed that jet formation occurs away from the vessel wall [91; 92; 93].
Acoustic radiation force also enhances nanoparticle delivery. Radiation force, ex-plained in Chapter 1, refers to the ability to push an object, such as a microbubble, within an ultrasound field. When nanoparticles are attached to the microbubble, the lo-cal concentration of nanoparticles can be increased by pushing the microbubbles against the vessel wall in one location [23; 28; 94]. This phenomenon has been shown to aid in delivery of nanoparticles when microbubbles are used [54; 95; 96; 97].
2.2.2 Types of Administration
attached to the microbubble before injection and ultrasound treatment. There are numerous ways to associate the nanoparticle with the microbubble. One of the most common methods to attach a nanoparticle to the microbubble is with the use of biotin avidin interactions.
Biotinylated microbubbles are used to attach either avidin or streptavidin nanopar-ticles, or in some cases an avidin linker is used to link biotinylated particles [54; 57]. Although biotin avidin linkage is suitable for proof of concept studies, it is not ideal for
in vivo use because it can induce an immunogenic response [54; 99]. An alternative to this method is to use maleimidethiol chemistry. Maleimide conjugation is often used in molecular imaging studies to create targeted microbubbles and can also be applied to nanoparticle attachment to the shell of the microbubble [56]. Another covalent binding possibility was illustrated by Burke et al., in which PLGA nanoparticles were coupled to albumin microbubbles through carbodiimide chemistry [58]. Oligonucleotides have also been employed as tethers to link vesicles to microbubbles through hybridization of complementary lipid-linked DNA oligonucleotides [100].
are small enough to extravasate from the vasculature of the tumor.
There are some definite advantages to linking the nanoparticle to the microbubbles. Along with being able to track the nanoparticle in circulation by ultrasound imaging of the microbubble carriers, attaching the nanoparticle ensures that they are present at the target site during insonation. Using ultrasound to rupture the microbubble at a desired location leads to targeted deposition of particles. As discussed previously, linking the nanoparticle to the microbubble also allows for radiation force to be used to increase particle/drug concentration at the desired site. Lum et al. and Kheirolo-moom et al. demonstrated higher delivery of nanoparticles in vitro using radiation force in combination with microbubble-loaded nanoparticle constructs compared with without using radiation force [95; 54]. Linking nanoparticles to microbubbles is also advantageous because it prevents dilution of the nanoparticle solution when it enters the bloodstream [58]. Finally, microbubbles loaded with certain nanoparticles may serve as multi-modality contrast agents for platforms such as dual MRI-ultrasound and optical-ultrasound [105; 106; 107].
There are also some challenges related to associating the nanoparticle to the shell. When linking through a process such as biotin and avidin, multiple washing steps are necessary to remove free linking agent. This can be both time consuming and detrimental to the fragile bubble preparation, requiring a higher initial concentration of microbubbles. Furthermore, excess nanoparticles are typically required to maximize loading. Finally, attaching the nanoparticle to the microbubble may alter the in vivo
circulation time and biodistribution.
2.3 Ultrasound Setups
arbitrary waveform generators and amplifiers, whereas others use commercial therapy systems or even clinical imaging systems (see Appendix A). In [108], Seipet al. describe ideal qualities of a therapy system, including the ability to both image and treat a desired location to monitor delivery and release of the agent. The system should be able to generate intensities and pulse sequences needed for microbubble delivery, deliver focused energy deep within tissue to target a specific area, treat in an acceptable amount of time, be incorporated into current treatment workflow, and be easy to use and set up. Most therapeutic treatments involve ultrasound with a center frequency of around 1 MHz, which is much lower than clinical imaging systems typically provide. Although some custom systems have been created, dual imaging and treatment often requires multiple transducers to be used in conjunction with one another [109]. Nanoparticle delivery has been performed with both focused and unfocused transducers, as well as at varying pressures up to 7 MPa.
2.4 Review of Successful Nanoparticle Delivery Studies
Some of the first nanoparticle delivery studies were performed in vivo with fluo-rescent nano/microspheres (100 to 500 nm) delivered to rat skeletal muscle [86; 110]. In these studies, vessel rupture caused by microbubble breaking was observed and the particles were delivered into the intersitium of the muscle. Extravasation points were observed where particles and red blood cells leaked out of the vasculature. Findings also illustrated the importance of allowing microbubbles to replenish in between ultrasound pulses and quick (10 s) injection of particles to increase deposition. Delivery of fluores-cent nanospheres (30 to 120 nm) to cardiac muscle was later shown by Vancraeynest
et al. [87].
factor-2 [111]. Initial studies depicted 40-fold and 670-fold increases in nanoparticle de-livery to the mouse adductor muscle when ultrasound or ultrasound and microbubbles were applied compared with nanoparticles alone. Subsequently, drug- loaded nanopar-ticles were delivered into the ischemic hind limb of the mouse with the addition of ultrasound and microbubbles. Results of the studies showed an increase in total num-ber of large and moderate diameter arterioles, as well as marked luminal expansion of pre-existing collateral arteries and transverse arterioles. Although the growth factor did not induce angiogenesis in gracilis muscles, arteriogenic remodeling was seen along with an increase in arteriole-line intersections.
Liposomal-loaded microbubbles have also proven to be advantageous for drug de-livery. As mentioned in an earlier section, Doxil, and other doxorubicin-containing liposomes are commonly used in ultrasound and microbubble delivery studies. When doxorubicin-containing liposomes were bound to microbubbles and delivered to melanoma cells in an Opticell, significantly higher cytotoxicity was seen [114]. Additional find-ings indicated that enhanced delivery was caused by both release of doxorubicin from liposomes and sonoporation caused by the microbubbles. The released free doxorubicin enters into the cell more efficiently than the liposome-contained doxorubicin. Studies carried out with self-assembling liposome-loaded microbubbles revealed a lower dose of doxorubicin could be used when the liposomes were bound compared with free lipo-somes [56].
Recently, enhanced in vivo delivery of liposomal doxorubicin has also been ob-served. After several studies with lipid-coated quantum dots delivered in mice, studies were carried out with Doxil and microbubbles with ultrasound exposure [115]. The concentration of Doxil in tumor tissue over time, the impact on tumor size on various treatments, and dose were investigated. Using focused ultrasound, more Doxil was delivered when microbubbles were administered, and colorectal adenocarcinoma tumor growth in mice was hindered. At 24 h after treatment, more drug was concentrated within the tumor compared with treatments of Doxil alone, however, the concentra-tions of both treatments were similar by 48 h. It was also observed that smaller tumors responded better to treatment than larger tumors at 5 mg/kg. Larger tumors required a higher treatment dose of 10 mg/kg. Tumor histology revealed extravasation of fluo-rescent Doxil.
tissues. Initial studies revealed significantly higher concentration of doxorubicin within the periphery of the tumor following ultrasound treatment compared with no insonation [104]. In later work, significant differences in tumor growth were also observed between mice treated with drug-loaded microbubbles and ultrasound compared with free drug at 14 days [116]. Paclitaxel-loaded polymer microbubbles are also being developed which can hold up to 20 times as much drug as doxorubicin-loaded microbubbles [102].
Nanoparticle drug delivery has also recently been applied to fields outside of chemother-apy [117]. Microbubbles loaded with rapamycin-coated magnetic ion nanoparticles are being investigated as a treatment option for ischemic coronary heart disease. Using magnetic stents, the nanoparticle-loaded microbubbles are targeted to the desired lo-cation, and then the drug is released when the microbubbles are ruptured using ul-trasound. In vitro studies have shown cell growth inhibition with rapamycin-loaded nanoparticles, whereas testing of the magnetic stents confirms microbubble accumu-lation at the stent. Increasing the flow conditions lead to an increase in nanoparticle deposition.
2.5 Summary
CHAPTER 3
Ultrasound and Microbubble Parameters for Maximizing Sonoporation
3.1 Introduction
Ultrasound mediated drug delivery can utilize various ultrasound techniques to achieve enhanced delivery. Combining acoustic radiation force with microbubbles de-struction has the potential to increase concentrations of therapeutics at the target site when the therapeutic load is combined with the microbubble [26; 95; 96]. This method uses radiation force to translate microbubbles to the targeted vessel walls followed by destruction of the microbubbles close to the cells creates desirable bioeffects which enhance delivery, such as pore formation.
Although increased permeability has been observed by many researchers, the mecha-nisms behind sonoporation are not yet fully understood and are still being investigated. Evidence would suggest, however, that microbubble cavitation plays an important role in sonoporation. Both stable and inertial cavitation can result in pore formation [26; 1]. In stable cavitation, the microbubble gently oscillates, whereas in inertial cavitation the microbubble violently collapses. Possible mechanisms leading to pore formation are mi-crojets, streaming, and shear force [69; 70; 118]. In addition, changes in calcium levels, cell signaling pathways and endocytosis have also been observed [65; 78; 119].
settings can affect delivery into cells. Frequency, duty cycle, and pressure are three fac-tors which have been shown to impact sonoporation [65; 120; 121; 122; 73; 123; 124]. Microbubble composition is another important factor to consider when optimizing de-livery. Microbubbles can be made with various shell and gas core components, and the size can be altered through a number of techniques including centrifugation and microfluidics [6]. The effect of microbubble size has been shown in imaging studies as well as blood brain barrier delivery studies [83; 24]. Larger microbubbles lead to greater contrast in images and also demonstrate better efficiency at disrupting the blood brain barrier. Too many microbubbles can cause a shadowing effect due to signal attenuation, whereas too few microbubbles may not provide enough contrast to see the desired area. Similarly, microbubble concentration may also play a role in efficacy of sonoporation [125; 126; 127].
3.2 Materials and Methods
3.2.1 Cell Culture
A549 human non-small lung cancer cells were purchased from ATCC (CCL-185). The cells were cultured in Dulbecco’s Modified Eagle’s Medium (DMEM) with 4.5 g/L glucose supplemented with 10% fetal bovine serum and 1% antibiotic media at 5% CO2,
37◦C. Cell monolayers were cultured on acoustically transparent Thermanox coverslips (Nunc, Thermo Fisher Scientific) until nearly confluent. Studies involving the effects of cell density were performed by seeding coverslips at low cell density and selecting them for use once cells reached the desired confluency. Cell confluency studies were performed on days 1-5 after seeding on coverslips.
3.2.2 Microbubble Preparation
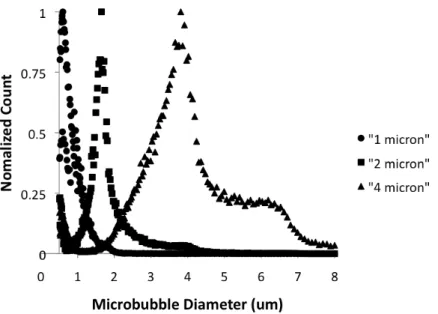
Figure 3.1: Microbubble size distributions re obtained using an Accusizer 780A device. Microbubbles (circles) with a mean diameter of 0.79µm, were used in all experiments unless otherwise stated and are referred to as the 1µm microbubble population. Larger microbubbles around 2µm (squares) and 4 µm (triangles), mean diameters of 1.6 and 3.6 µm, respectively, were used to study the effects of mic size on sonoporation.
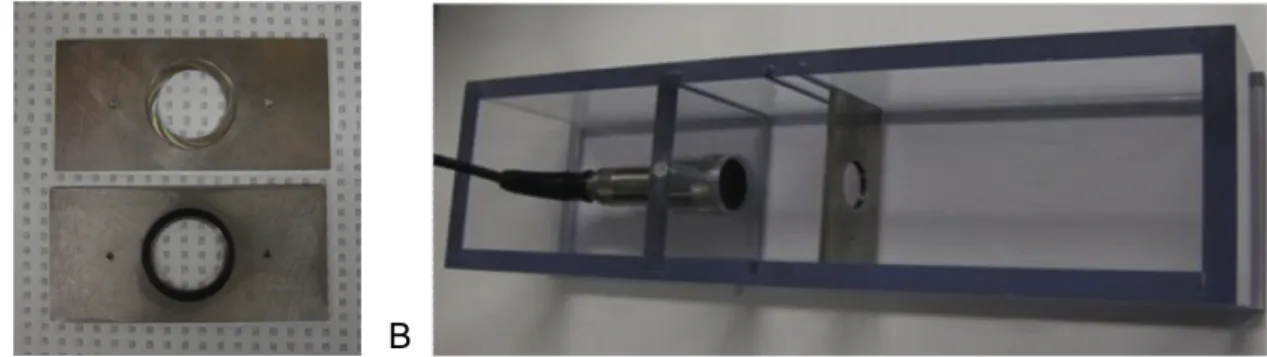
3.2.3 Sonoporation Setup
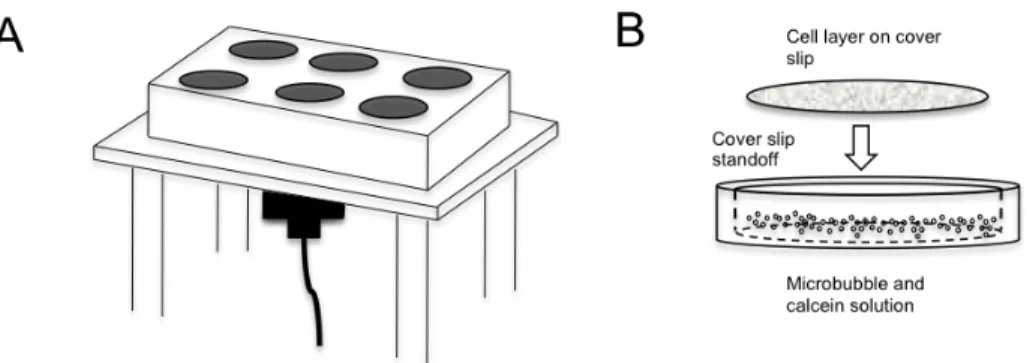
Figure 3.2: (A) The in vitro setup consisted of a 1 MHz transducer positioned under-neath a six well plate with soft membrane bottom. (B) A standoff was positioned inside the well to hold the cell coated coverslip above the microbubble-calcein solution.
The transducer was excited with 5-cycle sinusoidal pulses from an arbitrary wave-form generator (AWG2021 Tektronix, Beaverton, OR) and a 55 dB RF amplifier (3200L, ENI, Rochester, NY). An additional arbitrary waveform generator (33120A, Hewlett Packard, Palo Alto, CA) was used to control the pulse repetition frequency (PRF). Pressure values were measured with a needle hydrophone positioned 8 mm from the face of the transducer in a water bath.
Ultrasound parameters tested included incubation time, pulse repetition frequency, pressure, and number of repeated exposures. Table 3.1 and Table 3.2 display the pa-rameters studied. Unless otherwise indicated, setting used were 10 minute incubation, PRF of 150 kHz, and 300 kPa. Microbubble distributions with 2 and 4 µm diameters were tested and concentrations between 6 x10⁶ and 1x1010 MB/mL were also studied.
Table 3.1: Summary of acoustic parameters investigated
Incubation 1 min 5 min 10 min 15 min
PRF 0.15 Hz 1.5 Hz 15 Hz 150 Hz
Pressure 150 kPa 310 kPa 850 kPa 1200 kPa
Repetitions 1 2 3
Table 3.2: Summary of microbubble parameters investigated
MB Concentration 1x1010 MB/mL 2.5x108 MB/mL 6x106 MB/mL
MB Size 1 µm 2 µm 4µm
3.2.4 Image Analysis
Both bright field and fluorescent micrographs of the coverslip were acquired with a fluorescent microscope (Olympus BX51). Multiple images were acquired for each coverslip. Fluorescent images were acquired and compared by summing the pixels within areas of intensities above the noise threshold using Metamorph Basic (Molecular Devices, Sunnyvale, CA). The pixel counts for each image acquired were averaged to obtain a quantitative value for fluorescence for each coverslip. Once individual averages were obtained, coverslips for each parameter were averaged and normalized to the baseline setting. Analysis of cell confluency studies was carried out with an in house MATLAB script developed to segment cell borders and calculate cell count and area covered per coverslip. A mask was created to only measure fluorescence in areas where cells were present.
3.2.5 Statistical Analysis
3.3 Results and Discussion
Finding the optimal ultrasound parameters forin vitro delivery using microbubbles is an important step to improving drug delivery techniques. Although there are ad-ditional challenges that will need to be overcome for in vivo studies, demonstrating successful in vitro delivery provides promise for future work. Calcein was used as a fluorescent drug marker because it does not enter into cells under normal conditions and is easily detectable within cells. Other groups have also demonstrated that calcein is an appropriate permeability tracer [125; 130; 131].
Incubation time was observed to result in greater sonoporation after 10 minutes of incubation than 1 and 5 minutes, but was not statistically significant (Fig. 3.3B). As with PRF, high variability was seen in the data. Incubation time was studied to determine whether longer incubation times would lead to greater uptake through sono-poration as microbubbles float into contact with the cells on the coverslip. Although no statistically significant differences were seen, a longer incubation time of 10 min was used since it has been shown that greater sonoporation effects occur when the microbubble is in close proximity to the cell [133]. In reviewing similar studies, some groups allow flotation time while other group immediately expose the cells to ultra-sound after the addition of microbubbles. This is one example of the variations in experimental design that need to be studied more in depth in future work.
Calcein internalization also increased with repeated exposures of the cells to mi-crobubbles and ultrasound (Fig. 3.3D). After undergoing 10 minutes of incubation with calcein and microbubbles followed by 3 minutes of ultrasound, the cell coated coverslip was transferred to a new well and incubation and insonation was repeated either one or two more times. Uptake was increased almost fourfold by increasing ul-trasound and microbubbles exposure from 1 to 3 repetitions. Both 2 and 3 repetitions were statistically significant from only 1 exposure cycle (p<0.05), although they were not statistically different from each other. Repeating the ultrasound exposure with calcein and microbubbles two or three times increased cellular uptake compared to a single exposure. Adding fresh microbubbles to the well was performed to simulate flowing microbubblesin vivo. During anin vivoexperiment targeted vasculature would continually be exposed to microbubbles. Although repeated exposures resulted in an increase in cell uptake, it is not as practical a solution for current setup due to the extra handling of the coverslips leading to higher chances of damaging the cells. A modified experimental setup involving a flow chamber, such as one used by Chenet al., would not have the same limitation and may be able to achieve a similar effect while more accurately representing thein vivo environment, however acoustic radiation force would need to be applied to push microbubbles next to the cells since the flotation aspect is removed [135].
seen regardless of the area of coverslip coated by cells. At the baseline settings, roughly 15% of cell area showed uptake of calcein regardless of the confluency of the coverslip.
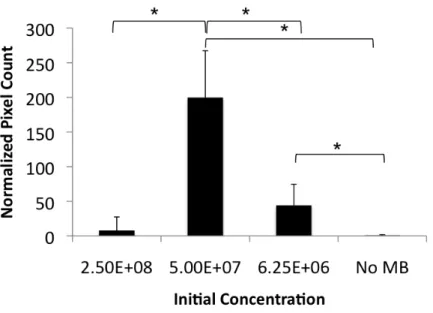
Figure 3.4: (A) Three concentrations of 1µm microbubbles were tested at the baseline ultrasound settings. Reducing the concentration from the initial stock concentration produced significantly higher amounts of calcein uptake within the cells (N=7). (B) Two larger microbubble populations, 2 µm and 4 µm were tested at the optimal 1µm concentration. The 4 µm microbubbles did not result in calcein uptake (N=6). Mean and standard deviation of normalized pixel count above baseline are plotted; *p<0.05
used. Large bubble cluster formation was also reported by Meijeringet al. [65]. Unlike with the ultrasound parameters, current findings on concentration dependence are not in agreement with work published by Rahimet al., who believed concentration was not a critical factor and did not see significant changes when changing the concentration [124]. Studies presented here used a higher concentration of microbubbles and had the transducer placed below the cells, requiring the ultrasound to penetrate through the microbubble layer at the cell surface. Positioning the transducer below the microbubble and cell layer simulates anin vivo environment where the radiation force would be used to push the microbubbles out of flow before microbubble destruction. The cell suspen-sion setup used by Karshafian et al. also required the ultrasound waves to penetrate through the solution of microbubbles and cells [126]. Effects of microbubble attenu-ation in vivo have been seen in imaging studies, and results presented here suggest attenuation resulting from high concentrations could be critical for therapeutic studies [136]. Other concentration studies see an increase and then plateau [124; 125]. It is hypothesized that this different behavior can be attributed to differences in ultrasound parameters used such as longer pulse length and higher duty cycle, along with trans-ducer placement as mentioned above. Additionally, although the aim is to investigate concentration, it is possible that these studies did not explore a wide enough range in concentrations to observe the same increasing, then decreasing trend. Differences in reporting concentrations used such as volume added or percent volume cannot always be compared due to these differences in stock concentrations. Because stock concentra-tions of microbubbles vary from 1x10¹⁰ down to 1x10⁸, even using undiluted samples are not comparing the same volume.
Microbubbles can be produced in a range of sizes, such as around 1 µm in diam-eter for Definity (Lantheus Medical Imaging North Billerica, MA, USA), to around 2
including our own, also have developed methods to size isolate larger microbubbles [24; 129]. Since not all microbubble solutions have the same size characteristics it is important to understand the impact of size on ultrasound mediated therapy. A clear dependence on both size and concentration for sonoporation was observed. When 1 and 2 µm microbubbles were tested at the same concentration, similar results were seen. However, with microbubbles closer to 4µm in diameter, cellular uptake was not observed (Fig. 3.4B). The 4 µm microbubbles were investigated further and a sim-ilar distribution in optimal concentrations was seen to the 1 µm microbubbles, only shifted to a lower concentration (Fig. 3.5). Lowering the concentration, however, led to calcein internalization. While other groups have examined the role of microbubble concentration and brand [125; 126; 137] this study takes a more in depth look at size by comparing microbubbles with the same composition and expanding the range of concentrations. Although Alter et al. compared Optison, Sonozoid, and SonoVue at various concentrations, the focus was on finding the agent that worked the best, not on studying the effect of size [137]. In addition, they concluded that size had little influence, which is not in agreement to current findings. Here, the larger microbubbles performed poorly compared to smaller bubbles at the same settings. A lower concen-tration was needed to enhance delivery into the cells. The effect of size has also be documented by Choi et al. with blood brain barrier studies, who also found that size does have an impact on delivery [83]. Future exploration on the optimal concentration based on microbubble size with varying frequency is needed to take into account the resonance frequency dependent response of microbubbles.
It has been pointed out here and by other groups that variations exist in in vitro
Figure 3.5: (A) 4µm microbubbles tested at the peak concentration for 1µm microbub-bles did not show the same enhanced sonoporation effect. At a lower concentration, calcein uptake was seen using the 4 µm microbubbles. Mean and standard deviation of normalized pixel count above baseline are plotted (N=6). *p<0.05
that eliminates the air interface by creating a sealed chamber submerged in a water bath. Additional future work will look more in depth at the relationship between size and concentration with respect to ultrasound frequency and pressure.
3.4 Conclusions
CHAPTER 4
Design of Acoustically Active Nanocapsule Delivery Vehicles for Ultrasound-Targeted Chemotherapy
4.1 Introduction
In the previous chapter, the roles of various acoustic and microbubble parameters in enhancing cellular permeability were examined. In this chapter, microbubble destruc-tion and microbubble transladestruc-tion by acoustic radiadestruc-tion force are combined. In addidestruc-tion, the first nanoparticle loaded microbubble used for this research is introduced.
By utilizing an acoustically-active delivery vehicle (AADV), which combines the acoustic activity of a microbubble with the high payload and extravasation ability of nanoparticles, the limitations of current chemotherapy delivery methodologies can be overcome. In this chapter the synthesis and characterization of AADVs and preliminary results of in vitro delivery to cells are described.
c
4.2 Materials and Methods
4.2.1 Materials
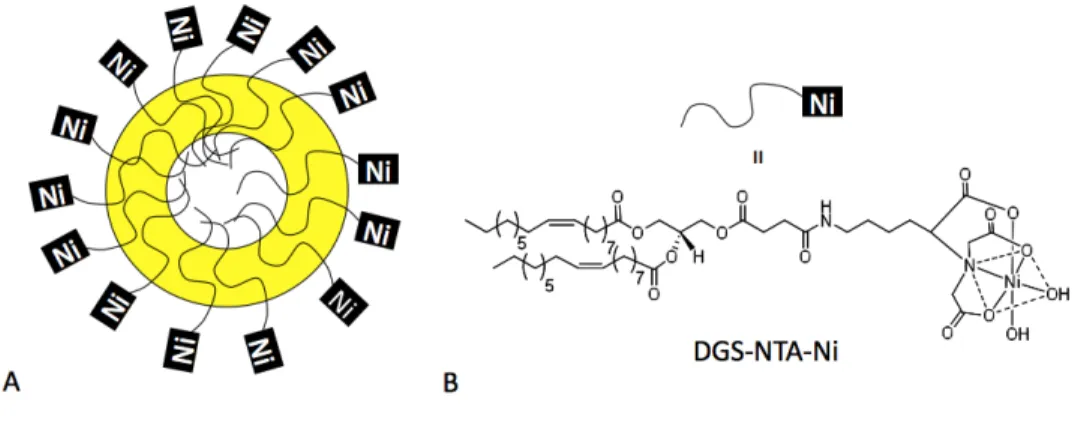
DSPC, DSPE-PEG2K, and DSPE-PEG2K-Biotin were purchased from Avanti Po-lar Lipids (Alabaster, AL). Additionally, 25-[N- [(7- nitro- 2- 1, 3- benzoxadiazol- 4 -yl) methyl]amino]-27- norcholesterol (25-NBD- cholesterol) and 1, 2 - dioleoyl- sn-glycero- 3 -[(N-(5- amino-1-carboxypentyl) iminodiacetic acid)succinyl] (nickel salt) (DGS-NTA(Ni)) in chloroform, were purchased from Avanti Polar Lipids. Inc. Strep-tavidin protein (His-tag) was purchased from Abcam (Cambridge, MA). Green Fluo-rescent Protein (His-tag) was purchased from Millipore (Billerica, MA).
4.2.2 Biotinylated Microbubble Preparation
Lipid solutions were formed using a 9:0.5:0.5 molar ratio of DSPC, DSPE-PEG2K, DSPE-PEG2K-Biotin in a 90 mL solution of phosphate-buffered saline (Fisher Scien-tific, Pittsburg, PA). Size isolated microbubbles were created using the method previ-ously described by Feshitan et al. and Streeter et al. [129; 24]. Briefly, using a sonic dismembrator (Model 500, Fisher Scientific, Hampton, NH) for 15 seconds at 70% power in the presence of decafluorobutane (SynQuest Labs, Alachua, FL), microbubbles were generated via acoustic emulsification and isolated with centrifugation. Concentrations and size distributions of the microbubbles were obtained using a laser light obscuration and scattering device (Accusizer 780A, Particle Sizing Systems, Santa Barbara, CA).
4.2.3 BTM Nanocapsule Preparation
then preheated deionized water was added to form the nanocapsules. The excess of DOGS-Ni-NTA was removed by a Sepharose CL-4B column and the nanocapsules were concentrated by rotary evaporator. The final GFP nanocapsule was formed by adding his-streptavidin and his-GFP into the concentrated nanocapsules.
Paclitaxel containing nanocapsules were made in a similar method. The behenoyl-paclitaxel conjugate was dissolved in ethanol and transferred to the vial containing the oil and surfactant mixture. Residual ethanol was evaporated under a stream of nitrogen gas, and then preheated deionized water was added to form the nanocapsules. The excess of DOGS-Ni- NTA was removed by a Sepharose CL-4B column and the nanocapsules were concentrated by rotary evaporator. The final behenoyl-paclitaxel nanocapsule containing his-streptavidin was formed by adding his-streptavidin into the concentrated nanocapsule suspension.
4.2.4 AADV Preparation
Acoustically-active delivery vehicles (AADVs) were created by incubating microbub-bles and nanocapsules within a syringe and mixing on a rotating stand. Free nanocap-sules were removed by either washing by flotation or centrifugation. Vehicles were examined using fluorescence microscopy or high performance liquid chromatography (HPLC) to assess binding. Control vehicles were made of fluorescent avidin polystyrene beads (Spherotech, Lake Forest, IL) conjugated to biotin microbubbles.
4.2.5 Cell Culture
Rodent mammary adenocarcinoma cells (R3230), maintained in DMEM medium (Sigma, St. Louis, MO) supplemented with 10% fetal bovine serum and 1% peni-cillin/streptomycin, were grown as a cell monolayer on Thermanox coverslips (Nalge Nunc, Rochester, NY). Thermanox coverslips were used because they are nearly acous-tically transparent.
4.2.6 In Vitro Delivery
A flow phantom setup was used to determine acoustic parameters required to both concentrate microbubble vehicles and to fragment the microbubble (Fig. 4.2). Both a water-immersion objective and a 2.25 MHz focused transducer (Olympus Panamet-rics, Waltham, MA) were mutually focused with each other and on a 200 µm tube. Microbubbles were pushed through the tube by a syringe pump. An arbitrary wave-form generator allowed pulse sequences of varying frequency and amplitude to excite the transducer. A high speed camera allowed the microbubbles to be visualized while being exposed to ultrasound.
Figure 4.2: A high speed camera and phantom setup with the microscope and trans-ducer mutually focused on a 200 µm tube allowed microbubbles to be visualized while being exposed to ultrasound.
plate in a water bath was used to test the ability of ultrasound to locally increase nanoparticle delivery. Cells cultured on a coverslip were exposed to an AADV solution and positioned in front of a focused 2.25 MHz focused transducer. The cells were exposed to ultrasound for three minutes then washed in PBS before being examined.
Table 4.1: Composition and physicochemical characteristics of BTM-Ni nanoparticles (Provided by Lei Peng and Saurabh Wadhwa)
Parameters BTMNi Nanoparticles
Brij 78/Vit E TPGS/M812 /DGS-NTA-Ni (mg/mL) 3.5/1.5/2.5/0.1
Particle size± S.D. 183.9 ±1.33
Polydispersity Index 0.026
Zeta potential ± S.D. -14.8 ± 11.3
Nickel content (ng/mg NP) 145.6± 19.53 Binding efficiency (Molar) (Ni:GFP) 1:12
GFP: Streptavidin (molar ratio) 1:1
4.2.7 Vehicle Drug Loading
Paclitaxel-loaded AADVs were analyzed to determine the amount of drug bound to the bubbles. Increasing amounts of microbubbles were added to a fixed volume of nanocapsules to obtain a loading curve. After a floatation wash was performed, the bottom PBS layer and top bubble layer were separated for analysis. The behenoyl-paclitaxel conjugate concentration in nanocapsule formulations was measured by HPLC with an Inertsil ODS-3 column. The mobile phase consisted of a solvent mixture of isopropyl alcohol, water and acetonitrile (35:5:60, v/v/v) at a flow rate of 1.0 mL/min. The retention time of behenoyl-paclitaxel was about 9.5 min.
4.3 Results and Discussion
Successful conjugation of GFP/Streptavidin labeled BTM nanocapsules onto the shell of biotinylated microbubbles was verified by fluorescence microscopy (BX51 Mi-croscope, Olympus, Center Valley, Pa) (Fig. 4.4). Modifications of the BTM nanocap-sules involving various fluorescent moieties including Cy3, bodipy, and Oregon green paclitaxel were also tested but could not be easily detected under the microscope.
Figure 4.4: (A) A cartoon illustration of proposed loading of nanocapsules onto the shell of the microbubble. (B) Confirmation of loading onto the bubble seen by fluorescence microscopy. 2010 IEEE.c
2.25 MHz focused transducer operated at 3.5 MHz, 50 kPa. Microbubble destruction occurred with a 5 pulse sequence at 1.5 MHz, 1.2 MPa with 0.1 second pause between each pulse. The final wavelength was a 3 second waveform operated at PRF of 150 mHz at a duty cycle of 30%.
the paclitaxel was recovered between the top bubble cake and bottom wash layer. It is possible that there was more bound paclitaxel than detected due to loss during the transferring process. Future work will include further drug load characterization of the AADVs followed byin vitro drug cell uptake studies.
4.4 Conclusions
Binding of nanocapsules to ultrasound microbubble contrast agents was achieved and the ability to increase delivery of nanocapsules using acoustic radiation force and microbubble destruction by ultrasound was demonstrated. Fourteen times as many particles were delivered to cells treated with ultrasound compared to untreated. Future work will include studies with paclitaxel-loaded nanocapsules used both in vitro and
CHAPTER 5
4T1 Tumor Treatment with Paclitaxel Nanocapsules and Microbubble Enhanced Ultrasound Delivery
5.1 Introduction
Nanoparticle based drug delivery is a rapidly growing field, especially in chemother-apy applications. Nanoparticulate formulations offer a promising alternative to con-ventional methods due to their size and high payload [142; 143; 47]. One reason for the success of this technique is the enhanced permeability and retention (EPR) effect. Nanoparticles can enter into the tumor through the leaky vasculature, thus delivering higher doses of drugs to tumor tissue with lower systemic toxicity. BTM paclitaxel nanocapsules (introduced in the previous chapter) are formed by oil and water mi-croemulsion methods and overcome the limitations of poor drug solubility. This formu-lation has previously been shown to be more effective at treating tumors in mice than intravenous injections of Taxol [140; 141]. However, accumulation within the tumor was still limited.
It is hypothesized that the addition of low intensity ultrasound and microbubbles to a nanoparticle chemotherapeutic treatment will improve the overall efficacy of the
c
treatment. Applying ultrasound at the tumor site may enhance nanoparticle drug uptake by increasing vascular permeability through ultrasound targeted microbubble destruction.
5.2 Materials and Methods
5.2.1 Materials
DSPC and DSPE-PEG2K were purchased from Avanti Polar Lipids (Alabaster, AL). Paclitaxel was obtained from ScinoPharm Taiwan Ltd. Polyoxyl 20-stearyl ether (Brij 78) was obtained from Uniqema (Wilmington, DE). Vitamin E TPGS was generously provided by Eastman Chemical Co. (Kingsport, TN). Behenoyl chloride was purchased from Sigma-Aldrich (St. Luis, MO).
5.2.2 Microbubble Preparation
A lipid mixture (DSPC and DSPE- PEG2K) was prepared using a 9:1 molar ra-tio, similar to a previously described method [128]. Briefly, lipids were dissolved in chloroform, dried and dissolved into a buffer solution of PBS. The lipid solution was then transferred into vials, which were then evacuated and filled with decafluorobutane gas. Vials were shaken with a Vialmix shaker (Bristol-Myers Squibb Medical Imaging, North Billerica, MA, USA) for 45 s prior to injection.
5.2.3 Nanocapsule Preparation
TPGS as the surfactants were accurately weighed out into a 7 mL glass vial. The vial was heated to 65◦C to melt the oil and surfactants while stirring. The C22-PX in ethanol stock solution was transferred to the vial containing the oil and surfactant mixture. Residual ethanol was evaporated under a stream of nitrogen gas, and then preheated deionized water was added to obtain a final volume of 1 mL. Oil-in-water microemulsions formed spontaneously at this elevated temperature and upon direct cooling of the warm microemulsions to room temperature, nanocapsules formulations were formed. To enhance circulation time, the Brij78PEG750 was synthesized and incorporated on the surface of the nanocapsules.
Figure 5.1: Chemical Structure of the paclitaxel conjugate used. Figure provided by Ping Ma.
5.2.4 Animal Preparation
Animals were handled according to National Institute of Health guidelines and our study protocol was approved by the UNC Institutional Animal Care and Use Com-mittee. Twenty four female BALB/c mice received a subcutaneous injection of 1x10⁸
5.2.5 Treatment
Mice were divided into three treatment groups. Group one received a 200 µL tail vein injection of C22-PX nanocapsules (NC). Group two received a 200 µL tail vein injection of C22- PX nanocapsules followed by ultrasound exposure (NC+US). Group three received a co-administration of 150 µL of C22- PX nanocapsules with 50 µL MB followed by ultrasound exposure (NC+MB+US). The paclitaxel dose for all animals was 2.5 mg/kg. After receiving the appropriate tail vein injection, animals were placed on a heating pad and anesthetized with inhaled isoflurane at 1.5% through a nose cone. Ultrasound gel was then applied between the tumor and the transducer. Therapeutic ultrasound was applied with a Sonicator 740 system (Mettler Electronics Corp.). The 1 MHz transducer was operated at 2 W/cm2 and 10% duty cycle (Fig. 5.2). Tumors were sonicated for two minutes. Treatments were given every other day for two weeks.
5.2.6 Analysis
Caliper measurements were taken every other day to measure the volume of the tumor. The tumor size was calculated as 1/2 x (width)2 x (length). Animal weight was also monitored.
After humanely sacrificing the mice, the tumors were removed and processed rou-tinely for histology. Specifically, tissues were processed into paraffin and 5µm sections were stained with hematoxylin and eosin using standard methods. The histology slides were scanned with an Olympus BX51 microscope and motorized 2-dimensional stage controlled by MetaMorph software (Molecular Devices, Sunnyvale, CA). The digital images were imported into ImageJ (NIH, Bethesda, MD). A color deconvolution algo-rithm was performed on each digital histological image to separate the hematoxylin and eosin [13]. An index was calculated by dividing the number of pixels that corresponded to hematoxylin by the sum of the pixels that corresponded to hematoxylin and eosin.
5.3 Results and Discussion
Although tumor growth was not halted by any of the treatments, mice treated with the combination of paclitaxel nanocapsules, microbubbles and ultrasound had slower tumor growth compared to nanocapsules alone and nanocapsules with the addition of ultrasound (Fig. 5.3). On days two, four, six, eight and twelve, there were signifi-cant differences between average tumor volume between tumors treated nanocapsules and ultrasound compared to nanocapsules, ultrasound and microbubbles (p<0.05). On days six and ten, significant differences were seen between average tumor volume of mice treated with nanocapsules only compared to nanocapsules, ultrasound and mi-crobubbles (p<0.05). At the end of the two week treatment schedule, average volume between all groups were not statistically different.
Figure 5.3: Mice bearing 4T1 tumors were treated with either NC (N=8), NC and US (N=8), or NC, MB, and US (N=6). Mice treated with nanocapsules, microbubbles and ultrasound had the slowest tumor growth rates. Treatments days are marked by red arrows; The treatment dose was 2.5 mg/kg of C22-PX nanocapsules. *Significant dif-ference (p<0.05) between NC+US and NC+MB+US **Significant difference (p<0.05) between NC and NC+MB+US. c 2011 IEEE
treatment groups (Fig. 5.5). Tumors were also harvested from animals that did not receive any treatment.
Figure 5.4: Mice bearing 4T1 tumors were treated with either NC, NC and US, or NC, MB, and US treated at 2.5 mg/kg were compared with data from unpublished work by Ping Ma. Data was normalized to tumor starting volume. Mice treated with nanocap-sules, microbubbles and ultrasound had the slowest tumor growth rates. Treatments days are marked by red arrows. *Significant difference (p<0.05) between NC+US and NC+MB+US **Significant difference (p<0.05) between NC and NC+MB+US.c 2011 IEEE
Figure 5.5: Mice were sacrificed after 14 days and tumors were harvested, sectioned and stained using hematoxylin and eosin. Examples of tumor sections showing necrosis in all treatment groups are shown.
5.4 Conclusions
CHAPTER 6
In Vivo Targeted Nanoparticle Delivery to Tumors with Acoustic Radiation Force
6.1 Introduction
In this chapter, a fluorescent AADV is used to investigate the ability of a clinical ul-trasound scanner to enhancein vivo delivery of nanoparticles to tumors. As explained in previous chapters, attaching nanoparticles onto the lipid shell of a microbubble al-lows for both acoustic radiation force (ARF) and microbubble destruction to be used to increase nanoparticle delivery. In chapter 4, enhanced delivery of fluorescent nanopar-ticles to a cell layer was observed. Other groups have also demonstrated improved delivery either to cells or tumor tissues by using a nanoparticle loaded microbubble [145; 121; 113; 61; 95; 54]. An additional benefit of attaching the nanoparticle to the shell is that the AADV becomes a theranostic agent since the microbubble can be de-tected using ultrasound imaging techniques while the nanoparticle component delivers the drug payload. Localized delivery can be monitored using ultrasound to confirm the nanoparticle is reaching the tumor site.
While in vivo delivery using bound nanoparticles has been shown by other groups, low frequency piston transducers and focused transducers that do no allow imaging of the tissue have been used [121; 145]. In this work, using methods developed by Gessner