Access to Community Resources in Disadvantaged Areas and its Impact on Hospital Readmission in Cardiovascular Disease Patients
By
Maria Isabel Jimenez
A Master’s Paper submitted to the faculty at the University of North Carolina at Chapel Hill
in partial fulfillment of the requirements for the degree of Master of Public Health in
the Public Health Leadership Program
Chapel Hill Fall 2015
_____________________________ __
_____________________________ __
Date
_____________________________ __
_____________________________ __
ABSTRACT
Community Resources and Hospital Readmission
Background: Cardiovascular disease (CVD) is one of the conditions that contribute most
to the number of patient readmissions in the United States. Hospital and patient
characteristics influence rehospitalization; in addition to major risk factors such as high blood pressure or high cholesterol, other factors such as age, ethnicity and socioeconomic status are associated with hospital readmission for CVD patients.
Objective: The purpose of this study is to examine whether differences in
community-level resources in disadvantaged neighborhoods is associated with 30-day hospital readmissions in patients with CVD.
Design: Retrospective cohort study.
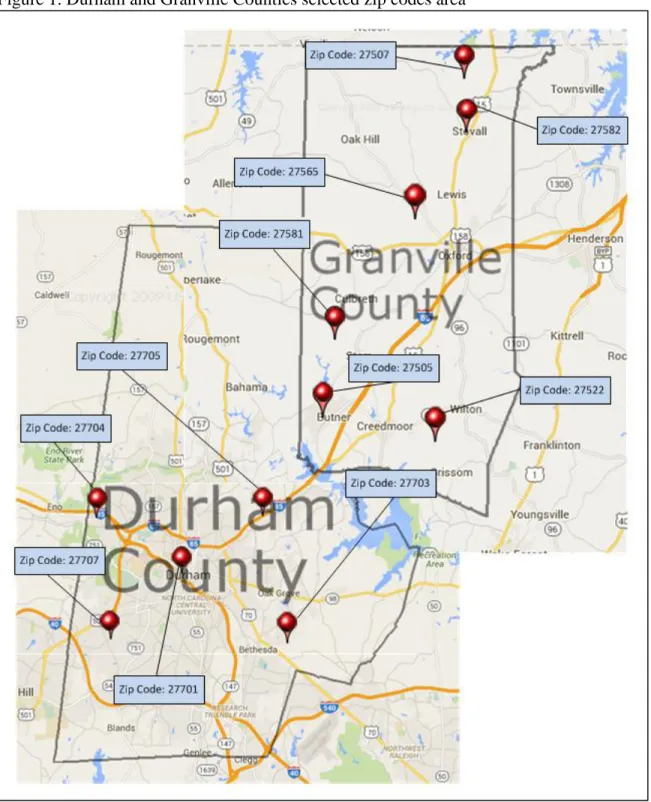
Setting: Durham County and Granville County in the state of North Carolina.
Patients: Patients from Durham County and Granville County admitted for CVD to Duke
University Hospital and Durham Regional Hospital, from January 1, 2005 to January 1, 2015 (n = 1,033).
Results: Overall, there was no significant bivariate difference of 30 day readmission for
readmission when area-level factors are held constant suggest that patients from Granville county are significantly more likely to be readmitted than patients from Durham county (OR=1.28; 95% CI, 1.15-1.43).
Conclusions: This study suggests that living in the proximity to community resources
play an important role in patients’ health and affects readmission within 30-days of initial discharge.
Keywords:
TABLE OF CONTENTS
Abstract ……… 2
Background ………... 7
Cardiovascular Disease ……… 7
Hospital Readmissions in Cardiovascular Patients ……….. 8
Socioeconomic Deprivation ……….... 9
Description of the hypothesis being tested ... 11
Methods ... 11
Study Population and Data Sources ... 11
Analysis ... 14
Results ... 15
Discussion ... 17
Conclusion ... 22
LIST OF ABBREVIATIONS
ACC American College of Cardiology ACS American Community Survey AHA The American Heart Association BMI Body Mass Index
CI Confidence Interval CVD Cardiovascular Disease
DEDUCE Duke Enterprise Data Unified Content Explorer DRG Diagnosis Related Group
DRH Duke Regional Hospital DUH Duke University Hospital
HRSA Health Resources Services Administration
ICD-9 International Classification of Diseases 9th edition IRB Institutional Review Board
MedPAC Medicare Payment Advisory Commission MRN Medical Record Number
NC North Carolina
OMB Office of Management and Budget’s
OR Odd’s Ratio
LIST OF TABLES AND FIGURES
Table 1 Durham and Granville Counties by Economic Indicators and Zip Code Table 2 Durham and Granville Counties Health Care Resources within 10 miles of
Zip Code
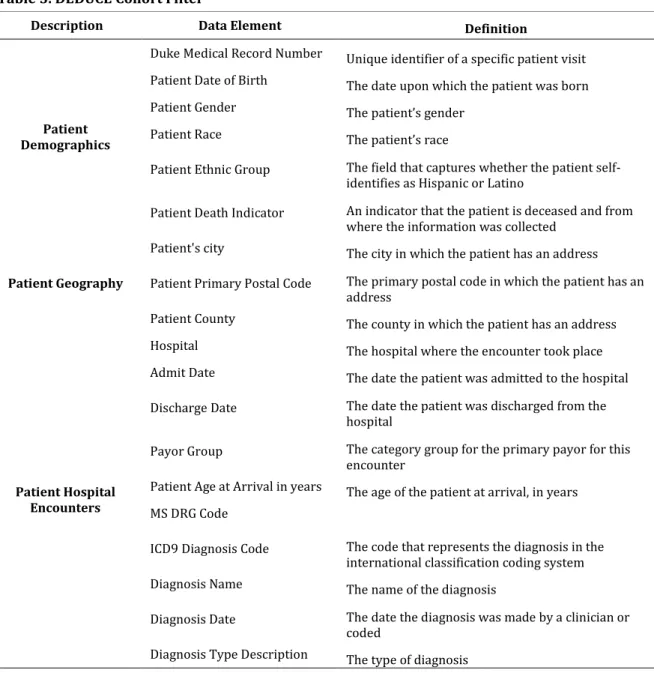
Table 3 DEDUCE Cohort Filter
Table 4 Durham and Granville Counties CVD Patients Individual and Area Level Characteristics
Table 5 Analysis for factors associated with cardiovascular disease patients, 30-day readmission in Durham and Granville Counties
Background
Cardiovascular Disease
Cardiovascular disease (CVD) is among the leading causes of disability and death in the United States.1,2 Cardiovascular diseases affect the heart and blood vessels, and include: coronary heart disease, congestive heart failure, cerebrovascular disease, peripheral arterial disease, rheumatic heart disease, congenital heart disease, deep vein thrombosis, and pulmonary embolisms, among others.1 More than 2 million elderly people in the United States are estimated to have heart failure; in addition, about 400,000 people will be newly diagnosed with the condition every year.3Cardiovascular-related illnesses are responsible for approximately 17% of U.S. national health care costs.2 Direct costs of CVD are projected to increase from $272.5 billion on 2010 to $818.1 billion in 2030 the United States.2 Indirect costs are projected to increase from 171.1 billion in 2010 to 275.8 billion in 2030 in the United States.2
In the last 10 years appropriate interventions that target risk factors have proven to be an effective way to prevent CVD4. The American Heart Association (AHA) and the American College of Cardiology (ACC) classifies the risk factors into major independent risk factors and other factors, the major independent risk factors are those that can
produce CVD if left untreated, smoking, high blood pressure, elevated serum total (and LDL) cholesterol, low serum HDL cholesterol, diabetes, and advancing age.4 Other factors are those that influence the independent risk factors causing a negative effect, first are the conditional risk factors, or predisposing factors such as elevated serum
predict risk is the Framingham risk score, the first estimation system and most used method, estimates 10 year risk for CVD in asymptomatic patients5 using a mathematical model and multivariable risk formulations to predict CVD risk, 6 the goal is to identify risk more precisely and determine the intensity of preventive measures.4 it is also noted that when combined risk factors can put an individual at a higher risk of developing CVD, for example a patient with family history of early CVD, with an elevated body mass index (BMI) and with a sedentary lifestyle has a higher risk of developing CVD if there are no interventions. 5 In the United States about half of the population has one the three major risks for developing CVD, high blood pressure, high cholesterol or smoke, men and women are at equal risk of developing CVD in their lifetime, in addition CVD is the leading cause of death for white and black non-Hispanics and the second leading cause of death for Hispanics in the United States.7
Hospital Readmissions in Cardiovascular Patients
Cardiovascular disease, as noted by Jweinatt (2010), has been identified as one of the conditions that contribute most to the number of patient readmissions in the United States. Among cardiovascular conditions, heart failure is the leading cause of
an indicator of quality of care.11,12 The Medicare Payment Advisory Commission
(MedPAC) reported that the cost for rehospitalizations that could have been prevented is $12 billion per year.13
Although improvement in early diagnosis, treatments, and health outcomes continue, readmission rates continue to be high. Two key policies have brought the issue of hospital readmission to national attention, first in 2009 the US Center for Medicare and Medicaid Services started to report to the public all-cause readmission rates following hospitalization for heart failure, then in 2010 the Patient Protection and
Affordable Care Act set financial penalties for hospitals that had the highest readmission rates within the first 30 days after discharge.8
These policies are important because they shift the paradigm, holding hospitals accountable for patient’s health outcomes after discharge,14 but most importantly, it focuses attention on the importance of understanding the causes for hospital readmission to be able to create interventions that can modify these factors.
Socioeconomic Deprivation
Risks for hospital readmission after discharge largely depend on a constellation of hospital and patient characteristics. Patient characteristics have been identified by
preventable readmissions for heart failure were associated with SES and PDE factors such as lack of follow up and social support.16 Furthermore studies have linked high rates of hospitalization and readmission to patients with heart failure who lack employment, have low income, and live in disadvantaged areas.17
For the purposes of this study the focus is on how area resources are associated with hospital readmission for CVD patients. The concept is already used for predicting CVD.5 First, the Framingham score a useful method to predict CVD on diverse
populations6 and effective tool to identify and communicate risk to individual patients; 5 studies have shown however that the Framingham risk score underestimates
socioeconomic deprivation as a risk factor.25 Consequently, newer risk estimation systems include social deprivation as risk factors. For example, ASSIGN, designed to estimate CVD risk in Scotland, includes additional information such as family history and social deprivation, where measures of social deprivation are linked to postal codes in Scotland giving this system the ability to locate the risk by geographic area. QRISK is another measurement system that pulls data from general data bases and also includes social deprivation as an area measure.18
Area resources as risk factors for readmission are not easy to identify because they are not risks that are assigned to patients when admitted to the hospital. In addition, socioeconomic factors are not recorded in patients’ medical records nor used as a
that socioeconomic factors affect patient compliance with medication plans, adherence, follow up and self-monitoring as cited by Desai and Stevenson.8
Area resources can be used to study patient risk for readmission by linking the patient address to Census data of that particular area.20
Description of the hypothesis being tested
The purpose of this retrospective study is to examine whether differences in community-level resources in disadvantaged areas is associated with hospital readmissions in patients with CVD. The study analyzes the association between two disadvantage areas in North Carolina in relation to 30 day hospital readmissions for patients admitted for a CVD-related diagnosis.
Methods
Study Population and Data Sources
North Carolina that do not have a big urban area, the counties selected were: Alamance, Granville, Randolph, Johnston, Nash, Warren, Person and Vance. Data was collected for these counties using the American Fact Finder tool from the US Census Bureau
(http://factfinder.census.gov/faces/nav/jsf/pages/index.xhtml). The statistics collected for each county were: population count, number of people 65 years and older, percent of white people, percent of African Americans, percent of Hispanic, median household income, percent of people with no insurance coverage and percent of people below the poverty level. Granville County was the most similar in area level characteristics to the study area of interest Durham County.
Health resources for each zip code were researched to understand the proximity to health care services and community resources for both counties, using the Health
Resources Services Administration (HRSA) Data Warehouse
(http://datawarehouse.hrsa.gov/). I measured proximity of resources in miles and divided into one of three groups: resources within 5 miles, 10 miles and 15 miles. Durham
group were summarized by economic indicators and proximity to community resources, the definition for readmission was the next step.
Readmission is defined as a subsequent hospital admission within 30 days after discharge from the index admission for a cardiovascular-related diagnosis. This included all patients admitted to Duke University Hospital (DUH) and Duke Regional Hospital (DRH) over the past 10 years. Cardiovascular diagnoses were defined based on the International Classification of Diseases 9th edition (ICD-9) admission codes 390-438. Patients with more than 20 encounters (n=6 patients had between 21 and 64 encounters) were omitted to minimize possible bias due to over-representation of these outlier data.
The data used for the study were clinical data of all eligible subjects who were admitted to DUH or DRH for the treatment of cardiovascular-related illnesses and those with an address recorded in their medical records with a matching zip code from Durham County or Granville County. Clinical data was stored at the organizational data
indicator; patient geography elements included, city, primary postal code, and county; and patient hospital encounters elements included, hospital, admission date, discharge date, payor group, age at arrival in years, Diagnosis Related Group (DRG) code, ICD9 diagnosis code, diagnosis name, diagnosis date and diagnosis type description.
The resulting data sample contained patient encounters for patients admitted to DUH or DRH witha CVD diagnosis during the noted 10 year period.The study excluded patients under 18 years old and patients with no zip codes reported. Patients were
identified by MRN, and encounters counted were those with the specific CVD ICD9 codes.
Analyses
The study used Stata analytic software version 14.0 (StataCorp) to generate descriptive statistics and conduct multivariate regression analyses. The initial stage of analyses (Aim 1) examined the unadjusted distributions of patients to characterize their
background demographics, hospital admissions, and several area-level factors
characterizing the residential area: percent of elderly adults, percent of nonwhite adults,
household income, percent of patients below poverty level, and percent of patients with
no health insurance. Differences between Durham and Granville Counties were assessed
using chi-square tests (for categorical variables) and Kruskal-Wallis tests (for continuous
variables). The second stage of analysis (Aim 2) used multivariate methods to identify the
factors associated with 30-day readmissions. Logistic regression models were estimated
in several steps to demonstrate first whether Granville County had higher rates of
whether background demographics play a role in the associations (Model 2) written as:
logit(OR) = β0 + β1*county + β2*age + β3*male + β4*nonwhite. Third whether area-level
characteristics (Model 3) play a role in the associations logit(OR) = β0 + β1*county + β2*age + β3*male + β4*nonwhite + β5*pct_nonwhite + β6*HHincome. Preliminary analyses included
all area-level factors; however, multicollinearity and model over-identification (related to
sample size/power) prohibited the inclusion of each measure. Therefore, the final models
only include the statistically significant area-level factors (household income and percent
nonwhite race). Results were reported as odds ratios (OR) with 95% confidence intervals
(CI). All models also adjusted standard errors for clustering based on hospital of
admission (i.e., DUH vs. DRH).
Results
There were 16,383 patient encounters for the Access to Community Resources in Disadvantaged Areas and its Impact on Hospital Readmission in Cardiovascular Disease Patients study. The study identified 3,143 (19%) encounters for patients admitted to either DUH or DRH who had been admitted for a cardiovascular-related condition; 2,873 (91%) hospital encounters were for Durham County patients and 270 (9%) hospital encounters for Granville County patients. The number of encounters corresponded to 1,033 patients admitted for CVD living in Durham County in the areas containing the zip codes 27701, 27703, 27704, 27705, and 27707, and 107 patients living in Granville County in the areas containing the ZIP codes 27509, 27522, 27565, and 27581.
Durham County (51.11% vs 37.52%, respectively). Among all patients, 57.05% are non-white race, Durham County have a larger number of non-non-white race patients than
Granville County (60.39% vs 21.48%, respectively). The total percentage of patients admitted to Duke University Hospital is 54.18%, Durham County has more patients admitted than Granville County to this particular hospital (55.48% vs 40.37%, respectively). The total percentage of patients admitted to Duke Regional Hospital is 45.82%, Granville County has more patients admitted than Durham County to this particular hospital (59.63% vs 44.52%, respectively).
County 18.17% (168 patients) were readmitted within 30 days compared to 18.52% (20 patients)in Granville County. Overall, there was no significant bivariate difference of 30 day readmission for CVD between Durham and Granville Counties based on these data for the noted 10 year period.
Table 5 reports the results from the logistic regression models estimating the factors associated with 30-day readmission in Durham and Granville counties. In Model 1, we see no significant difference in rates of readmission between the two counties. Model 2 includes the individual-level characteristics and further shows no significant differences between Durham and Granville when taking into account differences in age, sex, and race. The final analysis includes the individual- and area-level factors (Model 3) and shows a significant difference in readmission when area-level factors are held
constant. Results suggest that patients from Granville county are significantly more likely to be readmitted than patients from Durham county (OR=1.28; 95% CI, 1.15-1.43).
Discussion
The study findings provide important results to improve health outcomes for CVD patients at a hospital level, community level, and public policy level using a public health practice approach. The study findings suggest that hospitals should consider CVD
patients’ both their living environment and community support system at the time of admission to the hospital as a quality of care intervention. As documented by Krumholz and colleagues, readmission is costly to the health system and also preventable, 12 in addition obtaining these characteristics may help hospitals to better measure performance when admitting patients with CVD. Understanding patient social and living environment at the time of hospitalization can help create interventions that improve patient quality of care at a hospital level and lower the chances of readmission. This study has shown that hospital medical records systems at DUH and DRH currently do not include data fields that capture patients’ risk for rehospitalization other than clinical factors. Registration of SES patient data in addition to clinical data by health care providers can be used to improve quality of care. In addition, statistically analyzed data are valuable to generate a patient profile for CVD patients at risk of readmission. These data can help evaluate projects and interventions for this specific group of patients, and reports derived from the data can also support funding requests of new projects that aim to improve health
outcomes.23
policy, appropriations and laws that will improve health in the community by improving the living space in neighborhoods, such as parks that can foster community engagement. Laws can also help by allocating funding for programs that affect population health, such as smoking cessation and health care management at home. Most importantly public health practitioners need to have the appropriate tools to be strong advocates during the policy making process, such that efforts are undertaken to enhance communities so that people have the appropriate resources within reaching distance when they encounter a major life event such as CVD.
These study findings support the hypothesis that access to community resources are an influential factor for hospital readmission. Community based interventions that aim to improve the transition from hospital to home for CVD patients can impact patients’ post discharge conditions and lower their probability of being readmitted. A multidisciplinary disease management approach is proven to decrease readmission rates after discharge.24 Beyond policy changes, strategic planning is needed to reach the goals of such policies. Effective strategic planning should include government organizations, non-profit organizations, for profit corporations, community coalitions, and other community organizations such that they collaborate to make health services more
efficient. Strategic planning includes an examination of the current status and options for improvement or change, it also creates a rational step by step plan to carry on in a
systematic way the proposed changes.23
homeless population or those patients without a zip code associated with their medical record number. In addition, analysis at a patient level with geographic information as a measure can add inconsistencies to the study by aggregating the characteristics of an area to all individuals within that area, 19 this is true for this study since Durham County has an economically diverse population in a densely populated area. Second, there were no direct measures of area-level resources used in this study; therefore, I remain cautious when interpreting the findings as they relate to the hypothesized influence of differential resources.
Another limitation is that the results of this study may not be generalizable to areas beyond the selected North Carolina Counties. As such, the regional focus of the study may be unique to these counties. However, since the data is consistent with national numbers for CVD readmission, it leads me to believe the results can be widely
Conclusion
Cardiovascular disease in the United States is one of the conditions that contribute the most to hospital readmission, interventions that target the risk factors for CVD are an effective way to prevent the disease, in the last years more complex methods to predict risk factors have been designed, they include not only the major risk factors such as smoking and high blood pressure but also patient low SES, and environment. Despite improvement in preventing CVD, rehospitalization for CVD remains high and it is not only costly to the health system but also an indicator of the quality of care. Studies have shown that living in a disadvantage area with limited community resources is a
contributing risk factor for hospital readmission in CVD patients. This study suggests that living in the proximity to community resources play an important role in patients’ health and affects readmission within 30-days of initial discharge.
This study selected two areas within the state of North Carolina, Durham County an area rich in community and health care resources and Granville County an area with limited resources, to conduct an analysis of patient encounters and readmission after discharge in two hospitals DUH and DRH in a 10 year period. When individual- and area-level factors were included in the analysis, it showed that Granville County patients were more likely to be readmitted to the hospital within 30-days of discharge.
References
1. World Health Organization. (2014). Cardiovascular diseases (CVDs). Retrieved
from http://www.who.int/mediacentre/factsheets/fs317/en/
2. Heidenreich, P. A., et al. (2011). "Forecasting the future of cardiovascular disease in the United States: a policy statement from the American Heart Association."
Circulation 123(8): 933-944.
3. Krumholz, H. M., et al. (2000). "Predictors of readmission among elderly survivors of admission with heart failure." Am Heart J 139(1): 72-77.
4. Assessment of Cardiovascular Risk by Use of Multiple-Risk Factor Assessment Equations
5. Lloyd, D. M., & Redberg, R. F. (2005). Risk Stratification in asymptomatic patients. Patient Care, 39–45. Retrieved fromwww.patientcareonline.com
6. Kannel, W. B., et al. (2004). "Concept and usefulness of cardiovascular risk profiles." Am Heart J 148(1): 16-26.
7. Centers for Disease Control and Prevention. (2015, August 10). Heart Disease Risk
Factors. Retrieved fromhttp://www.cdc.gov/heartdisease/risk_factors.htm
9. Krumholz, H. M., et al. (2000). "Predictors of readmission among elderly survivors of admission with heart failure." Am Heart J 139(1): 72-77.
10.Hines, A. L., Barrett, M. L., Jiang, J., & Steiner, C. A. (2014). Conditions With the Largest Number of Adult Hospital Readmissions by Payer, 2011 (No. 172). Agency
for healthcare Research and Quality. Retrieved from http://www.hcup-us.ahrq.gov/reports/statbriefs/sb172-Conditions-Readmissions-Payer.pdf
11.Jweinat, J. J. (2010). "Hospital readmissions under the spotlight." J Healthc Manag
55(4): 252-264.
12.Krumholz, H. M., et al. (2009). "Patterns of Hospital Performance in Acute Myocardial Infarction and Heart Failure 30-Day Mortality and Readmission." Circulation-Cardiovascular Quality and Outcomes 2(5): 407-413.
13.A path to bundled payment around a rehospitalization. In: Report to the Congress: reforming the delivery system. Washington, DC: Medicare Payment Advisory Commission, June 2005:83-103.
14.Jencks, S. F. (2011). "Rehospitalizations among Patients in the Medicare Fee-for-Service Program (vol 360, pg 1418, 2009)." New England Journal of Medicine
364(16): 1582-1582.
15.Robert Wood Johnson Foundation Commission to Build a Healthier America. (n.d.). Race, Socioeconomic Factors and Health. Retrieved
16.Arbaje, A. I., et al. (2008). "Postdischarge environmental and socioeconomic factors and the likelihood of early hospital readmission among community-dwelling
medicare beneficiaries." Gerontologist 48(4): 495-504.
17.Rathore, S. S., et al. (2006). "Socioeconomic status, treatment, and outcomes among elderly patients hospitalized with heart failure: Findings from the National Heart Failure Project." Am Heart J 152(2): 371-378.
18.Cooney, M. T., et al. (2010). "Assessment of Cardiovascular Risk." Curr Hypertens Rep 12(5): 384-393.
19.Kind, A. J. H., et al. (2014). "Neighborhood Socioeconomic Disadvantage and 30-Day Rehospitalization." Annals of Internal Medicine 161(11): 765-U736.
20.Franks, P., et al. (2010). "Including Socioeconomic Status in Coronary Heart Disease Risk Estimation." Annals of Family Medicine 8(5): 447-453.
21.Horvath, M. M., Winfield, S., Evans, S., Slopek, S., Shang, H., & Ferranti, J. (2011). The DEDUCE Guided Query Tool: Providing Simplified Access to Clinical Data for Research and Quality Improvement. Journal of Biomedical Informatics, 44(2), 266– 276. http://doi.org/10.1016/j.jbi.2010.11.008
22.Partnership for a Healthy Durham, & Durham Department of Public Health.
(2014). 2014 Durham County Community Health Assessment. Durham, NC. Retrieved from
23.Guest, C. (2013). Oxford handbook of public health practice. Oxford, Oxford University Press.
24.Hamner, J. B. and Ellison K. J. (2005). "Predictors of hospital readmission after discharge in patients with congestive heart failure." Heart Lung 34(4): 231-239.
25.Brindle, P. M., et al. (2005). "The accuracy of the Framingham risk-score in different socioeconomic groups: a prospective study." British Journal of General Practice
55(520): 838-845.
Table 1. Durham and Granville Counties by Economic Indicators and Zip Code
Population count
(#)
Percent Age 65 +
(%) Percent white (%) Percent Black (%) Percent Hispanic (%) Median HH income ($$) Percent No health insurance (%) Percent Below poverty level (%)
Durham 267,587 9.80 46.40 38.00 13.50 51,853 16.40 18.50
27701 21,228 7.50 33.40 49.40 20.70 26,690 27.50 33.60
27703 41,937 7.20 32.10 51.90 17.60 54,767 19.10 20.30
27704 34,517 10.30 30.90 53.90 17.00 41,091 17.70 22.00
27705 46,282 11.70 61.30 19.20 14.20 46,597 9.80 19.30
27707 45,023 9.60 41.30 42.10 15.90 45,831 20.00 23.40
Granville 59,916 12.40 60.40 32.80 7.50 49,852 13.10 15.40
27507 1,929 15.30 68.60 26.20 4.10 47533 16.60 11.40
27509 10,167 9.30 45.00 45.80 12.50 42169 12.80 21.60
27522 12,335 10.70 69.10 23.60 8.30 52468 13.10 10.10
27565 25,255 16.00 51.90 41.80 6.20 43507 13.90 19.50
27581 3,049 11.00 83.20 11.50 4.20 52560 14.90 11.50
27582 289 22.10 37.70 61.90 0.70 55000 35.40 3.80
Source: 2015 ACS Census Data
Table 2. Durham and Granville Counties Health Care Resources within 10 miles of Zip Code
Durham 0-10 miles
27701
Health Care for the Homeless Early Intervention Clinic Holton Clinic Lincoln Community Health Center Lyon Park Clinic Walltown Clinic Durham Center Access Live Well N Durham Medical Park John H. Lucas Sr Wellness Center IFC Community Health Center
27703
Holton Clinic Lincoln Community Health Center Health Care for the Homeless Early Intervention Clinic John H. Lucas Sr Wellness Center
Lyon Park Clinic Walltown Clinic Durham Center Access
Live Well N. Durham Medical Park
27704
Holton Clinic
Live Well N. Durham Medical Park Durham Center Access
Health Care for the Homeless Early Intervention Clinic Walltown Clinic
Lincoln Community Health Center Lyon Park Clinic
John H. Lucas Sr Wellness Center
27705
Walltown Clinic Lyon Park Clinic Durham Center Access Live Well N Durham Medical Park Early Intervention Clinic
Health Care for the Homeless Lincoln Community Health Center
Holton Clinic
IFC Community Health Center John H. Lucas Sr Wellness Center Carrboro Community Health Center Piedmont Health Services
27707
John H. Lucas Sr Wellness Center Lyon Park Clinic
Lincoln Community Health Center Early Intervention Clinic
Health Care for the Homeless Walltown Clinic
Holton Clinic IFC Community Health Center
Durham Center Access Carrboro Community Health Center
Piedmont Health Services
Live Well N Durham Medical Park Granville 0-10 miles
27507 N/A 27509 N/A 27522 N/A
27565 Rural Health Group Rural Health Group at Henderson
Table 3. DEDUCE Cohort Filter
Description Data Element Definition
Patient Demographics
Duke Medical Record Number Unique identifier of a specific patient visit
Patient Date of Birth The date upon which the patient was born
Patient Gender The patient’s gender
Patient Race The patient’s race
Patient Ethnic Group The field that captures whether the patient self-identifies as Hispanic or Latino
Patient Death Indicator An indicator that the patient is deceased and from where the information was collected
Patient Geography
Patient's city The city in which the patient has an address
Patient Primary Postal Code The primary postal code in which the patient has an address
Patient County The county in which the patient has an address
Patient Hospital Encounters
Hospital The hospital where the encounter took place
Admit Date The date the patient was admitted to the hospital
Discharge Date The date the patient was discharged from the hospital
Payor Group The category group for the primary payor for this encounter
Patient Age at Arrival in years The age of the patient at arrival, in years
MS DRG Code
ICD9 Diagnosis Code The code that represents the diagnosis in the international classification coding system
Diagnosis Name The name of the diagnosis
Diagnosis Date The date the diagnosis was made by a clinician or coded
Table 4. Durham and Granville Counties CVD Patients Individual and Area Level Characteristics
Total†
(n = 3,143) Durham (n = 2,873) (n = 270) Granville Value P
Number of patients 1,033 926 89.64% 107 10.36%
Individual-level Characteristics
Age 75.87 (13.05) 76.58 (12.66) 68.27 (14.68) <.001
Male (%) 38.69
%%% %%% %
37.52 51.11 <.001
Non-white race (%) 57.05
% 60.39 21.48 <.001
Admission hospital (%)
Duke University Hospital (DUH) (%) 54.18
%% 55.48 40.37 <.001
Duke Regional Hospital (DRH) (%) 45.82 44.52 59.63 <.001
Area-Level Characteristics ‡
Percent elderly (age 65+) 10.22 (1.68) 10.02 (1.38) 12.33 (2.78) <.001 Percent Non-white race 56.16 (13.02) 57.62 (12.15) 40.65 (11.84) <.001 Percent with no health insurance 17.19 (5.41) 17.54 (5.53) 13.46 (0.60) <.001 Percent below poverty level 22.48 (4.83) 23.10 (4.31) 15.81 (5.00) <.001 Household income (in thousands, $) 42.92 (6.69) 42.52 (6.70) 47.27 (4.73) <.001
30-Day readmission (%) 18.20 18.17 18.52 .887
Note: Values reported as percentages for categorical variables and mean (standard deviation) for continuous variables. † Study n’s represent number of hospital encounters.
TABLE 5. Analysis for factors associated with Cardiovascular disease patients, 30-day readmission in Durham and Granville Counties
Odds Ratio (95% CI)
Model 1 Model 2 Model 3
Granville county (vs. Durham) 1.02 (0.88-1.19) 1.09 (0.96-1.24) 1.28 (1.47-1.43)
Individual-level Characteristics
Age 1.01 (1.01-1.01) 1.01 (1.00-1.01)
Male 1.14 (1.12-1.15) 1.14 (1.13-1.15)
Non-white race 1.10 (1.00-1.21) 0.98 (0.96-1.00)
Area-Level Characteristics
Percent Non-white race 1.01 (1.00-1.02)
Household income (in thousands, $) 0.99 (0.99-0.99)
Abbreviations: CI, confidence interval.
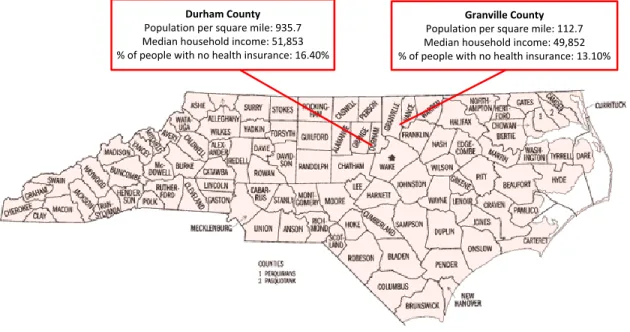
Figure 2. Durham and Granville County comparison
United States Census Bureau. (2015).
Durham County
Population per square mile: 935.7 Median household income: 51,853 % of people with no health insurance: 16.40%
Granville County