Page 1 of 31
Abstract
BACKGROUND: This study examines factors affecting client satisfaction survey response rates for a local health department in Orange County, North Carolina.
METHODS: A quasi-experimental trial of interventions, employed simultaneously at two health clinic locations, was conducted over a period of four weeks. A total of 2,128 encounters were used to compare response rates across and between clinics. Additional analysis assessed the relationship between survey completion and absenteeism, and a qualitative analysis of
organizational factors affecting response rates was conducted with participating staff through an online survey tool.
RESULTS: When compared to baseline periods, weeks during which interventions occurred saw greater survey response (t = -7.759, p < .01). Response rates appeared to decline to previous levels once the interventions ceased, however, especially in one of the two clinics. In addition, separate analysis suggested that the absenteeism rate at each of the two clinics also was associated with response rates and interviews with staff suggested the importance of having enough staff present and of having enthusiastic champions on staff as keys to getting surveys completed.
Facilitating Client Participation in Satisfaction Surveys
Page 2 of 31
Background
Why response rates matter
Survey response rates are not only a relevant statistic in an academic setting, but are
important in practice as well. By assuring meaningful and representative measures of client
satisfaction are in place, staff can help to ensure improvements to programs and services may
begin to occur. Striving for high response rates ultimately can help organizations assess both
organizational and client-related aspects of their work, and, in the short term, can help them to
focus on reaching groups most at risk for not being included in survey results, groups that often
are the exact populations public health programs seek to serve.
In general, surveys have told us much about factors that are associated with client
satisfaction. A number of factors seem to drive client satisfaction, e.g., Taylor and Benger
(2004). Client factors such as health status, outcomes, demographics (such as age, gender and
socioeconomic status) and predisposition and expectations when reporting satisfaction seem to
matter. Additionally, health service delivery factors such as the client-practitioner relationship,
perceived wait time, information provided, and interpersonal skills and perceived attitudes of
staff, also appear to contribute to reported satisfaction (Taylor and Benger, 2004). What we
know about client satisfaction, though, is a product of survey response rates, in part.
What is a response rate exactly? Kviz and colleagues (1977) offered a simple definition
of response rates that is useful for our discussion: the number of completed questionnaires
divided by the number of eligible sample members. A response rate offers a direct indicator of
Page 3 of 31 How could survey response rates play a role in actually affecting the quality of client
satisfaction information? Studies by Taylor and Benger (2004) and Crow and colleagues (2002)
emphasize the importance of response rates on the ability of organizations to be fully informed
regarding improvements to programs and services which actually contribute to overall client
satisfaction. The topic of response rates has been of interest to researchers and practitioners
for some time because higher response rates are (1) associated with meaningful results given
the tendency studies with higher response rates to be more representative of the population,
(2) are more capable of demonstrating significance due to a suitable number of cases, and (3)
associated with increased perceptions of the study’s credibility in the eyes of decision-makers
(Frohlich, 2002).
Additional considerations regarding credibility are discussed by Frohlich (2002) and
Lueptow and colleagues (1978) when they emphasize the risks of biased results when response
rates are low. Previous studies indicate non-respondents tend to be members of visible minority groups have lower levels of education and are typically uninsured (Crow et al, 2002). In
addition, the systematic review of literature by Crow and colleagues (2002) identified
reoccurring issues obtaining usable responses from the elderly, critically ill, developmentally
disabled and those experiencing language or literacy barriers.
Other studies have focused on evaluating the effectiveness of different survey methods
as well as the effect of survey design on reported satisfaction. Issues relating to questionnaire
design, scaling, wording and cross-cultural differences also appear to introduce bias, not to
mention the effect of nonresponse bias on the representativeness of the results as a whole
(Johnson and Wislar, 2012). Recall bias and other limitations may also be introduced when
Facilitating Client Participation in Satisfaction Surveys
Page 4 of 31 anonymity, telephone and face-to-face interviews generate up to 30 percent higher response
rates (Crow et al, 2002). While these considerations are supportive of on-site surveys, live
interviews have been found to under-represent infrequent users in ambulatory care settings
(Taylor & Benger, 2004).
What all of these studies tell us is that response rates appear to matter and yet also
seem to be affected by both the convenience offered to respondents and directness with which
respondents are approached. Focusing on making surveys convenient should help then and yet
also it seems important to ensure that clients are approached directly and asked for their input,
a simple idea that nonetheless might be overlooked in many busy clinic settings.
Present Studies and County Overview
The experience of a local health department – the health department of Orange County,
North Carolina – illustrates the challenge of increasing response rates. Orange County faced low
response rates and tried to do something about the situation; this paper focuses on that
experience. The present study, focused on Orange County, nonetheless also has the potential
for applicability to other local health departments searching for ways to improve their own
satisfaction survey response rates for clinic programs and services.
Located on the western edge of the Research Triangle, Orange County is a relatively
resource-rich community, encompassing 400 square miles of farmlands, forests, urban areas
and small towns (Orange County, 2012). With over 130,000 residents spread throughout, much
of the population is centralized in the county seat of Hillsborough; Chapel Hill, home to the
University of North Carolina; and Carrboro and Mebane. With a population today more than
double what it was a decade ago, growth is projected to continue, increasing to nearly 154,000
Page 5 of 31 As the county has continued to grow, however, so has its diversity. Population
demographics vary by the three main municipalities. The largest minority group of Hillsborough
residents is Black (29.5%); Hispanic or Latino (13.8%) are the largest minority group in Carrboro;
and in Chapel Hill the largest minority group (11.9%) is Asian (U.S. Census, 2010). Immigrant
and refugee populations, the majority of whom are members of the Burmese, Chinese, Asian
Indian and Korean communities, are drawn by the County’s opportunities in education and
labor, and a generally peaceful and welcoming environment (U.S. Census, 2010).
Orange County Health Department overview
Orange County is consistently ranked high for the health of its population. In 2012, the
County Health Rankings initiative determined Orange County to be the second healthiest
county overall in the state, based on 19 health factors and outcome measures. Within these
measures, the County ranked first in every category, with the exception for physical
environment where it ranked 31 (University of Wisconsin Population Health Institute, 2012).
Responsibility for the County’s health falls primarily upon the health department.
Located in Hillsborough, the Orange County Health Department is staffed by over 90 public
health practitioners, across five divisions: Dental Services, Personal Health (with clinics in
Hillsborough and Chapel Hill), Environmental Health, Health Education and Promotion and
Finance and Administration. In addition to these five divisions, the Department works
collaboratively with Emergency Services for emergency preparedness and response. The Health
Department is under the direction of the Health Director, Dr. Colleen Bridger, who joined the
Department in 2011. In addition to the Health Director, the Department receives policy and
governance oversight by the Orange County Board of Health, charged with protecting and
Facilitating Client Participation in Satisfaction Surveys
Page 6 of 31 Improving survey response rates
At a Board of Health meeting earlier in 2012, the issue of increasing client satisfaction
survey response rates arose as a point of concern. Three required activities for local public
health accreditation in North Carolina are relevant to satisfaction. Local health departments are
required to (1) have a process in place for assessing community satisfaction with its services, (2)
use the data gathered to make improvements to its services and (3) have in place a quality
assurance and improvement process to assess the effectiveness of services and improve health
outcomes (NCIPH, 2010). On an annual basis, lead staff within the Departments’ five divisions
report community satisfaction results of their programs and services. Each division collects
feedback in its own way; some using the County’s SurveyMonkey account, with others relying
solely on traditional, paper survey formats. The health clinics use the traditional format to
assess their services, examples of which include family planning, maternal health, child and
adolescent health, adult health, primary care, sexually transmitted infection (STI) testing and
counseling, immunizations, refugee health, and nutrition.
In the health clinics (Whitted and Southern), client satisfaction survey cycles occur
simultaneously at both clinic locations, twice a year, for a period of four weeks. Before initiating
this study, informal interviews with health clinic staff indicated methods used by each clinic for
distributing and collecting surveys were unclear and varied by location, despite the fact most of
the staff (with the exception of administrative staff) worked at both locations on a regular basis.
Often clients would be handed a survey upon checking in, however, surveys were sometimes
completed before their health visit, or abandoned while the client waited in exam and
interview rooms. Staff tried to collect surveys upon check-out; however, this process was also
Page 7 of 31 services as participation for each clinic program varied during survey collection cycles; an
important note as response rates were calculated based on the total number of completed
surveys over total encounters for all programs (pulled from the clinic’s electronic health records
system at the end of the month), potentially understating the true response rates if encounters
for those not participating were used in response rate calculations.
One consistency across clinics is that the same survey is used, available in English and in
Spanish (Appendix A). The survey itself contains 19 questions and focuses specifically on
capturing client satisfaction with services before and during the visit, including ease of access
(clinic hours and location), practitioner, interpreter and client interactions, and how to improve
or change services (open-ended questions, at the end of the survey). The survey does not
collect demographic or client-specific information and staff commented initially the survey was
outdated and needed to be revised. Suggestions included revising the format to be more
user-friendly, modifying the sequence of interpreter questions, potentially shortening the survey and
changing the reporting scale, and re-wording questions to be more appropriate to the client
base and reflective of the programs and services provided.
Ultimately, when lower than expected results from the two survey collection cycles in
2011 were presented to the Board of Health, it became clear improvements were needed to
not only meet the accreditation benchmark, but to ensure clinic programs and services were
meeting the needs of the population it serves. As others have found (Korsch 1968, Larsen 1976
& Carr-Hill 1992), satisfaction with care has been associated with the likelihood clients will seek
medical attention, comply with therapeutic regimen or maintain a continuing relationship with
their provider. When response rates are indicative of a small proportion of clients, it is quite
Facilitating Client Participation in Satisfaction Surveys
Page 8 of 31 outcomes may be adversely affected. In addition, Johnson and Wislar (2012) point out,
response rates, whether they are viewed as low or high, are valuable only when respondents
are representative of the population. Given this, efforts were focused on identifying low-cost, minimally invasive, sustainable interventions aimed at improving response rates at both clinic
locations.
Methods
The purpose of the study was to identify best practices for improving client satisfaction
survey response rates. It was determined the study would closely mimic a regular survey
collection cycle. To minimize the effect of confounding factors, a quasi-experimental study was
designed, to be implemented at both clinic locations over a period of four weeks. To assess the
impact of interventions, baseline data from the 2011 collection cycles were used with response
rates calculated for the month as a whole. Response rate data for the study were obtained by
counting completed surveys (numerator) and corresponding encounter data (denominator) for
each week of the collection cycle, by clinic location.
The client encounter was determined to be the unit of analysis and consistent with
previous collection cycles, any survey handed in whether partially or fully completed was
counted toward survey completions. Response rates for the completed week were calculated
the following Tuesday when encounter data numbers were compiled and reported to the
personal health services manager.
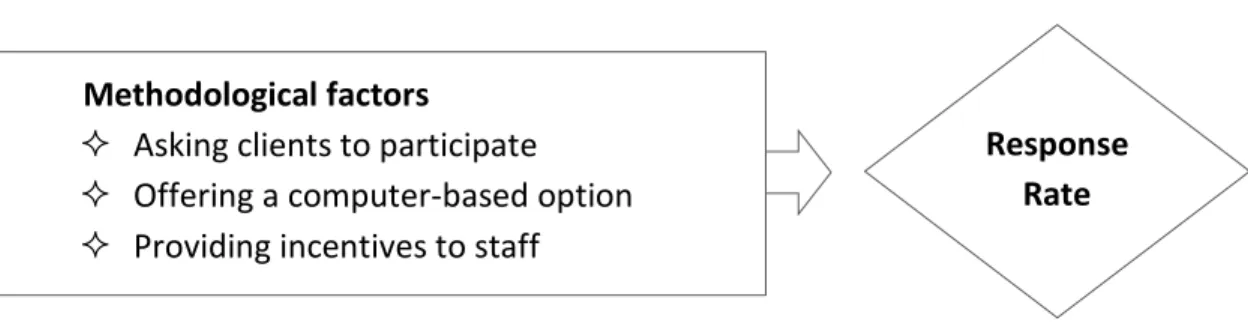
Independent variables for this study are the methodological factors selected to affect
Page 9 of 31 helps frame the factors that may be affecting behaviors. Findings from this study will be used
to inform corrective actions and target interventions (Earp & Ennett, 1991).
Figure A. Concept model of methodological factors affecting response rates
Methodological factors
Asking clients to participate Offering a computer-based option Providing incentives to staff
Review of relevant literature in combination with informal interviews with health
department leadership to assess available resources (e.g. available funds and staff) focused the
study’s survey methodology to “on the spot” surveys in both clinic locations. The time and
resources needed to follow-up with mailed surveys was outside current staff abilities. In
addition, Taylor and Benger (2004) discovered in an emergency department study to improve
response rates that surveys conducted after the client left the ED introduced bias, tending to be
more positive, particularly when the acute problem had been resolved (Trout, 2000). In
addition, leadership determined the scope of the study would focus initially on methods to
improve response rates, and would review the survey format once the study had been
completed, incorporating changes as appropriate. With the survey methodology and format
consistent with what resulted in the 2011 survey data, the study design allowed for
comparability between baseline and study results.
Having selected the survey methodology and format, attention moved toward
identifying interventions. Knowing that each clinic lacked consistent procedures for
administering and collecting client surveys, establishing a consistent approach seemed to be Response
Facilitating Client Participation in Satisfaction Surveys
Page 10 of 31 the least invasive option and one that had the potential to identify systems and process
improvements. The second intervention identified was the additional option of an online
version of the current survey, accessed through client exam and interview room computers. By
providing users with the option to complete a survey using a computer or pen and paper,
results would hopefully indicate whether a computer-based survey would be a suitable option
going forward. The third intervention selected was the introduction of incentives to gauge the
effect on staff response. The use of incentives has been widely used, and has under come some
scrutiny in recent years, yet offered an opportunity to assess organizational effects on survey
response.
Once the interventions and study design were confirmed, it was determined
intervention cycles would begin at the start of clinic operations on Wednesday mornings and
run through the following Tuesday, at which point completed surveys for that week would be
collected and entered into SurveyMonkey for later analysis. To begin the study, interventions
were employed for one week at a time, over the four-week period. Each clinic location
experienced the same intervention, at the same time, to reduce potential confusion for staff
working between clinic locations, as well as exposure differences for clients attending each of
the clinic locations. Participants of the study included clinic staff and clients.
In the first week, clinic staff received an email from the clinic manager, to inform them
of the study and directions for distributing and collecting surveys for the upcoming week.
Stand-up meetings at each clinic locations were held on the first morning of the study, where
staff had an opportunity to ask questions and clarify expectations. The primary intervention for
the first week was asking each client to complete a survey before they left. An emphasis was
Page 11 of 31 appointment. To facilitate this small change, surveys were printed (English on the front, Spanish
on the back) and placed in exam and interview rooms, along with a supply of pencils and pens.
Green reminders asking whether the survey was complete were taped to the back of each exam
and interview room door, and also placed at the check-out counter. Administrative staff were
asked to collect surveys and maintain them until the following Tuesday when they would be
collected.
In the second week, the intervention employed during the first was maintained,
however, in this week the addition of a computer-based survey option was added. Now,
practitioners were asked to have clients consider completing a survey before they left in a
format that was most comfortable for them (offering the survey in Spanish and English, on
paper or on an exam room computer). SurveyMonkey software was used to collect client
responses recorded on the computer. Coordination with Orange County Information
Technology (IT) staff made this option possible as they worked closely with us to establish a
unique guest login for each computer which only allowed access to the survey itself, and no
other computer files or applications. Staff again received an email the day before the start of
the intervention to explain the process. Questions regarding the process were answered the
following morning, before the new intervention cycle was to begin. Paper surveys, pens and
pencils were again placed throughout the clinic. The survey cycle lasted from Wednesday to the
following Tuesday, at which point paper surveys were collected, tallied and added to the
responses gathered through the online option.
In the third week, the two previously employed interventions were maintained, but this
week clinic staff were offered an incentive (wish-list supplies for the clinic) if response rates
Facilitating Client Participation in Satisfaction Surveys
Page 12 of 31 placed throughout the clinic and staff received an email reminder about the importance of
improving response rates and the requirements for the incentive half-way through the week.
Paper surveys were collected the following Tuesday and reminder signs, printed surveys,
pencils and pens were removed and exam and interview room computers were set back to
normal with access to the online survey removed.
On the day before the start of the fourth week, an email was sent to staff thanking
them for their participation and asking them to continue collecting surveys for one more week,
using the distribution and collection methods used before the start of the study (standard
means of practice). No other interactions with clinic staff were had during the fourth week,
with the exception of collecting completed surveys from each clinic locations on the last day of
the cycle.
In the analysis, results were compared across and between clinics. A total of 2,128
encounters from the two months of baseline data (July and December 2011) and the four
weeks of study data were used for comparison of different participant recruitment methods.
Response rates from each group of data sets (n = 6; two months of baseline data and four
weeks of study data for both clinics) were calculated using the number of completed surveys as
the numerator and the corresponding encounter data as the denominator. Using this data, an
ANOVA test (SPSS Inc., version 9) for differences was conducted to check for differences in the
proportion of completed surveys overall, among the six “groups” of clinic data. In addition, a
post-hoc comparison test was done for pairs of groups. An independent samples t-test was also
conducted to compare pooled results of the three weeks of interventions (ask, computer and
Page 13 of 31 Although the comparison of interventions was quasi-experimental, meaning that any
differences in the whole sample between interventions and the baseline should largely have
been due to the interventions, the study also explored whether a characteristic of the clinic
setting demonstrated a relationship to survey completion. Specifically, the analysis reviewed
whether nurse practitioner absenteeism was predictive of survey completions. Absentee hours
for each week were adjusted to reflect the normal FTE levels of nurse practitioners at each
clinic (1.5 FTE at Southern Clinic and 2.0 FTE at Whitted Clinic). We then assigned the clinic
absentee figure to each individual encounter. Sample size for the analysis was 743 encounters
for the four weeks of interventions. Each encounter was characterized as a completed survey or
not completed survey. A t-test analysis indicated as nurse practitioner absenteeism went up,
the number of survey completions went down, suggesting that as staff were more strapped for
time and resources, the lower response rates may be for that time period.
Follow-up Interview Study
In addition, a follow-up survey was emailed to clinic staff (n = 35), with the intent of
gathering evidence to inform the organizational perspective. The survey askedstaff to report
their experiences throughout the study and to offer an opportunity to provide feedback on the
process and potential barriers to improving client response rates that may have been otherwise
missed. Comprised of 22 questions, staff answered questions related to understanding of the
study’s instructions, comfort level in asking clients to complete a survey, ability to remember to
ask clients to complete a survey, whether they felt supported by management and their own
Facilitating Client Participation in Satisfaction Surveys
Page 14 of 31
Results
Differences between interventions
The results of the study indicate at least one intervention strategy significantly differed
from the others (p < .01; F = 23.140) and that all three interventions (mean of .4030) improved rates relative to baseline (mean of .2173) (t = -7.759; p < .01).
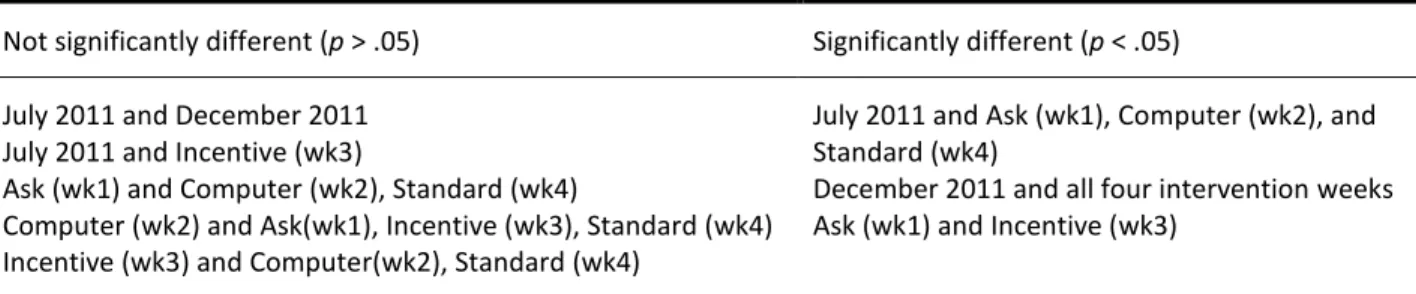
Further analysis shows significant differences (p < .05) between interventions conducted at both clinic locations in weeks one, two and four compared to response rates from July 2011,
and all four intervention weeks when compared to response rates from December 2011. No
significant differences were found between the two baseline data groups and mixed results
were seen when comparing interventions throughout the study across weeks (Tables 1 and 2).
Table 1. Summary of pooled comparison results for both clinics during baseline and intervention weeks Not significantly different (p > .05) Significantly different (p < .05) July 2011 and December 2011
July 2011 and Incentive (wk3)
Ask (wk1) and Computer (wk2), Standard (wk4)
Computer (wk2) and Ask(wk1), Incentive (wk3), Standard (wk4) Incentive (wk3) and Computer(wk2), Standard (wk4)
July 2011 and Ask (wk1), Computer (wk2), and Standard (wk4)
December 2011 and all four intervention weeks Ask (wk1) and Incentive (wk3)
A significant increase in response rates is seen in both clinics during the first week of
interventions (Figures A and B). At Southern Clinic, response rates rose from 19% and 15%
baseline rates, to 48% of clients completing a survey. During that same timeframe at Whitted
Clinic, response rates moved upward from 39% and 22% baseline rates to 54% of clients
completing a survey. In the following weeks, response rates fell at both clinic locations, with a
significant difference in response rates occurring between the two when clinics returned to
Page 15 of 31
Figure B. Proportion of completed surveys (pooled) Figure C. Proportion of completed surveys by clinic
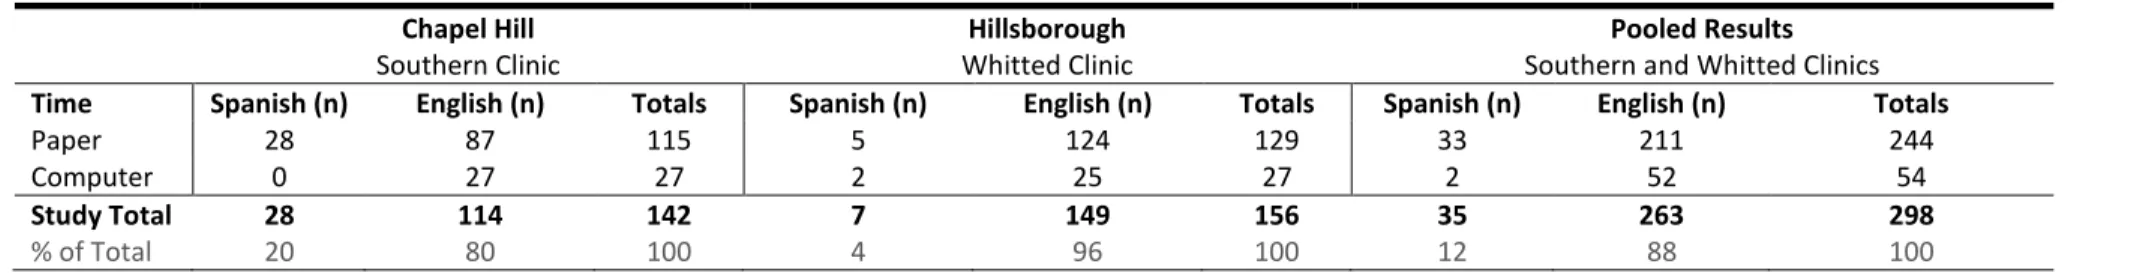
The number of surveys completed on paper and computer appeared to be consistent
between the two clinics, with Southern Clinic and Whitted Clinic having roughly the same
proportion of surveys completed using pen and paper versus the computer-based option (23%
and 21% respectively). However, a difference in language preference was seen between clinics
(Table 3). At Southern Clinic 25% of clients selected to complete the survey in Spanish. At
Whitted Clinic only 5% selected Spanish as their survey language option (computer and
Table 2. Summary Table of Results Chapel Hill Southern Clinic Hillsborough Whitted Clinic Pooled Results
Southern and Whitted Clinics
Baseline Surveys (n) Encounters (n) Response Rate Surveys (n) Encounters (n) Response Rate Surveys (n) Encounters (n) Response Rate
July 2011 85 455 .19 89 229 .39 174 684 .25
Dec 2011 56 380 .15 71 321 .22 127 701 .18
Interventions
Week 1 45 93 .48 43 79 .54 88 172 .51
Week 2 35 84 .42 30 73 .41 65 157 .41
Week 3 35 130 .27 28 77 .36 63 207 .30
Week 4 27 114 .24 55 93 .59 82 207 .40
Total
Weeks 1 - 4 142 421 .34 156 322 .48 298 743 .40
Table 3. Summary of survey completions by format and language
Chapel Hill
Southern Clinic
Hillsborough
Whitted Clinic
Pooled Results
Southern and Whitted Clinics
Time Spanish (n) English (n) Totals Spanish (n) English (n) Totals Spanish (n) English (n) Totals
Paper 28 87 115 5 124 129 33 211 244
Computer 0 27 27 2 25 27 2 52 54
Study Total 28 114 142 7 149 156 35 263 298
% of Total 20 80 100 4 96 100 12 88 100
Table 4. Summary of nurse practitioner absenteeism by intervention week and clinic
Chapel Hill
Southern Clinic
Hillsborough
Whitted Clinic
Pooled Results
Southern and Whitted Clinics
Intervention NP Hours Out1 Encounters (n) RR* NP Hours Out2 Encounters (n) RR* NP Hours Out Encounters (n) RR*
Week 1 16 93 .48 12 79 .54 28 172 .51
Week 2 32 84 .42 16 73 .41 48 157 .41
Week 3 8 130 .27 34 77 .36 42 207 .30
Week 4 20 114 .24 4.5 93 .59 24.5 207 .40
Study Total 76 421 .34 66.5 322 .48 142.5 743 .40
1 Totals for 1.5 FTEs Nurse Practitioners (NPs) 2
Page 17 of 31 Relationship between survey completion and absenteeism
Completed surveys were associated with lower absentee hours per FTE (Table 5). Among
the 445 encounters (out of a total n = 743) in which a survey was not completed, the mean
absenteeism rate was 10.6, whereas the mean absenteeism rate for the 298 encounters in which a
survey was completed was 9.6. That represents a statistically significant difference (t = 2.12, p < .05).
Table 5. Group statistics of relationship between survey completion and absenteeism
Survey Completed (n) Mean Std. Deviation Std. Error Mean
No 445 10.57* 5.74 .27
Yes 298 9.63* 6.09 .35
Note. * Pair of means are significantly different from each other, p < .05.
Other organizational factors affecting response rates
Additional factors affecting response rates were identified after review of the follow-up
survey administered to clinic staff. The survey link was emailed to staff (n = 35) during the fourth
week of the study. Of those who received the survey, 26 staff participated in the survey (response
rate of 74%). When asked to report factors that prevented them from collecting surveys from
clients, staff reported time constraints (both staff and clients being too busy), language or literacy
barriers for the client, or the health condition of the client prevented them from being able to
participate.
In addition to these barriers, the survey revealed differences between staff members’
comfort level in asking clients to complete a survey, with a majority reporting some level of
agreement and a significant number of others reporting no agreement either way. Many staff
reported an easy time remembering to ask clients to complete the survey (n = 12). In comparison,
Facilitating Client Participation in Satisfaction Surveys
Page 18 of 31 study (Figure D). Staff also report support from management, and some agreement when asked
whether the computer survey was easy to access (Table 7). Similar differences were seen when
staff were asked whether the clinic incentive motivated them to have more clients complete
surveys and when asked whether the survey collection methods introduced throughout the study
were just as good as the methods used to collect surveys before the study.
Table 7. Summary of key results from practitioner survey
Strongly Agree
Agree Neither Agree or Disagree
Disagree Strongly Disagree
Response Count
I felt comfortable asking every client to complete survey before they left.
23.8%
(5) 28.6% (6) 33.3% (7) 9.5% (2) 4.8 % (1) 21 I had an easy time remembering to ask
clients to complete the survey. 9.5% (2)
47.6%
(10) 19.0% (4)
23.8%
(5) 0.0% (0) 21 I felt supported by management.
9.5% (2) 71.4%
(15) 19.0% (4) 0.0% (0) 0.0% (0) 21
It was easy for me to access the survey
on the computer. 9.5% (2) 42.9% (9) 42.9% (9) 4.8% (1) 0.0% (0) 21 The clinic incentives motivated me to get
more client surveys completed. 4.8% (1) 38.1% (8) 42.9% (9) 9.5% (2) 4.8% (1) 21 The way we used to collect surveys is just
as good as any other option we tried during the study.
4.8% (1) 14.3% (3) 61.9% (13) 19.0%
(4) 0.0% (0) 21
0 1 2 3 4 5 6 7 8
None A few Roughly half Almost all All
Figure D. Overall, how many of your clients have you surveyed since we started the study?
Page 19 of 31
Conclusions
This study examined whether relatively simple interventions might improve client
satisfaction survey completion rates, a critical aspect of measurement important to improving
public health programs and services. We found a set of methods were able to improve response
rates modestly, though once we stopped interventions, rates generally declined again. Additional
analysis suggested differences at the clinic-level that were attributable at least in part to staff
presence and capability. Absenteeism affected survey response. In light of these findings, it is
important to recognize local clinics need reminders and assistance with data collection, and also to
keep in mind that systemic workforce issues can affect even mundane tasks like data collection
that are important for continuous quality improvement. In order to gather data for sustainable
change, some degree of systemic change at the organizational level might first be necessary to
ensure high quality data collection.
Response rates from 2,128 encounters were compared across and between clinics. Rates
were found to be are affected by a multitude of factors, including methodological influences such
as survey distribution and collection methods, organizational differences between clinics and
client-specific factors that remain unmeasured or unknown.
Recommendations for Satisfaction Survey Improvement
While we observed simply asking each and every client to complete a survey improves
response rates, over half still refused to participate. In addition, communicating the importance of
survey collection to staff may help encourage staff participation in seeking client response. At the
Facilitating Client Participation in Satisfaction Surveys
Page 20 of 31 Based on staff interviews and results from clinic programs, we know individual champions
and staffing availability also matter. Some staff fully believe in the quality improvement process,
while others feel time is better spent focusing on the client’s needs during the visit, rather than
asking them to complete a survey. Additionally, differences between clinics also are apparent and
may stem in part from staff dynamics. What remains to be understood is what these differences
are, and that understanding more about the clients served, will help Orange County identify
opportunities for improving client participation from those who are currently not being heard.
Lastly, we suspect the survey questions themselves are likely affecting response rates.
During the study, staff showed concerns related to reading level, question phrasing and wording,
as well as some discrepancies between the Spanish and English versions (potentially made during
translation). Future efforts to improve the survey should take into account these and other
examples of cultural and literacy barriers.
At the beginning of the study, three independent variables, or methodological factors
were testedfor their effect on response rates. The results of this study indicate all three
interventions were statistically significant in the number of survey responses, relative to baseline.
In addition to these interventions, it may also be useful to consider affecting other methodological
factors that were not addressed. One example of this might be employing shorter collection
periods, occurring more frequently throughout the year, as the trends of this study show declining
results and performance over time, suggesting possible novelty and disruption effects (Shadish et
al, 2002). In addition, “on-the-spot” surveys tend to not be representative of low-users (Taylor and
Benger, 2004) and more frequent opportunities to capture these users may prove useful.
As the study progressed a number of organizational and client factors, in addition to the
Page 21 of 31 response rates (Figure E). To improve the client satisfaction survey process, some of the
organizational processes Orange County can improve upon include ensuring all clinic programs are included in the survey collection process and ensuring appropriate staffing during collection periods. By encouraging and supporting participation from all, the clinics can see greater involvement and better response rates. Overall encounter data for all clinic programs were
previously used when calculating the proportion of survey completions, and it is likely some of the
apparent improvement comes simply from the fact that some programs may not have been
offering the survey to clients consistently. Lastly, differences between the two clinics exist and
staff interviews suggest differences in culture may be responsible for lower employee morale and
motivation. In order to effectively improve the survey collection process, it will be important to
address these organizational processes.
While the study was unable to measure why clients decided not to participate and
information on client demographics and language and literacy barriers provided by clinic staff are
anecdotal, efforts to improve future response rates should include questions that help gather
client-specific data for the clinic population, so that more targeted interventions can be designed
to reduce the rate of non-response. Other opportunities for improvement include redesign of the
survey instrument, keeping common barriers for completion (such as low literacy, language
preference, LEP and use of interpreters) in mind. When redesigning the survey tool, it will be
important for Orange County to set clear goals and objectives so that the questions and format
are the most appropriate for gathering information and detail for data needs. Tools that will be
useful to the health department are the various pre-tested survey questions for satisfaction
Facilitating Client Participation in Satisfaction Surveys
Page 22 of 31 Figure E. Factors affecting response rates, highlighted in this study
Methodological Factors
Asking patients to participate Offering a computer-based option Providing incentives to staff
Study Limitations
It is important to note a number of limitations of this study. While interventions
demonstrated improvements in response rates, tested approaches may not be effective in getting
all of those who chose not to complete a survey to do so even after improvements are made. This
point is important to note as, without having demographic data, we are only able to assume some
of the demographic composition of the sample based on the language preference of completed
surveys, which is likely not representative of the clinic population.
A second limitation of note is the difference in organizational factors between the two
clinic locations. While staffing levels were similar in normal periods at both locations, the Southern
Clinic location saw a significant increase in client encounters, while simultaneously scheduling
appointments during a period when nurse practitioners were available for fewer hours. The Response
Rate Organizational Factors
Absenteeism
Staff ability and willingness to participate
1
2
Client Factors
Population demographics Language and literacy barriers Unknown reasons for non-response
Page 23 of 31 differences in setting are likely to have had some effect on the results and for this reason are
important to note (Shadish et al, 2002). A complication for collecting surveys arose for questions
regarding satisfaction with interpreter services, when it was the interpreter administering the
survey in coordination with the nurse, nutritionist or physician.
A third limitation to this study involves what we were and were not able to measure in
light of administrative constraints. Most prominently, we do not know exactly why people chose
not to complete a survey, per se, with the exception of surveys collected through the Nutrition Program in which surveys were marked “LEP” – surveys are not currently available in Karen or
other languages of preference – when individuals were not able to complete a survey in Spanish or
in English. In addition, in the case of those identified as low-literacy, complicated questions arose
regarding how to collect responses while honoring the client’s privacy. Again, the proportion of
such clients among the total client population is unknown at this time, so the impact of missing
input from these populations is unclear and further study would prove beneficial to understanding
satisfaction levels of those who may have the most difficulty accessing health care.
Recommendations for Leadership
From a leadership perspective, the recommendations presented above are useful for
informing staff of the various considerations for ensuring improvement in quality measures, such
as satisfaction survey response rates. However, both the literature and clinical practices have
found a transformational leadership approach to be essential for building and maintaining quality
improvements and assuring organizational effectiveness.
As Bass and Avolio (1991) explain, transformational leadership exists when leaders inspire
staff to view their work from new perspectives, are aware of the organization’s mission and vision,
Facilitating Client Participation in Satisfaction Surveys
Page 24 of 31 that will instead benefit the group and organization. By focusing on the individual and motivating
the group to work toward a shared vision, the organization is better equipped to address cultural
and structural changes that may be needed when improving programs and services.
For example, while external factors, such as accreditation standards apply pressure to
organizations seeking to improve programs and services, oftentimes it is the internal situational
context of an organization that determines whether potential changes will ultimately be effective
(LeBrasseur and colleagues, 2002). A transformational leadership style has been shown to support
cultural changes when leadership creates a strong link between the organization’s vision, strategy
and quality improvement. Using this leadership approach, training and education regarding the
importance of quality improvement is not only supported, but encouraged. When done
effectively, staff have a clear understanding of organizational values and how improvements are
aligned with these values to justify necessary changes to activities.
Senior leadership’s influence over other internal factors, including structuralchanges
within a health care setting are made possible by fostering the potential for teamwork during
change. Previous studies have shown this approach to work particular well in program settings,
but in more structured, clinical settings, leaders may encounter discipline-based barriers such as
“turf wars” that hinder progress and collaboration (Weiner and colleagues, 1997). In these cases,
clear leadership from senior management, key middle managers and staff is critical in organizing
around a common goal. Reviews of hospital settings have also found physician participation in
training, project teams and identifying clinical conditions and procedures for improvement
promoted quality improvement changes (Blumenthal & Edwards, 1995).
Overall, the role of transformational leadership, particularly within a clinic culture where
Page 25 of 31 appropriate consideration to ensuring an organization’s success in quality improvement. By
directly engaging staff throughout the process and providing clear direction on how changes align
with organizational goals and values, organizational change and improvement to programs and
services may begin to occur.
Summary
When we ensure response rates are representative of the target population, informed
decisions can be made that impact the way programs and services are delivered, ultimately
ensuring the needs of the population are met. Interventions to improve survey delivery methods
are promising, yet attention must be given to other causal factors such as those occurring at the
organizational and client level. Once these factors, which may be unique to each organization, are
understood improvements can be made to increase client response. This study found simply
asking clients to participate and establishing a consistent method for distribution and collection of
surveys improves response rates. A transformational leadership approach encourages and
promotes adoption of changes which ultimately help improvements to stick and for the
organization to be more effective. Lastly, understanding the demographics and potential barriers
affecting client participation will ultimately help inform and guide program improvements so that
the needs of all are being met. When this is done effectively, in theory, an organization should
have a mechanism in place for gathering feedback that is representative of the target population
so that continuous improvements can be made.
Acknowledgments
This research project would not have been possible without the support of many people.
Facilitating Client Participation in Satisfaction Surveys
Page 26 of 31 Orange County, for her review, guidance and leadership, and for generously allowing staff time to
be dedicated toward this project. The efforts of Susan Young and the Orange County Health
Department clinic staff for conducting the surveys upon which this paper is based are especially
appreciated. To my advisor, Dr. Anna Schenck, whose careful review, support and direction
improved not only this project, but furthered my understanding, much appreciation is owed. To all
I am extremely grateful.
Appendices
A. Orange County Health Department Client Satisfaction Survey
Page 27 of 31
References
Armenakis A, Harris S, & Mossholder K. (1993). Creating Readiness for Organizational Change.
Human Relations. 46(6); 681 – 703.
Baruch Y & Holtom B. (2008). Survey response rate levels and trends in organizational research.
Human Relations. 61: 1139-1160.
Bass B & Avolio B. (1994). Organizational Effectiveness through Transformational Leadership.
Thousand Oaks, California. Sage Publications.
Benger J & Taylor C. (2004). Client satisfaction in emergency medicine. Emergency Medicine Journal. 21: 528-532.
Blumenthal D & Edwards JN. (1995). Involving Physicians in Total Quality Management: Results of
a Study. In Blumenthal D & Scheck AC (Eds.) Improving Clinical Practice: Total Quality Management and the Physicians. San Francisco: Jossey-Bass, pp 229-266.
Carr-Hill R. (1992). The Measurement of Client Satisfaction. Journal of Public Health Medicine. 14(3): 236-249. Accessed 28 October 2012 from
http://jpubhealth.oxfordjournals.org/content/14/3/236.full.pdf+html
Crow et al. (2002). The measurement of satisfaction with healthcare: implications for practice
from a systematic review of the literature. Health Technology Assessment. Accessed 4 November 2012 from www.ncchta.org
Cohen G, Forbes J & Garraway M. (1996). Can different client satisfaction survey methods yield
consistent results? Comparison of three surveys. BMJ. Accessed 3 November 2012 from
http://www.bmj.com/content/313/7061/841
Facilitating Client Participation in Satisfaction Surveys
Page 28 of 31 Earp J & Ennett S. (1991). Conceptual Models for Health Education Research and Practice. Health
Education Research Theory & Practice. 6(2): 163-171.
Fox R, Crask M & Jonghoon K. (1988). Mail survey response rate. A meta-analysis of selected
techniques for inducing response. Public Opinion Quarterly. 52: 467-491.
Frohlich M. (2002). Techniques for improving response rates in OM survey research. Journal of Operations Management. 20: 53-62.
Johnson T & Wislar J. (2012). Response rates and nonresponse errors in surveys. JAMA. 307(17): 1805-1806.
Kaplowitz M, Hadlock T & Levine R. (2004). A Comparison of Web and Mail Survey Response Rates.
Public Opinion Quarterly. 68(1): 94 – 101.
Korsch BM, Gozzi EK and Francis V. (1968). Gaps in doctor-client communication. Pediatrics. 42: 855. Accessed 28 October 2012 from
http://pediatrics.aappublications.org/content/42/5/855.full.pdf+html
Kviz F. (1977). Toward a standard definition of response rate. Public Opinion Quarterly. 41: 265-267.
Larsen DE & Rootman I. (1976). Physician’s Role Performance and Client Satisfaction. Social Science Medicine. 10: 29-32. Accessed 28 October 2012 from
http://www.sciencedirect.com/science/article/pii/0037785676901360
LeBrasseur R, Whissell R & Ojha A. (2002). Organisational Learning, Transformational Leadership
Page 29 of 31 Lueptow L, Mueller SA, Hammes RR, & Master LS. (1978). The impact of informed consent
regulations on response rate and response bias. In Alwin D (Ed.) Survey Design and Analysis. Sage Publications, Beverly Hills, pp. 59-81.
North Carolina Institute for Public Health. (2010). Health Department Self-Assessment Instrument
(HDSAI): Interpretation Document. Accessed 28 October 2012 from
http://nciph.sph.unc.edu/accred/health_depts/materials/Interpretation_9_24_10.pdf
Orange County. (2012). Welcome to Orange County! Accessed 3 November 2012 from
http://www.co.orange.nc.us/OCCLERKS/About.asp
Orange County Health Department & Healthy Carolinians of Orange County. (2011). Community
Health Assessment. Accessed 3 November 2012 from www.co.orange.nc.us
Porter S. (2004). Raising response rates: what works? New Directions for Institutional Research. 121: 5-21.
Shadish, Cook & Campbell. (2002). Experimental and Quasi-Experimental Designs for Generalized
Causal Inference. Boston, MA: Houghton Mifflin.
Trout A, Magnusson AR, Hedges JR. (2000). Client Satisfaction. Investigations in the emergency
department: what does the literature say. Academic Emergency Medicine. 7: 695-709. University of Wisconsin Population Health Institute. (2012). County Health Rankings. Accessed 13
November 2012 from
http://www.countyhealthrankings.org/app/north-carolina/2012/orange/county/1/overall
U.S. Census. (2010). American Fact Finder 2. Accessed 13 November 2012 from
Facilitating Client Participation in Satisfaction Surveys
Page 30 of 31 Van Horn P, Green K, & Martinussen M. (2009). Survey response rates and survey administration
in counseling and clinical psychology. Educational and Psychological Measurement. 69(3): 389-403.
Weiner B, Shortell S & Alexander J. (1997). Promoting Clinical Involvement in Hospital Quality
Improvement Efforts: The Effects of Top Management, Board and Physician Leadership.
Clinic Program:
As part of our effort to improve our services, we would like your input about your experience in our clinics. Please respond to the following questions by checking the boxes that best match your answers. Your responses will be confidential and will not impact your ability to receive services at our clinics. Thank you.
AGREE DISAGREE NOT SURE
1. The location of the clinic is convenient for me.
2. It is easy to contact the clinic by phone.
3. It is easy to make an appointment to be seen in clinic. 4. I had to wait too long after checking in before my name was
called.
5. The doctor/nurse I saw today was well informed and professional.
6. The interpreter who helped me today was professional.
(only for clients served by an interpreter)
7. I am satisfied with the amount of time the doctor/nurse spent with me today.
8. It appeared that the interpreter told me all of the information that the staff said.(only for clients served by an interpreter)
9. It appeared that the interpreter told the staff everything that I said. (only for clients served by an interpreter)
10. The doctor/nurse explained all tests and procedures in a way I was able to understand.
11. The clinic staff respected and protected my confidentiality at all times.
12. The clinic staff were pleasant and helpful to me.
13. The hours of the clinic are convenient for me.
14. Overall, I am satisfied with my visit today.
15. If you could go anywhere for your health care, would you come back to our clinic or go someplace else? Please check one. Come here Go someplace else Not sure
16. If you chose “go someplace else,” where would you go and why? _____________________________
17. What could we do to improve the services for clients at our clinic? _____________________________
18. I would like to see the following things changed:
19. Please share anything else you would like us to know about your experience in the space below.
ENCUESTA DE LA OPINIÓN DEL CLIENTE
Ubicación del Departamento de Salud: Chapel Hill Hillsborough Fecha:
Programa de la Clínica:
Como parte de nuestro esfuerzo para mejorar nuestros servicios, nos gustaría que nos diera su opinión sobre su experiencia en nuestras clínicas. Por favor conteste las siguientes preguntas al marcar las casillas con su respuesta. Sus respuestas son confidenciales y no afectarán los servicios que recibirá en nuestras clínicas. Gracias.
Sí No No estoy seguro
15. La clínica está convenientemente situada para mí.
16. Es fácil comunicarse con la clínica por teléfono.
17. Es fácil hacer una cita para que me atiendan en la clínica.
18. Tuve que esperar demasiado tiempo después de registrarme antes de que fuera mi turno.
19. El doctor/enfermera que me atendió hoy está muy bien informado y se comportó como profesional. 20. El intérprete actuó profesionalmente. (Solamente para
los clientes que recibieron los servicios de un intérprete.) 21. Estoy satisfecho con el período de tiempo que el
doctor/enfermera me dedicó hoy.
22. Me pareció que el intérprete me dijo toda la información que el personal dijo. (Solamente para los clientes que recibieron los servicios de un intérprete.) 23. Me pareció que el intérprete les dijo al personal todo
lo que yo dije. (Solamente para los clientes que recibieron los servicios de un intérprete.)
24. El doctor/enfermera me explicó todas las pruebas y procedimientos claramente.
25. El personal de la clínica actuó con discreción y protegió mi confidencialidad durante mi visita entera. 26. El personal de la clínica me trató agradablemente y
amablemente.
27. El horario de la clínica es conveniente para mí.
28. En general, estoy satisfecho con mi visita el día de hoy.
15. Si pudiera ir a cualquier lugar para recibir atención médica, ¿regresaría a nuestra clínica o iría a algún otro lugar? Por favor seleccione una respuesta. Vendría aquí Iría a otro lugar No estoy seguro
16. Si escogió “Iría a otro lugar”, ¿adónde iría y por qué? _______________________________________
17. ¿Qué podemos hacer para mejorar los servicios para nuestros clientes? _______________________
18. Me gustaría que cambiaran lo siguiente:
19. Por favor comparta cualquier otra cosa que quiera que sepamos sobre su experiencia a continuación.
1 of 17
1. In the last four weeks, which clinic did you work at more?
Response Percent
Response Count
Chapel Hill (Southern) 42.3% 11
Hillsborough (Whitted) 38.5% 10
Neither; I worked equal time at both 19.2% 5
answered question 26
2 of 17
2. Survey Collection Study
Strongly agree Agree Neither agree or
disagree Disagree Strongly disagree
Response Count
I understood the instructions (email
from Jessica) on how to ask clients
to complete the survey.
42.9% (9) 52.4% (11) 4.8% (1) 0.0% (0) 0.0% (0) 21
I felt comfortable asking every
client to complete the survey at the
end of their visit.
23.8% (5) 28.6% (6) 33.3% (7) 9.5% (2) 4.8% (1) 21
I had an easy time remembering to
ask clients to complete the survey. 9.5% (2) 47.6% (10) 19.0% (4) 23.8% (5) 0.0% (0) 21
The green reminders were helpful. 14.3% (3) 28.6% (6) 52.4% (11) 0.0% (0) 4.8% (1) 21
My schedule did not affect my
ability to ask clients to complete
the survey (e.g., you did not feel
rushed)
4.8% (1) 38.1% (8) 19.0% (4) 38.1% (8) 0.0% (0) 21
Language barriers did not affect
my ability to ask clients to
complete the survey.
4.8% (1) 47.6% (10) 9.5% (2) 19.0% (4) 19.0% (4) 21
I felt supported by management. 9.5% (2) 71.4% (15) 19.0% (4) 0.0% (0) 0.0% (0) 21
Satisfaction surveys are a valuable
tool for helping us make
improvements to client care and
service.
28.6% (6) 61.9% (13) 9.5% (2) 0.0% (0) 0.0% (0) 21
answered question 21
3 of 17
Response Count
10
answered question 10
skipped question 16
4. Survey Collection Study
Strongly agree Agree Neither agree or
disagree Disagree Strongly disagree
Response Count
It was easy for me to access the
survey on the computer. 9.5% (2) 42.9% (9) 42.9% (9) 4.8% (1) 0.0% (0) 21
I felt comfortable offering clients a
computer or paper survey option. 19.0% (4) 42.9% (9) 33.3% (7) 4.8% (1) 0.0% (0) 21
Using a computer for client
surveys is a good idea. 14.3% (3) 47.6% (10) 28.6% (6) 4.8% (1) 4.8% (1) 21
answered question 21
4 of 17
5. Could anything have been changed to make the computer option easier for you and clients to use?
Response Count
7
answered question 7
skipped question 19
6. Survey Collection Study
Strongly agree Agree Neither agree or
disagree Disagree Strongly disagree
Response Count
The clinic incentives motivated me
to get more client surveys
completed.
4.8% (1) 38.1% (8) 42.9% (9) 9.5% (2) 4.8% (1) 21
Using clinic incentives to improve
the number of client surveys
completed is a good idea.
4.8% (1) 52.4% (11) 42.9% (9) 0.0% (0) 0.0% (0) 21
answered question 21
5 of 17
Response Count
9
answered question 9
skipped question 17
8. Survey Collection Study
Strongly agree Agree Neither agree or
disagree Disagree Strongly disagree
Response Count
It was easy going back to the way
we used to collect surveys. 4.8% (1) 14.3% (3) 76.2% (16) 4.8% (1) 0.0% (0) 21
The way we used to collect
surveys is just as good as any
other option we tried during the
study.
4.8% (1) 14.3% (3) 61.9% (13) 19.0% (4) 0.0% (0) 21
answered question 21
6 of 17
9. Overall, how many of your clients have you surveyed since we started the study?
Response Percent
Response Count
None 9.1% 2
A few 31.8% 7
Roughly half 27.3% 6
Almost all 22.7% 5
All 9.1% 2
answered question 22
7 of 17
Response Percent
Response Count
1.
100.0% 16
2.
75.0% 12
3.
56.3% 9
answered question 16
skipped question 10
11. Did you survey more clients during the study than you usually did before the study?
Response Percent
Response Count
Yes 61.9% 13
No 38.1% 8
answered question 21
8 of 17
12. Are there any other ways we can improve the survey, or survey collection process?
Response Count
10
answered question 10
9 of 17
2 I was not involved in the survey Aug 20, 2012 4:02 PM
3 although everybody should offer it to clients it will be easier for one person to take the lead and make sure client complete the survey.
Aug 16, 2012 1:45 PM
4 shorter survey with only 3 to 5 questions Aug 16, 2012 11:58 AM
5 Please continue the computer based survery. I think that helped to increase response rates. Also, it is difficult to get Burmese, Korean, Chinese speaking clients to complete the survery. In addition, some of our spanish speaking clients are illiterate, making the completion of the survery difficult/impossible.
Aug 16, 2012 11:04 AM
6 Given it to them upon check out to complete before leaving, or to mail back. Sending to them via email to complete in privacy of own home. Not particularly conducive to being completed frankly when being handed to OCHD staff (no anonymity).
Aug 16, 2012 10:09 AM
7 no Aug 16, 2012 10:02 AM
8 We need to consider the clients that speak Burmese & Karen as well as the other languages that present to OCHD Aug 16, 2012 9:59 AM
9 Make the survey just a bit shorter. Slimming off 2-3 questions would have been helpful after the client had a 1 hour visit with me.
Aug 16, 2012 9:56 AM
10 As I expressed earlier, I would like to work together to address the literacy and language barriers, and to create a reliable and valid way to collect feedback on interpreter services.
10 of 17
Page 3, Q2. Could anything have been changed to make the computer option easier for you and clients to use?
1 None of my clients wanted to use the computer. I don't think the access was an issue. Aug 22, 2012 4:27 PM
2 I was not involved in the survey Aug 20, 2012 4:02 PM
3 the location of the computers Aug 16, 2012 11:59 AM
4 Completing survey on their own computer in their home. Aug 16, 2012 10:11 AM
5 I think the computer survey was a really good idea b/c the majority of our clients did it best on the PC Aug 16, 2012 10:03 AM
6 It would need to be in Burmese or Karen, etc Aug 16, 2012 10:00 AM
7 I think it would be interesting to explore computer/audio collection method (for those who are low literacy and who are LEP).
11 of 17
2 Not involved in the survey Aug 20, 2012 4:03 PM
3 remembering to offer and not overlap other staff asking the client the same thing. Aug 16, 2012 1:46 PM
4 some clients couldn't read Aug 16, 2012 12:00 PM
5 Time----Various other forms client had to fill out Aug 16, 2012 11:34 AM
6 Language barriers with LEPs except Spanish speakers. Time constraints. Aug 16, 2012 11:30 AM
7 Low literacy level of some clients Aug 16, 2012 10:55 AM
8 Incentives for clients? Aug 16, 2012 10:12 AM
9 I think having the nurses hand the survey client was a better idea. When surveys are handed out by MOAs clients attempt to complete them prior to seeing the doctor or other clinical staff.
13 of 17
1 having enough time. Aug 21, 2012 8:42 AM
2 not convient for me to collect surveys Aug 20, 2012 4:04 PM
3 Client couldn't read Aug 16, 2012 12:03 PM
4 Time Aug 16, 2012 11:36 AM
5 Language barriers except Spanish. Aug 16, 2012 11:32 AM
6 level of busyness in clinic Aug 16, 2012 11:12 AM
7 LEP Clients Aug 16, 2012 11:05 AM
8 clients too ill, didn't feel well enough to complete Aug 16, 2012 10:59 AM
9 not much clinic time Aug 16, 2012 10:23 AM
10 Language barrier Aug 16, 2012 10:15 AM
11 minimal client contact Aug 16, 2012 10:13 AM
12 got to busy Aug 16, 2012 10:06 AM
13 language barrier Aug 16, 2012 10:02 AM
14 I heard that Telelanguage was a barrier - I think we need to develop an alternative way to collect the information from our LEP (and low literacy) clients in a valid and reliable way
Aug 16, 2012 10:00 AM
15 A place to send them to fill out the survey without me in the office. (Typically they did not want to return to the waiting room)
Aug 16, 2012 9:59 AM
16 language barrier Aug 16, 2012 9:55 AM
14 of 17
Page 6, Q1. If you could list three things that prevented you from collecting surveys from clients, what would they be?
1 survey needs to be given at check-in and reminded at check-out and or the clinician can remind the client to complete prior to leaving
Aug 21, 2012 8:42 AM
3 Client prefered not to Aug 16, 2012 12:03 PM
4 Other Forms that had to be filled out Aug 16, 2012 11:36 AM
5 Time constraints. Aug 16, 2012 11:32 AM
6 forgetfulness Aug 16, 2012 11:12 AM
7 Illiterate Clients Aug 16, 2012 11:05 AM
8 clinic staff shortage Aug 16, 2012 10:59 AM
10 Time constraints Aug 16, 2012 10:15 AM
11 language barrier Aug 16, 2012 10:13 AM
12 they could not read/write Aug 16, 2012 10:06 AM
15 Clients needing to leave after the 1 hour appt and not wanting/having time to fill it out. Aug 16, 2012 9:59 AM
16 remembering to give them the survey Aug 16, 2012 9:55 AM
3.
3 No contact with client at the end of his/her appointment Aug 16, 2012 12:03 PM
5 Felt a little uncomfortable asking adding time to pts appointments. Aug 16, 2012 11:32 AM
6 not wanting to aggravate clients Aug 16, 2012 11:12 AM
7 Clients coming in with sensitive/serious health issues. Aug 16, 2012 11:05 AM
8 I was involved in extensive management tx/co that I forgot to ask Aug 16, 2012 10:59 AM
15 of 17
15 Unable to use the computer version since there is a laptop in the office vs desk top. Aug 16, 2012 9:59 AM
17 of 17
2 Having comment boxes available all the time for client fill if they want to comment on a positive or negative experience at the clinic including, date, time, location and ay other information the client will ike to share. Having one person
designated to only do survey maybe one or the two days at each site.
Aug 16, 2012 12:07 PM
3 Offer incentive to the client for filling out the survey Aug 16, 2012 11:37 AM
4 Continue the computer option Aug 16, 2012 11:05 AM
5 I like the paperless format. Aug 16, 2012 11:00 AM
6 Haven't been involved in the customer survey process here before. Have been at other medical facilities. Not having been involved in the design of the survey, I don't know what specific information the survey was trying to obtain. If it was just general information most of the survey was fine. If it was to reveal areas of need, more specific responses would have been helpful, such as "How long did it take to schedule your appointment?", "How soon was an appointment available?", "How long was you entire visit today?", "How long did you wait to check in, (to be called after checking in, and to check out)?" #4 Should not have worded in the negative but rather in positive as the rest of survey ("I am satisfied with the time spent waiting after checking in before my name was called.) And numbers 6,8,&9 should have been grouped together at the bottom since they only needed to be completed by those receiving the services of an interpreter and could be skipped by others. Aren't #17 &18 asking essentially the same question? More up front preparation of staff prior to next survey to explain the process and purpose, and answer questions may result in more buy in. If one can't see the benefit less likely to support.
Aug 16, 2012 10:55 AM
7 no Aug 16, 2012 10:06 AM
8 Need surveys in Burmese, Karen, Korean, Aug 16, 2012 10:04 AM
9 I think it would be helpful to have OCHD examine and assess the ways clients are surveyed across the divisions -including Environmental Health, Family Home Visiting, Dental.
Aug 16, 2012 10:02 AM