Methods to evaluate the performance of kilovoltage
cone-beam computed tomography in the
three-dimensional reconstruction space
INTRODUCTION
Advances in the radiotherapy techniques over the past decades, such as intensity-modulated radiotherapy (IMRT) and stereotactic body radiotherapy (SBRT), have promoted the widespread applications of image-guided radiation therapy (IGRT) in clinic to ensure that
high-precision techniques are delivered as planned (1-3).Frequent imaging during the course of image-guided radiotherapy, is becoming a
crucial requirement to monitor internal geometric variations and correct positioning errors (4-6).
Recently, a steady stream of imaging systems such as electronic portal imaging device (EPID) (7) , fan-beam CT (8,9), cone-beam computed tomography (CBCT) (10,11),, 2D and 3D ultrasound systems (12,13) and optical systems (14), have been commercially introduced to improve treatment guidance. Among the recent IGRT techniques, the CBCT device with a kilovoltage X-ray source
J. Zhang
#, Z.R. Bao
#, X.T. Huang, D.Z. Jiang, C.H. Xie, Y.F. Zhou,
H. Liu
*Department of Radiation and Medical Oncology, Zhongnan Hospital of Wuhan University; and Hubei Radiotherapy Quality Control Center, Wuhan University, Hubei, China
ABSTRACT
Background: Cone-beam computed tomography (CBCT) scanners for image
-guided radiotherapy are in clinical use today, but there has been no consensus on uniform acceptance to verify the CBCT image quality yet. The present work proposed new methods to fully evaluate the performance of CBCT in its three-dimensional (3D) reconstruction space. Materials and
Methods: Compared to the traditional methods with only two-dimensional axial
slice evaluated, the new methods were designed to evaluate the CBCT image quality not only in the axial slices but also along three dimensions and three sections. Image parameters were evaluated by scanning the corresponding phantom. Results: The new methods demonstrated the high spatial resolution, the image uniformity, the high CT numbers linearity, geometric accuracy and relatively poor performance in low contrast resolution, compared to the results of plan CT. Additionally, the spatial resolution, the CT number linearity and the image uniformity proved to be more superior along the z direction and in the cross-section. Furthermore, the spatial resolution and the CT value linearity decreased gradually when deviating from the center of rotation axis and acceleratesthereduction towards the periphery area, suggesting that locating the target within the range of 4 cm around the isocenter during radiotherapy ensure the optimal spatial resolution and the CT value linearity.
Conclusion: Results indicate that the proposed three-dimensional image
quality evaluation holds the potential to complement existing standards to provide sufficient information for the CBCT image performance and thereby guidingthe clinicalapplications of CBCT.
Keywords: Image quality; CBCT; three-dimensional. *Corresponding authors:
Dr. Liu Hui,
Fax: + 86 1387 101 5273
E-mail:
[email protected] Revised: April 2018
Accepted: June 2018
Int. J. Radiat. Res., April 2019; 17(2): 189-202
►
Original article
DOI: 10.18869/acadpub.ijrr.17.2.189
#Both authors contributed equally to this work.
and a flat-panel detector mounted orthogonally on the linear accelerator represents a very promising technology (15,16). The use of CBCT
allows online image guidance based on reconstructed volumetric anatomic information
and also manages interfractional motion and
setup errors (17,18). Moreover, with the amorphous silicon X-ray detector mounted on
the accelerator, this type of IGRT technique may occupy a relatively small amount of space (19). Therefore, the CBCT system has a potential to become a powerful tool to improve the precision of radiotherapy.
However, the successful implementation of this new technology may be compromised by a lack of uniform acceptance and constancy tests for image quality performance (20,21) since the
image quality may affect the reliability and accuracy of manual or automatic image registration algorithms and thereby directly influences the accuracy of the image-guided process. To date, the traditional image quality evaluation methods developed for conventional/ spiral CT are still used to access the performance of CBCT, with only 2D axial reconstructed slice evaluated (22,23). But since CBCT provides 3D volume reconstruction with one circular rotation and doctors may choose to examine the images at any arbitrary orientation, the evaluation merely within the axial reconstructed slice seems not sufficient to access the CBCT image quality in clinical practice. Furthermore, the
guideline documents, provided by linac manufacturers or proposed in the AAPM TG-66
report (24), include a check of image quality and geometric distortion but are not generally able to characterize CBCT system performance in the
three dimensions sufficiently. A series of previous studies (25) also developed their own
quality assurance (QA) methods but were not generally consistent with one another.
Therefore, it is necessary to develop new methods to fully evaluate the CBCT image quality. In the present work, we proposed new methods to fully evaluate the performance of
CBCT in its three-dimensional (3D) reconstruction space. Herein, essential image
quality parameters, including spatial resolution, CT value linearity, image noise and uniformity,
190
cone-beam geometry distortions and low contrast resolution, were evaluated by the traditional methods and new evaluation methods respectively by scanning the corresponding phantom. Compared to the traditional methods with only two-dimensional axial slice evaluated, the new methods were designed to evaluate the CBCT image quality not only in the axial slices but also along three dimensions and three sections (cross-section, sagittal and coronal planes). The evaluation results with new methods are compared to the results with traditional methods to show the differences and improvements.
MATERIALS AND METHODS
System description and phantom design
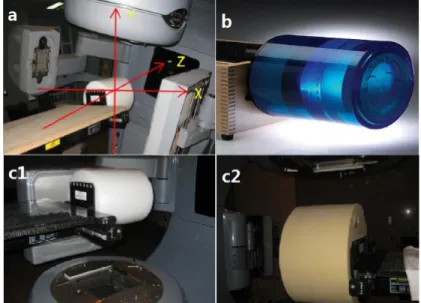
With a kilo-voltage X-rays resource and an amorphous silicon flat panel detector, the CBCT system is mounted perpendicular to the gantry of the Varian 23EX linear accelerator (figure 1a). A standard clinical scanning protocol is equipped with two types of Bowtie filters, designed for two different acquisition geometries: the Full-Fan (FF) and Half-Fan (HF)
mode. The Full-Fan mode is mainly used for head scans and allows for a maximum reconstructed field-of-view (FOV) of approximately 25.5 cm, whereas the Half-Fan mode is used for body patients, with a maximum FOV of 45 cm. The two filters are used to compensate for the smaller thickness at the edges of the target volume compared with the central part. The system is rotated with the gantry to obtain CBCT images.
In the present work, essential image quality parameters, including spatial resolution, CT value linearity, image noise and uniformity, cone -beam geometry distortions and low contrast
resolution, were evaluated in CBCT with traditional 2D methods and new 3D methods
using phantoms. Specifically, a 20cm-diameter
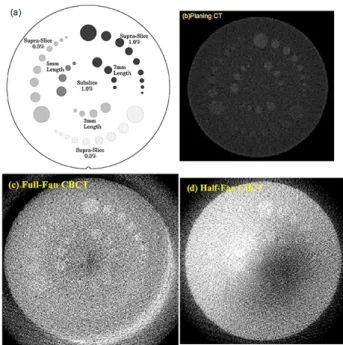
Catphan® 504 phantom (The Phantom Laboratory, Salem, NY, USA) with different inserts (figure 1b) was employed mainly for traditional image quality evaluation methods. For the new 3D methods, the Normal Phantom (Varian Medical Systems, Inc., of Palo Alto,
California) (figure 1c) and some self-made phantoms (figure 6b) were introduced to measure the major image quality factors in the
3D space. Details about the evaluation methods for each image quality factor are described below.
191
Figure 1. The CBCT system and the phantom used in the experiment. (a) Varian 23EX linear accelerator is mounted with a kilo-voltage X-rays resource and an amorphous silicon flat panel detector. When facing the accelerator with the gantry pointing
down, the coordinate system follows the description below. x-axis = lateral direction(+Right/-Left), y-axis = vertical direction (+Up/-Bottom), z-axis = longitudinal direction(+anterior/-posterior). (b) Sketch of the Catphan® 504 phantom. (c) The Normal Phantom for the evaluation of image noise and uniformity (c1) The head phantom for the full-fan mode (c2) The body phantom for
the half-fan mode.
The test module for spatial resolution
The CTP528 module in the Catphan® 504 phantom was usually used to evaluate the spatial resolution of a CT system, with a 21 line pair/cm
(Lp/cm) high resolution test gauge for the traditional methods and the modulation transfer
function (MTF) measurement (26) for the new methods. By scanning a high contrast phantom containing two tungsten beads, the 2D spatial
frequency response characteristics of the imaging system, namely, the point spread function (PSF), was estimated. MTF of a system
could be obtained by calculating the Fourier transform of its PSF. Defined as the ratio of the output modulation to the input modulation of an imaging system, MTF measures the system response to different frequencies. The higher the MTF value, the better the spatial resolution.
Overall, the traditional methods used 21Lp/ cm test gauge to study the high-contrast spatial resolution in the axial slice while the new methods evaluated the image performance by
computing the MTF curves in different positions along the x, y, z axes and three sections.
The test module for CT value linearity
The CTP404 module (figure 3a) contains seven high contrast sensitometric targets with known linear attenuation coefficient to provide CT number linearity.
A supplementary description of the methods used to acquire the data of CT number linearity in 3D space was given as follows. For example, this work first scanned the CTP404 module in the cross-section, and then the phantom was
rotated through 90 degrees so the CP404 module lay in the sagittal plane to obtain the
“Sagittal” results. Additionally, the module was scanned at different radial positions, e.g. r = 0cm, 3cm and 6cm, as well as at different z positions, z = -4cm, 0cm and 7cm to measure the CT number linearity along the radial and z direction. The radial distances were carefully chosen to make sure the phantom was still in the field of view of Figure 1. The CBCT system and the phantom used in the experiment. (a) Varian 23EX linear accelerator is mounted with a kilo-voltage X-rays resource and an amorphous silicon flat panel detector. When facing the accelerator with the gantry pointing
down, the coordinate system follows the description below. x-axis = lateral direction(+Right/-Left), y-axis = vertical direction (+Up/-Bottom), z-axis = longitudinal direction(+anterior/-posterior). (b) Sketch of the Catphan® 504 phantom. (c) The Normal Phantom for the evaluation of image noise and uniformity (c1) The head phantom for the full-fan mode (c2) The body phantom for
the half-fan mode.
the detector. Measured CT numbers at each location were plotted as a function of corresponding linear attenuation coefficients.
The test module for image noise and uniformity
The CTP486 module is uniform water-equivalent material whose attenuation is
approximate to water’s attenuation at standard scanning protocols. This module is used to
measure the mean CT values and the corresponding standard deviation (SD) with
the traditional methods in the isocenter plane. For this measurement, the signal intensity was measured in four peripheral regions of interest (ROIs) and one central ROI (figure 4a), with sizes of 10 × 10 mm2, covering approximately
100 pixels. The mean CT value and the corresponding standard deviations in the given
ROIs were calculated.
As mentioned above, the CTP486 module was used to evaluate the performance of the CBCT system by measuring the CT values of the five 2D
ROIs. However, this method might be not suitable for measurement in the 3D reconstruction space in CBCT volumetric imaging system since it is designed for narrow
beam and single slice fan-beam dose measurement (38). To measure the image noise
and uniformity in the 3D reconstruction space, the Normal Phantoms (figure 1c) with diameter of 16 cm (head phantom) and 32 cm (body phantom) were introduced to measure the HU values for the full-fan mode acquisition and the half-fan mode acquisition respectively. More importantly, the five 2D ROIs used in traditional methods was changed to 3D volumes of interest
(VOIs) inside the uniform phantoms as illustrated in (figure 4). The quantitative assessment of image uniformity in 3D reconstruction space was performed by measuring the signal intensity in the VOIs along
each test direction.
The test module for cone-beam geometry distortions
In addition to the seven inserts with known linear attenuation coefficient used to provide CT
number linearity, the CTP404 module also contains four 3-mm-diameter holes, one with a Teflon pin, that are positioned 50 mm apart (figure 6a). The distances between the centers of the holes were measured to verify the geometry distortions.
In addition to being used to access CT number linearity, the CTP404 module could also be used to verify the geometry distortions. For broader evaluations and better simulation study of the impact of the scattered radiation on the organs in the patients (27), a few self-made modules with discernible electron density and sizes (figure 6b)
were designed to measure the geometry distortions in different directions. The different
shapes of the modules are fixed on a solid water slab, with 30cm, 30cm, 5cm respectively in
length, width and height. Measuring the geometry size of the objects in the CBCT images
in comparison with the actual dimensions to access the cone-beam geometry distortions.
The test module for low contrast resolution
Low contrast detectability is tested by scanning the CTP515 module containing supra-slice and sub-slice targets with a variety of
linear attenuation coefficients (figure 7a). These objects have diameters ranging from 2 mm to 15 mm, while the nominal target contrast levels are
as follows: 0.1%, 0.3%, 0.5%, 1.0%. The low contrast resolution is usually expressed as
a percentage. For example, the value of the low contrast detectability in CT is 0.3%, which means
that it fails to distinguish two parts of the organization when the density difference is less
than 0.3%. More commonly, the low contrast
detectability can be calculated using the following equation.
Here, CT, CT surrounding, and CT air indicate, respectively, the CT number of the targets, the local surrounding area and the air.
Measurements
Traditional evaluation methods mainly measured the image quality factors of CBCT in
192
193
the axial slices and thus the corresponding module was aligned with the isocenter of the
CBCT. On the other hand, the new methods evaluated the CBCT image quality not only in the axial direction but also at different locations and thereby the corresponding module was scanned at different positions or planes. However, due to the limitations of the phantom, the author had to re-position the corresponding module to acquire three CBCT volumes and perform measurements on each CBCT volume. The radial distances were carefully chosen to make sure the phantom was still in the field of view of the detector.
During the images acquisition, the phantom was hung from a box and placed on a table. The phantom needed to remain level; then, the table was driven to position the phantom to set the test module at the treatment planning isocenter in accordance with the coordinate system. During the experiment, locating the test module
successively at different positions can inspect the image quality along the axes and three sections. Subsequently, the data were then processed in the Eclipse treatment planning system (TPS) and computed using Matlab 7.0.
All of the measurements were done with both FF mode and HF mode, with an FOV of 25 cm. The beam scanning width range was 17 cm, and the reconstruction matrix was 512×512 pixels. For the two scanning modes, the X-ray tube current was 80 mA, with a voltage of 100 kV for the Full-Fan mode and 125 kV for the Half-Fan mode, both of which are the standard setting. KV -CBCT images were captured at 15 frames per second as the gantry was rotated at 6 deg. per second. The scan time was approximately 1 minute, which is equal to the time for gantry rotation, and a 2.5 mm slice was used as the standard protocol for CBCT reconstruction.
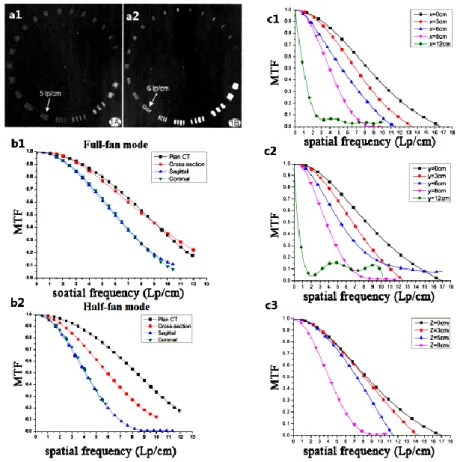
Figure 2. The spatial resolution evaluated with the traditional methods and new methods. (a) The traditional spatial resolution evaluation methods using 21 line pair/cm test gauge. (a1) Half-Fan mode (a2) Full-Fan mode. (b) The MTFs curves of the CBCT system in the cross-section, sagittal and coronal planes, in contrast with the results of plan CT. (b1) Full-Fan mode (b2) Half-Fan mode. (c) MTF curves of the CBCT system along x/y/z axis. (c1) MTF curves of various locations deviating from the isocenter along
the x-axis; (c2) MTF curves along the y-axis; (c3) MTF curves along the z-axis.
194
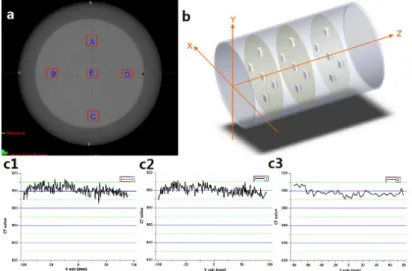
Figure 3. CT values linearity of the CBCT system. (a) The CTP404 module with seven inserts to evaluate CT number linearity. (b)
Comparison of the CT numbers linearity of various distances deviating from the axis of rotation direction: r=0, 3, 6 cm. r is the distance from the rotation axis of the linear accelerator. R2 is the correlation coefficients. (c) Comparison of the CT numbers linearity of various distances deviating from the isocenter: z=-4, 0, 7 cm. (d) The linear attenuation coefficient of seven units,
measured in three planes with different scanning modes. (d1): cross-section. (d2): sagittal plane. (d3): coronal plane.
Figure 4. TheCT value distribution acquired with theplanning CT in three dimensions. (a) Illustration of the ROIs chosen to evaluate image uniformity using the CTP486 module with traditional methods. (b) Illustration of the VOIs chosen to evaluate image uniformity in 3D reconstruction space. (c) TheCT value distribution acquired with theplan CT in three dimensions. (c1): x-axis. (c2):
y-axis. (c3): z-axis.
195
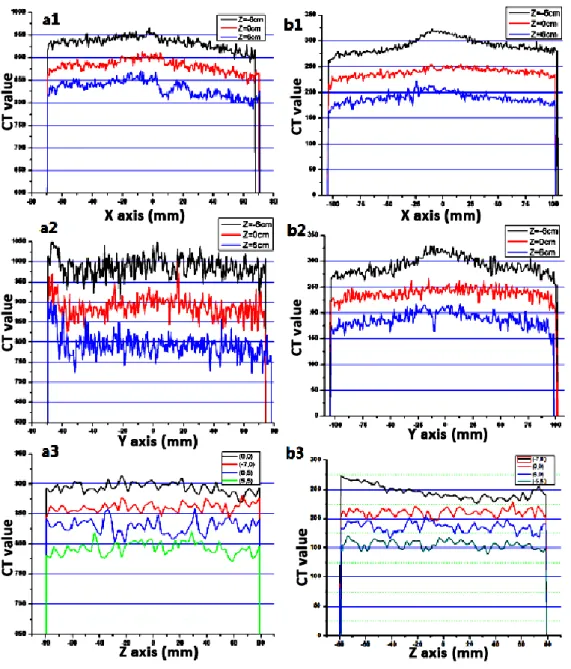
Figure 5. TheCT value distribution acquired with different scanning modes in three dimensions.
(a1) (a2) (a3): Full-Fan mode; (b1) (b2) (b3): Half-Fan mode. (a1)(b1): x-axis; (a2)(b2): y-axis; (a3)(b3): z-axis.
Figure 6. Themodule used to access cone-beam geometry distortions. (a) The CTP404 module with 2 pair symmetry wire ramps to access cone-beam geometry distortions with traditional methods. (b) The self-made modules with discernible electron density and sizes were designed to measure the geometry distortions in different directions. During the measurements, the modules were fixed on a solid water slab, with 30cm, 30cm, 5cm respectively in length, width and height. Measuring the geometry size of the objects in
the CBCT images in comparison with the actual dimensions to access the cone-beam geometry distortions.
RESULTS
Spatial resolution
Figure 2 illustrated the performance of spatial resolution measured in the system. For
the traditional methods, the half-fan mode and the full-fan mode demonstrated the cutoff frequency to be 5 Lp/cm (figure 2a1) and 6 Lp/ cm, respectively (figure 2a2). Figure 2(b-c) showed the MTF measured in the 3D space. The spatial resolution in three sections showed com-parable results for the two scanning mode, with slightly worse results for the half-fan mode, see (figure 4b). The results also suggested that the scanning modes had a slight impact on the MTF. Compared with the results of the sagittal and
coronal planes, the spatial resolution of the reconstructed image in the cross-section tended
to be higher, approximating the curves of the plan CT.
Figure 4c displayed the x/y/z direction MTF measured at different positions. The frequencies at which the MTF is 0.5(ƒ0.5) was measured as 8.15Lp/cm, 6.84Lp/cm, 5.24Lp/cm, 3.97Lp/cm and 0.65Lp/cm for x = 0cm, ±3cm, ±6cm, ±8cm and ±12cm respectively. The radial location near the isocenter had better spatial resolution than the location near the phantom periphery.
Besides, the spatial resolution along the z direction provided better results, with ƒ0.5 values ranging from 8.15 to 4.09Lp/cm for z =
0cm to ±8cm.
CT value linearity
CT numbers of different materials in the phantom were measured at different locations
and summarized in Figure 3, including the values of the isocenter plane. Figure 3(b-c) illustrated the CT number linearity at different r or z positions. The straight lines at r=0, 3cm and z=0, -4cm represented the linear regression to the inserted equation and validates that the system has good CT number linearity (R2>0.99). When the distances from the center of the rotation axis continued to increase, the coefficients of correlation decreased. Figure 3
(d1-d3) illustrated the CT number linearity in the transverse, sagittal and coronal planes. Even
though all of these curves exhibited high linearity, the results in the cross-section demonstrated better CT number linearity than that of sagittal and coronal planes, with coefficients of correlation generally above 0.98.
Image noise and uniformity
Traditionally, image noise and uniformity was
196
Figure 7. Low contrast resolution with various scanning modes. (a) The CTP515 module; (b) plan CT (GE Light Speed 16);
(c) Full-Fan mode; (d) Half-Fan mode. Slice thickness is 2.5 mm and the window width is narrow.
measured by the CTP486 module which contained uniform material with CT number within 2% of water’s density. Five squared ROIs (A, B, C, D and E) of 0.1 cm2 were outlined to measure the mean and standard deviation in HU
values (figure 4a). Table 1 displayed the measured signal intensity and noise in each of
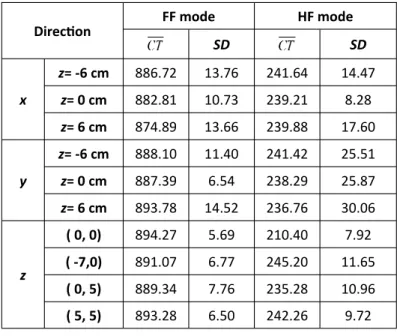
the five ROIs. For the full-fan scan and half-fan scan, the CT value was calculated as: 859.88±7.43HU and 236.6±32.3HU, respectively. Figure 4c showed the CT value distribution of the plan CT acquired with the new methods and table 2 summarized the mean CT values and corresponding standard deviation shown in figure 4c. The average CT value of the plan CT was within ±10 HU along x, y, z directions, denoting a good symmetry and a minor fluctuation. The signal profile of the CBCT system measured in x/y/z direction with the full-fan scan and the half-fan scan was plotted in figure 5. Table 3 listed the mean signal
intensity and the corresponding standard deviation in each direction illustrated in Figure 5. Results for CBCT acquisition were as follows: (i) All CT values at different positions were within the expected range of −50 to +50, demonstrating small noise level in the CBCT system. (ii) The CT values at z=0 and (0, 0) were within the range of −20 to +20, smaller than the standard deviation at other positions. The results indicated the noise level was lower in the
isocenter plane of the phantom than the peripheral area. (iii) The uniformity acquired
with the full-fan scan was better than that of the half-fan scan. Additionally, a large difference of the mean HU values between the full-fan mode acquisition and the half-fan mode acquisition could be seen in Table 3, because the head phantom for the full-fan mode acquisition has higher electron density than the body phantom for the half-fan mode acquisition (figure 1c).
197
ROIs A B C D E Average
SD SD SD SD SD SD
FF mode 850.7 7.37 864.6 8.22 855.7 7.46 860.8 7.97 867.6 6.14 859.88 7.43
HF mode 236.9 30.8 231.6 33.2 240.5 31.6 232.5 33.4 241.7 32.6 236.6 32.3
Table 1. The mean CT values ( ) and the correspondingstandard deviation (SD) acquired with thetraditional methods.
The axis SD
x 901.41 4.85
y 900.40 4.72
z 897.69 3.71
Direction FF mode HF mode
SD SD
x
z= -6 cm 886.72 13.76 241.64 14.47
z= 0 cm 882.81 10.73 239.21 8.28
z= 6 cm 874.89 13.66 239.88 17.60
y
z= -6 cm 888.10 11.40 241.42 25.51
z= 0 cm 887.39 6.54 238.29 25.87
z= 6 cm 893.78 14.52 236.76 30.06
z
( 0, 0) 894.27 5.69 210.40 7.92
( -7,0) 891.07 6.77 245.20 11.65
( 0, 5) 889.34 7.76 235.28 10.96
( 5, 5) 893.28 6.50 242.26 9.72
Table 3. The mean CT values ( ) and correspondingstandard deviation (SD) acquired with different scanning modes inthe CBCT
system in three directions.
Table 2. The mean CT values ( ) and correspondingstandard deviation (SD) acquired with theplan CT in three
dimensions
Geometry distortions
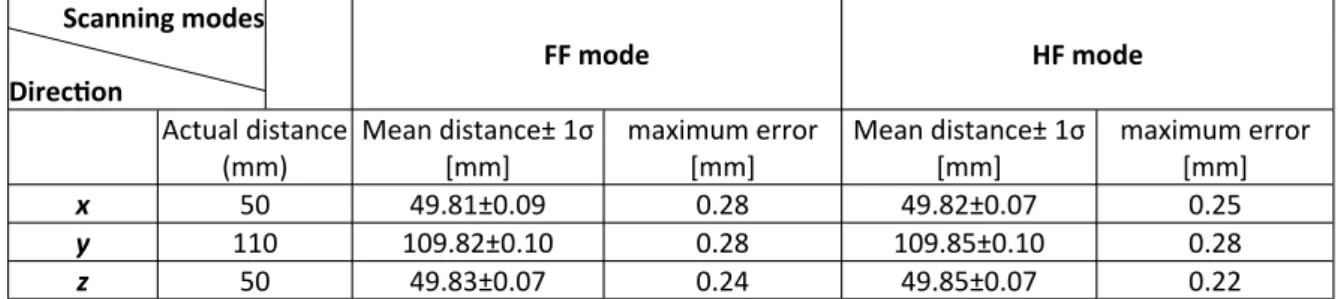
Using the full-fan and half-fan acquisition mode, the measured distances between the holes in the CTP404 module ranged from 49.8 mm to 49.9 mm in the transverse section and from 109.8 mm to 109.9 mm in the sagittal plane, as shown in table 4. Moreover, the accuracy of the magnification for all measurements was within 0.6 mm. additionally,
a few self-made modules with discernible electron density and sizes (figure 6b) were
designed for broader evaluations and better simulation study of the impact of the scattered radiation on the organs in the patients (27). After measuring the geometry size of self-made mod-ules in different directions in comparison with the actual dimensions, high geometric precision was observed, with the maximum margin of error within 0.5%, as shown in table 5. For the two types of scanning modes, T-test showed that there was no statistically significant difference (P<0.05) in the geometric accuracy.
198
Scanning modes Direction
FF mode HF mode
Actual distance (mm)
Mean distance± 1σ
[mm]
maximum error [mm]
Mean distance± 1σ
[mm]
maximum error [mm]
x 50 49.81±0.09 0.28 49.82±0.07 0.25
y 110 109.82±0.10 0.28 109.85±0.10 0.28
z 50 49.83±0.07 0.24 49.85±0.07 0.22
Table 5. Measuring the geometry size of self-made modules in different directions in comparison with the actual dimensions to access the cone-beam geometry distortions
FF mode HF mode
Actual distance(mm) Scanning modes
Mean distance ± 1σ
[mm]
maximum error [mm]
Mean distance ± 1σ
[mm]
maximum error [mm]
150 150±0.3 0.3 149.81±0.34 0.53
100 99.76±0.01 0.25 99.70±0.15 0.45
50(X) 49.68±0.1 0.42 50.35±0.17 0.52
50(Y) 50.37±0.03 0.40 50.28±0.13 0.41
30 29.86±0.29 0.43 30.19±0.19 0.38
Low contrast resolution
For a reasonable assessment of low contrast detectability, a module featuring a series of test
inserts with different contrast levels and diameters was used to scan in the full-fan and
half-fan mode, comparable to images acquired with the planning CT (figure 7). In half-fan mode, the contrast resolution estimated via visual inspection was significantly poorer, e.g., none of the 0.5 % supra-slice contrast targets were discernible in HF mode, whereas 3 to 5 targets were discernible in FF mode. This result
seemed to rely on the fact that a smaller radiation dose was received per unit volume in
the HF geometry and decreased the signal-to-noise ratio (SNR) and thereby the contrast resolution. Sufficient replicates of the testing program indicated small fluctuations in contrast resolution mainly concerned with the variations in image uniformity. Apparently, the existing methods show strong subjectivity, and different users may interpret the same image differently. During the observations, the visual perception of low-contrast detail discrimination varied as the viewing distance changed. Taken together, the results highlight the contrast resolution of 1.0±0.2% with a slice
thickness of 2.5 mm.
199
DISCUSSION
Recent advances in flat-panel detectors, geometric system calibration and reconstruction
algorithm have led to significant of CBCT in clinical applications (28, 29). As an emerging imaging tool to ensure the accuracy of radiotherapy, CBCT needs to provide the 3D images of the scanned anatomy with good and stable image quality to track organ motion and correct setup errors. Therefore, it's necessary to evaluate the imaging performance of CBCT and set up a quality control program to assure the stability of its image quality.
Since CBCT is a relatively new imaging modality compared to conventional/spiral CT,
no standard image quality evaluation methods have been established so far. As described in previous studies, the current CBCT image quality evaluation generally focused on several aspects,
such as developing a quality assurance framework for fully automated and time-efficient performance evaluation (22), evaluating imaging characteristics just within
the axial slice (30,31), and examining long-term stability of the CBCT device (21,32). However, only transverse two-dimensional image quality evaluation metrics were employed in these existing research. But since CBCT provides 3D
volume reconstruction with one circular rotation, the evaluation within the 2D axial reconstructed slice only seems not sufficient for a variety of diagnostic and therapeutic purposes as doctors can choose to examine the sagittal or coronal slices as well. Thus, new methods to evaluate the image quality in all dimensions appear to be required.
In the present study, new evaluation methods were designed to fully evaluate the CBCT image quality not only in the axial slices but only along
the three dimension and three sections (cross-section, sagittal and coronal planes). In
contrast, the traditional 2D methods established for conventional CT were also introduced to measure major image quality factors of CBCT. Compared to traditional methods, new methods fully measuring the image quality in the 3D CBCT reconstruction space would provide more information for the CBCT image performance,
thereby guiding the clinical applications of CBCT. In general, the results measured by the new evaluation method demonstrate the high spatial
resolution, the uniformity of axial reconstructions, the high CT numbers linearity,
geometric accuracy and relatively poor performance in low contrast resolution, compared to the results of plan CT. As one can
notice that, however, the CBCT image performance proved to be not strictly isotropic.
This phenomenon depends critically on the accuracy of the commonly-used FDK algorithm. Based on the circular trajectory, this algorithm handles the available projection data and obtains exact or approximate reconstructions. The features of this reconstruction algorithm (33) are as follows. (1) It is accurate in the isocenter plane (z = 0) because it is identical to the fan-beam reconstruction in this plane and the
reconstruction becomes more and more erroneous for planes that are farther away from
the mid-plane. (2) It is exactly reconstructed for homogeneous objects in the z-direction because
the weighting factor is dependent on the cone-angle. (3) The integral value along the z
direction is preserved. Detailed results by new evaluation method for image quality factors are described below.
First, the spatial resolution, the CT number linearity and the image uniformity were quite different from one axis to another and showed to be more superior along the z direction. Two factors can cause better behavior in CT number linearity and image uniformity along the z axis than the other direction. One is the fact that the FDK algorithm is more sensitive to the detector gain variation along the z axis, and the other is the signal density drop at the axial slices far away from the central reconstruction plane caused by the intrinsic limitation of the FDK algorithm itself (34). Additionally, the spatial resolution decreases gradually when deviating
from the center of rotation axis and accelerates the reduction towards the periphery
area. This is mainly due to the inaccuracy of FDK reconstruction for large cone angle and the increased scattered radiation (28). Overall, the new evaluation method implies that the image performance changes greatly from region to
region and the setup error along the x(y) axis has a significant impact on the image quality
than that along the z axis. Meanwhile it is suggested that we should locate the target within the range of 4 cm around the isocenter during the radiotherapy, thereby acquiring the
optimal spatial resolution and the CT value linearity in this region.
Second, the evaluation of image quality with new method indicated that the spatial resolution and the CT number linearity in the cross-section tends to be higher, compared with the results of the sagittal and coronal planes. This may be related to the scatter issues and FDK reconstruction algorithm (35). The results also
show that the scanning modes have a slight impact on the image quality, with better results in Full-Fan mode than those obtained in Half-Fan scan.
Third, the required contrast resolution for
CBCT is generally looser than that for a diagnostic CT scanner because the diagnostic CT
scan is used to diagnose diseases and identify anatomy, while the IGRT scan is mainly used for
structures localization. However, the poor contrast resolution still suggests that
more attempts are required to improve the image quality. Generally speaking, contrast detectability is highly dependent on object size, reconstructed voxel size, slice thickness, and
imaging technique, of which larger slice thickness uses more photons to produce the
image and thereby increases the signal noise ratio and contrast resolution, whereas a larger pixel size with increasing field of view (FOV) will decrease the spatial resolution and increase the
low contrast resolution. Therefore, it is important to be aware that clinically relevant
parameters must be carefully set and kept constant for quality control checks to optimize the visual subject contrast. To decrease the influence of noise, the window width has to be very narrow (27, 36). Furthermore, the high consistency and precision of CT numbers for the volumetric imaging systems, combined with the corresponding electron density calibration, may suggest the potential of the CBCT images to be applied to the radiation therapy planning system. Additionally, since deviations in scale
and distance accuracy will affect image registration accuracy and reduce patient positioning correction accuracy (37, 39), the assessment of geometric fidelity therefore becomes a critical aspect for CBCT image quality evaluation. Although high geometric precision was observed during the measurements of test
modules of our own manufacture, further exploration about the module design to better
simulate the impact of the scattered radiation on the organs in the patients seems necessary (27) .
Overall, to evaluate the major image quality factors with high reliability and objectivity, new methods should be applied to fully evaluate the 3D reconstruction of CBCT system. The tests have demonstrated that, the volumetric imaging systems still have a long way to go prior to reaching the performance normally expected of conventional CT scanners, especially in terms of low contrast resolution. By optimizing the image quality parameters, reducing scatter radiation, and modifying the reconstruction algorithm, the volumetric imaging systems may gradually approach the quality of conventional CT scanners in the near future.
CONCLUSION
The results measured by the new evaluation
methods demonstrated the high spatial
resolution, the uniformity of axial reconstructions, the high CT numbers linearity,
geometric accuracy and relatively poor performance in low contrast resolution in the 3D
space. Additionally, it is suggested that locating the target within the range of 4 cm around the isocenter during radiotherapy ensure the optimal spatial resolution and the CT value linearity. Overall, the new methods provide sufficient information for the CBCT image performance and thereby guiding the clinical applications of CBCT.
ACKNOWLEDGEMENT
The authors are grateful to radiotherapy staff of Zhongnan Hospital (Wuhan, China) for their
200
201
kind help in this study.
Conflicts of interest: Declared none.
REFERENCES
1. Dawson LA and Jaffray DA (2007) Advances in image-guided radiation therapy. Journal of Clinical Oncology Official
Jour-nal of the American Society of Clinical Oncology, 25(8):
938-946.
2. Ed JLM (2011) IMRT, IGRT, SBRT: advances in the treatment planning and delivery of radiotherapy. Karger Ag.
3. Gupta T and C Anand N (2012) Image-guided radiation ther-apy: Physician's perspectives. Journal of Medical Physics,
37(4): 351-355.
4. Zehtabian M, Faghihi R, Mosleh-Shirazi MA, Shakibafard AR, Mohammadi M, Baradaran-Ghahfarokhi M (2012) A Fast Model For Prediction Of Respiratory Lung Motion For Image-guided radiotherapy: A Feasibility Study. Int J Radiat Res, 10(2): 73-81.
5. Mahdavi SR, Jazayeri Gharehbagh E, Mofid B, Jafari AH, Nikoofar AR (2017) Accuracy of the dose delivery in prostate cancer patients-using an electronic portal imaging device (EPID). Int J Radiat Res, 15(1): 39-47.
6. Dawson LA and Sharpe MB (2006) Image-guided radiother-apy: rationale, benefits, and limitations. Lancet Oncology, 7
(10): 848-858.
7. Herman MG (2005) Clinical use of electronic portal imag-ing. Journal name??, 15(3): 157-167.
8. Lattanzi J, Mcneely S, Hanlon A, Das I, Schultheiss TE, Hanks GE (2012) Daily CT localization for correcting portal errors in the treatment of prostate cancer. Atmospheric
Measure-ment Techniques Discussions, 41(5): 7899-7921.
9. Meeks SL, Harmon JF, Langen KM, Willoughby TR, Wagner TH, Kupelian PA (2005) Performance characterization of megavoltage computed tomography imaging on a helical tomotherapy unit. Medical Physics, 32(8): 2673-2681. 10. Jaffray DA and Siewerdsen JH (2000) Cone-beam
comput-ed tomography with a flat-panel imager: Initial perfor-mance characterization. Medical Physics, 27: 1311-1323. 11. Pouliot J, Bani-Hashemi A, Chen J, Svatos M, Ghelmansarai
F, Mitschke M, et al. (2005) Low-dose megavoltage cone
-beam CT for radiation therapy. Int J Radiat Oncol Biol
Phys, 61(2): 552-560.
12. Johnston H, Hilts M, Beckham W, Berthelet E (2008) 3D ultrasound for prostate localization in radiation therapy: a comparison with implanted fiducial markers. Medical
Physics, 35(6): 2403-2413.
13. Lattanzi J, Mcneeley S, Das I, Schultheiss TE, Hanks GE (1999) A comparison of daily CT localization to a daily ultrasound-based system in prostate cancer. Int J Radiat
Oncol Biol Phys, 43(4): 719-725.
14. Baroni G, Ferrigno G, Orecchia R, Pedotti A (2000) Real
-time three-dimensional motion analysis for patient posi-tioning verification. Radiotherapy & Oncology, 54(1):
21-27.
15. Yin FF, Guan H, Lu W (2005) A technique for on-board CT reconstruction using both kilovoltage and megavoltage beam projections for 3D treatment verification. Medical
Physics, 32(9): 2819-2826.
16. Cranmer-Sargison G, Kundapur V, Tu D, Ternes S, Vachhra-jani H, Sidhu NP (2011) Using kV-kV and CBCT imaging to evaluate rectal cancer patient position when treated prone on a newly available belly board. Medical Dosime-try, 37(2): 117-121.
17. Yoo S, Kim G, Hammoud R, Elder E, Pawlicki T, Guan H, et al. (2006) A quality assurance program for the on-board imager®. Medical Physics, 33(11): 4431.
18. Siewerdsen JH and Jaffray DA (2001) Cone-beam computed tomography with a flat-panel imager: Magnitude and effects of X-ray scatter. Medical Physics, 28(2): 220-231. 19. Arai Y, Tammisalo E, Iwai K, Hashimoto K, Shinoda K (1999)
Development of a compact computed tomographic appa-ratus for dental use. Dentomaxillofacial Radiology, 28(4):
378-379.
20. Bissonnette J, Balter PA, Dong L, Langen KM, Lovelock DM, Miften M, et al. (2012) Quality assurance for image-guided radiation therapy utilizing CT-based technologies: A report of the AAPM TG-179. Medical Physics, 39(4): 1946-1963. 21. Bissonnette JP, Moseley DJ, Jaffray DA (2008) A quality
assurance program for image quality of cone-beam CT guidance in radiation therapy. Med Phys , 35(5):
1807-1815.
22. Steiding C, Kolditz D, Kalender WA (2014) A quality assur-ance framework for the fully automated and objective evaluation of image quality in cone-beam computed to-mography. Medical Physics, 41(3): 31901.
23. Fahrig R, Dixon R, Payne T, Morin RL, Ganguly A, Strobel N (2006) Dose and image quality for a cone-beam C-arm CT system. Medical Physics, 33(12): 70-73.
24. Mackie TR, Kapatoes J, Ruchala K, Lu W, Wu C, Olivera G, et al. (2003) Image guidance for precise conformal radiother-apy. Int J Radiat Oncol Biol Phys, 56(1): 89-105.
25. Yu L, Vrieze TJ, Bruesewitz MR, Kofler JM, Delone DR, Pal-lanch JF, et al. (2010) Dose and image quality evaluation of a dedicated cone-beam CT system for high-contrast neurologic applications. American Journal of Roentgenolo-gy, 194(2): 193-201.
26. Kwan AL, Boone JM, Yang K, Huang SY (2007) Evaluation of the spatial resolution characteristics of a cone-beam breast CT scanner. Med Phys, 34(1): 275-281.
27. Morin O, Chen J, Descovich M, Hashemi AB, Descovich M, Pouliot J (2009) Physical performance and image optimiza-tion of megavoltage cone-beam CT. Medical Physics, 36
(4): 1421.
28. Ding GX, Duggan DM, Coffey CW, Deeley M, Hallahan DE, Cmelak, A, et al. (2007) A study on adaptive IMRT treat-ment planning using kV cone-beam CT. Radiotherapy and
Oncology, 85(1): 116-125.
29. Létourneau D, Wong JW, Oldham M, Gulam M, Watt L, & Jaffray D. A, et al. (2005) Cone-beam-CT guided radiation therapy: technical implementation. Radiotherapy and
Oncology. ; 75(3): 279-286.
30. Cheng HCY, Wu VWC, Liu ESF, Kwong DLW (2011) Evalua-tion of RadiaEvalua-tion Dose and Image Quality for the Varian Cone Beam Computed Tomography System. Int J Radiat
Oncol Biol Phys, 80(1): 291-300.
31. Stock M and Pasler MW (2009) Image quality and stability of image-guided radiotherapy (IGRT) devices: A compara-tive study. Radiotherapy and Oncology, 93(1): 1-7. 32. Sumida I, Yamaguchi H, Kizaki H, Yamada Y, Koizumi M, &
Yoshioka, Y, et al. (2014) Evaluation of imaging perfor-mance of megavoltage cone-beam CT over an extended period. Journal of Radiation Research, 55(1): 191-199. 33. Smith BD (1985) Image Reconstruction from Cone-Beam
Projections: Necessary and Sufficient Conditions and Re-construction Methods. IEEE Transactions on Medical Im-aging, 4(1): 14-25.
34. Grangeat P (1991) Mathematical framework of cone beam 3D reconstruction via the first derivative of the radon transform: Lecture Notes in Mathematics, 1466-1497. 35. Feldkamp LA, Davis LC, Kress JW (1984) Practical cone
-beam algorithm. Journal of the Optical Society of America
A, 1(6): 612-619.
36. Faccioli N, Barillari M, Guariglia S, Zivelonghi E, Rizzotti A, & Cerini, R, et al. (2009) Radiation dose saving through the use of cone-beam CT in hearing-impaired patients. La
Radiologia Medica, 114(8): 1308-1318.
37. Sharpe MB, Moseley DJ, Purdie TG, Islam M, Siewerdsen
JH, et al. (2006) The stability of mechanical calibration for
a kV cone beam computed tomography system integrat-ed with linear acceleratora. Medical Physics, 33(1): 136-144.
38. Cheng HCY, Wu VWC, Liu ESF, Kwong DLW (2011) Evalua-tion of RadiaEvalua-tion Dose and Image Quality for the Varian Cone Beam Computed Tomography System. Int J Radiat
Oncol Biol Phys, 80(1): 291-300.
39. Landry G, Nijhuis R, Dedes G, Handrack J, Thieke C, & Janssens G, et al. (2015) Investigating CT to CBCT image registration for head and neck proton therapy as a tool for daily dose recalculation. Medical Physics, 42(3):
1354-1366.